

Textiles
Gokaldas Exports Ltd.- Q4 Results Analysis & Conference Call Highlights
2nd May, 2022 Report Covers: About the company Results and Conference Call Highlights Financials Conclusion Initial Coverage on the company (attached) Research Analyst: Gunjan Kabra (info@gunjankabra.com) Healthy Order Book, Sector Tailwinds and Capacity Expansion to drive growth. 1. About the company Leading Apparel Exporter in India Annual Capacity: 30 million pieces per annum Product Category: Casual Wear,
2nd May, 2022
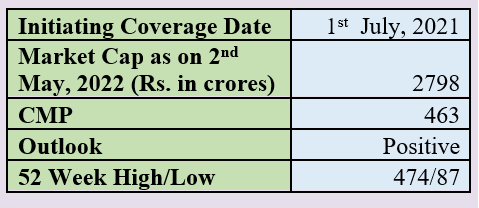
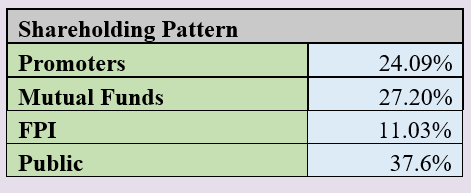
Report Covers:
Research Analyst: Gunjan Kabra (info@gunjankabra.com)
Healthy Order Book, Sector Tailwinds and Capacity Expansion to drive growth.
1. About the company
2. Q4 FY22 Results and Conference Call Highlights:
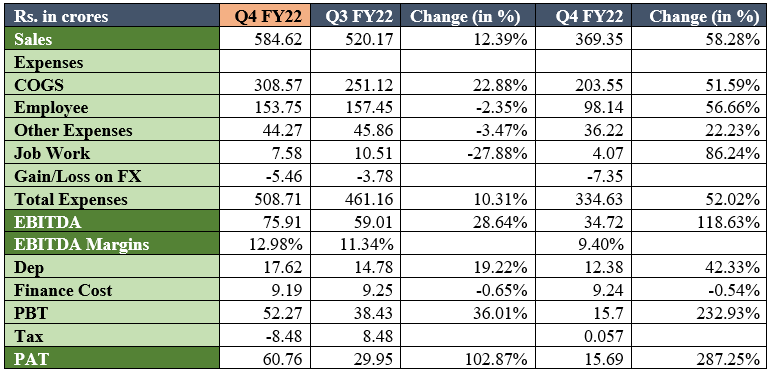
A. Why margins improved in the current quarter?
Going forward,
B. Demand Scenario
C. PLI scheme approval
The company received an approval in the government PLI Scheme. The Madhya Pradesh expansion is under PLI Scheme. The incentive would start reaping in from FY25. The company plans to invest Rs. 149 crores under the PLI Scheme.
D. Product Mix on RM Basis
E. Capacity Expansion Plans:

Capex in Bangladesh: The company is deciding whether to lease or build its own capacity. Mostly, they plan to opt for leasing method.
F. Other Insights: The company has generated 15% revenue from new customers. 40-45% of the client base has long term relationship.
3. Financials
4. Conclusion
Overall, the management sounded positive in the conference call. Overall, production cost in China is going up and also labor demographics there is aging and cost is increasing in Vietnam too. There might be issues like hike in raw materials and demand issues in the US due to inflation in short term but we think the apparel segment in India can do really well in long term. With government focus on exports of apparels/textiles, small base of apparel exports, India, being cost competitive in the cotton value chain globally and low investments require to expand in apparel segment can aid well for apparel exports in India in next 3-5 years.
The COVID accelerated China plus one and supply-side consolidation trend, the company has been able to gain market share and increase exports. This company is expected to do well as it is quite agile in handling product varieties, timely delivery (important metric) and maintaining margins and at the same time, we need to closely watch the geo-political issues and inflationary environment in the US.
We continue to maintain positive outlook on the company.
To view our initial coverage on Gokaldas Exports Ltd.
Click hereOutlook Interpretation –
Positive – Expected Return of 12%+ on annualized basis in the long term Neutral – Expected return in the range of +/- 12%
Negative – Expected return in negative
Disclaimer:
Niveshaay is a SEBI Registered (SEBI Registration No. INA000008552) Investment Advisory Firm. The research and reports express our opinions which we have based upon generally available public information, field research, inferences and deductions through our due diligence and analytical process. To the best of our ability and belief, all information contained here is accurate, reliable and has been obtained from public sources which we believe to be accurate and reliable. We make no representation, express or implied, as to the accuracy, timeliness, or completeness of any such information or with regard to the results obtained from its use. This report does not represent an investment advice or a recommendation or a solicitation to buy any securities.
Disclaimers and Disclosures
SEBI Registration No. :INH000017338, IN/AIF3/24-25/1571, IN/AIF2/24-25/1607 | BASL Membership ID: 6276
Investment in Securities Market are subject to market risks. Read all related documents carefully before investing. The securities quoted are for illustration only and are not recommendatory. Registration granted by SEBI, membership of a SEBI recognized supervisory body (if any) and certification from NISM in no way guarantee performance of the intermediary or provide any assurance of returns to investors.
Electric Vehicle & Ancillaries
‘The Vijay Kedia Meet’
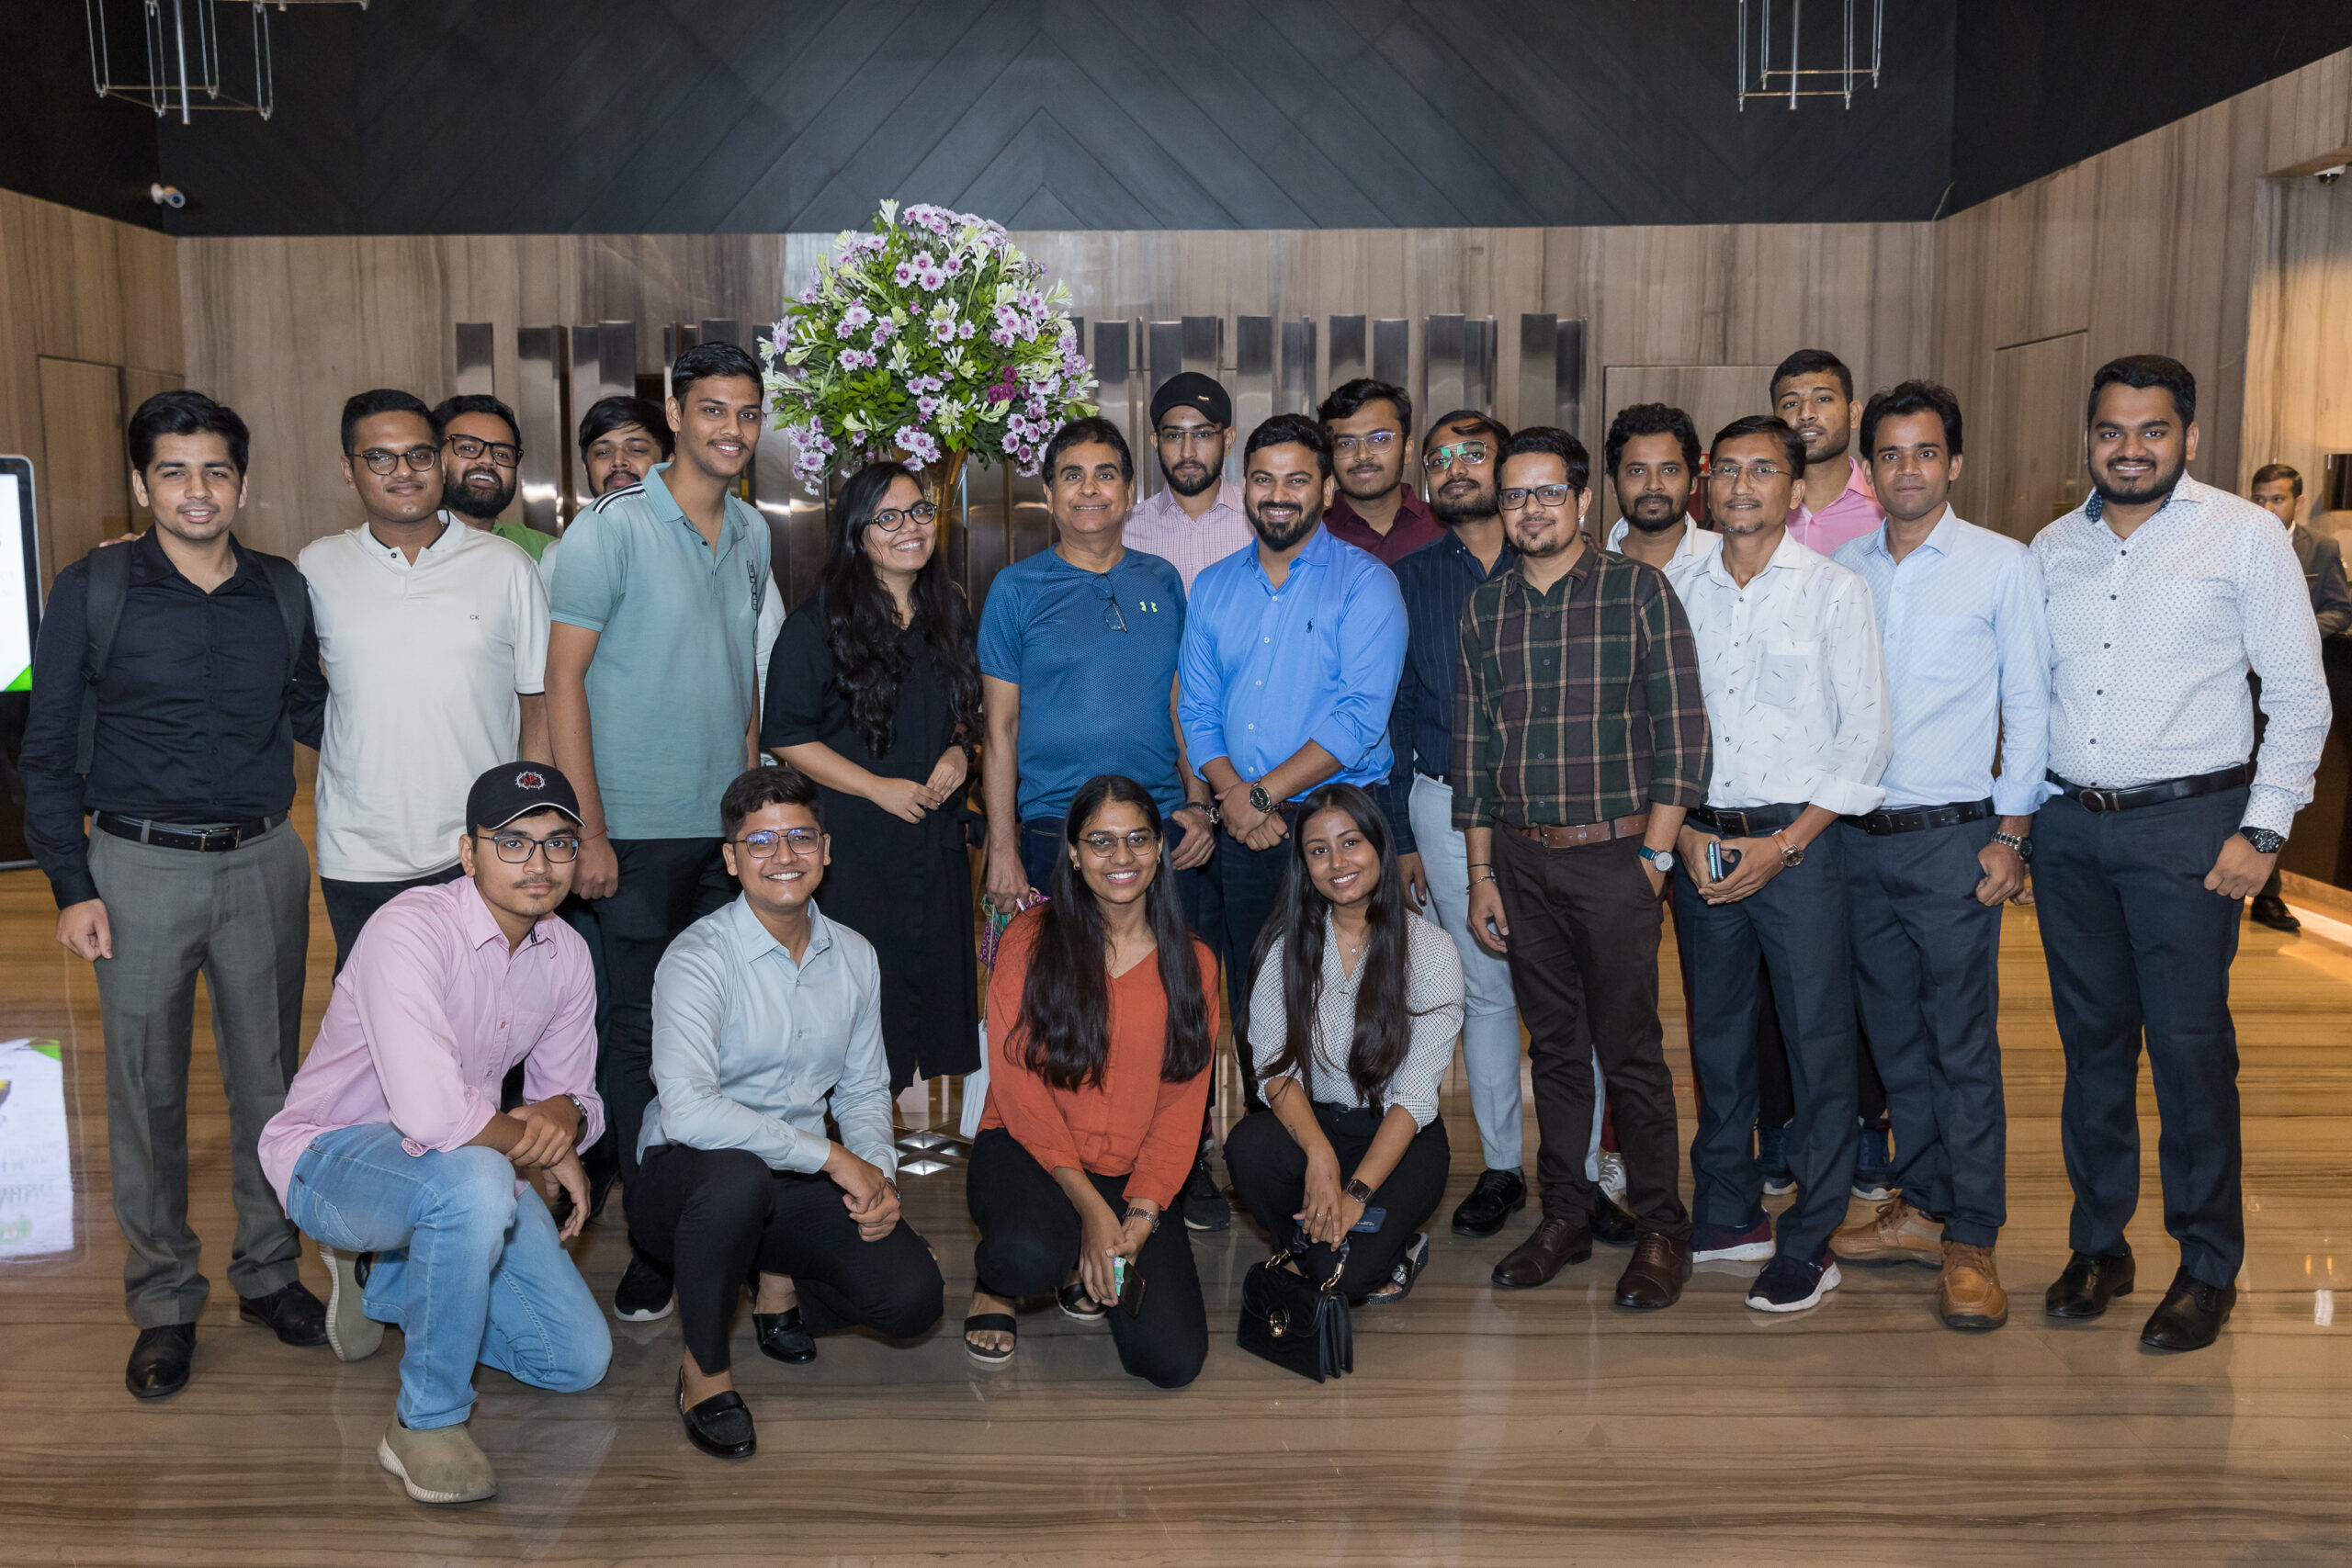
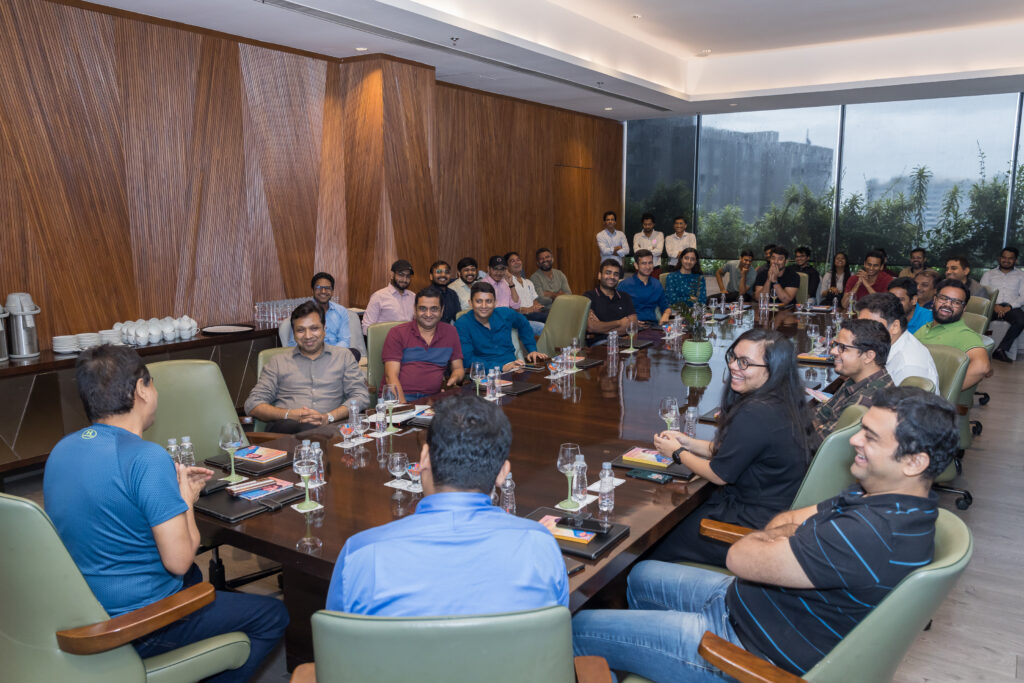
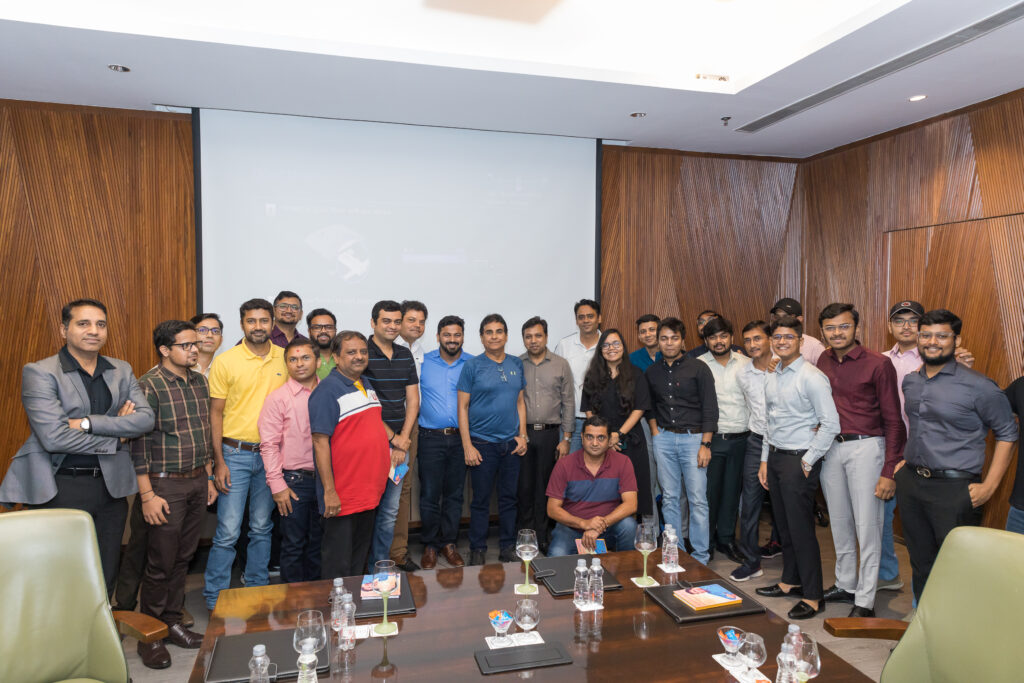
The Niveshaay team got lucky to get an opportunity to meet and interact with Mr. Vijay Kedia who is know for his spectacular success in investments like Atul Auto Ltd. (100x), Cera Sanitaryware (100x) and Aegis Logistics (40x) to name a few. It was a completely different experience to know about his journey from the
The Niveshaay team got lucky to get an opportunity to meet and interact with Mr. Vijay Kedia who is know for his spectacular success in investments like Atul Auto Ltd. (100x), Cera Sanitaryware (100x) and Aegis Logistics (40x) to name a few. It was a completely different experience to know about his journey from the person himself. He has written some incredible quotes and known for his prowess of striking the right note on the essence of stock markets through his singing compositions.

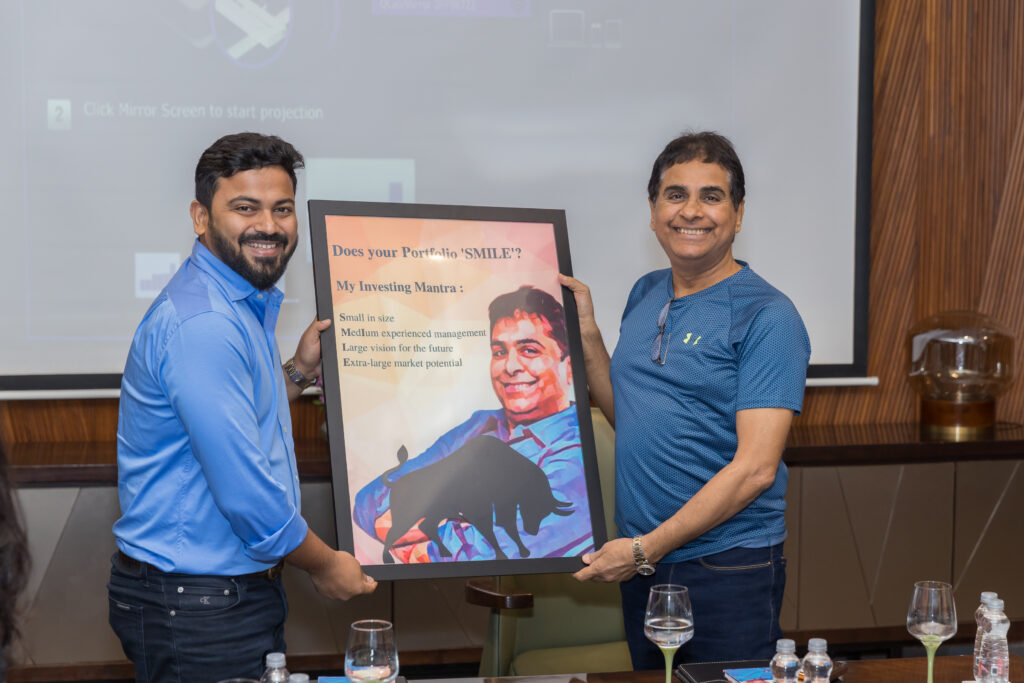
Few things that we learnt from him that we think are worth their weight in gold:
Small in Size
Medium In experience
Large in Aspirations
Extra-large in market potential
A company which is smaller in size is always a better opportunity to look for because a smaller company like a fish has huge potential to penetrate or gain more market share and become the crocodile whereas, for a sizeable company to grow or penetrate further in a pond is comparably more difficult. He very famously quotes ‘fish in an ocean is far better than a crocodile in a pond’.
Medium in experience means he looks out for management that have an experience of 15-20 years and should have seen 2-3 down cycles with good times in their business graph. Such downcycles are great source of learning’s for the management to judiciously allocate the capital and earn prosperous returns. This gives them the ability to drive growth in the right direction.
Oh! We could completely relate to this mantra as our primary focus is on small-mid cap companies.

Out of these three, Courage is the most important. Idea can be borrowed but not conviction. Without courage, it is not possible to have higher allocation in a stock and stick to a company without any fear if the price isn’t moving. Sometimes, it takes time for the market to give value to a company. He shared how he pitched his investment rationale of Atul Auto Ltd and Cera Sanitaryware Ltd. to institutions but no one believed it. Rome was not built in a day. Similarly, it takes time to build a strong portfolio. Build your own conviction, invest, keep patience and move on. Atul Auto Ltd. is a classic example on how on the basis of his strong conviction, he took 20% stake in the company. He even went to China with the promoters for business development.
He explains when you use a torch, it gives a vision of upto 25 meters. You can’t see things which are 100 meters distant from you, right? Investing also works the similar way. On the first day, it’s difficult to predict the growth trajectory in next 8-10 years. Invest in a sunrise sector, observe progress at regular intervals and stay invested if it’s going according to your investment thesis.
The company might have excellent product offerings, ultimately the management is responsible to thrive the company. The management of the company must have hunger to grow, shrewd business acumen, honest intentions, undying passion towards work and much more. Observe body language and tone of management- speaks volume about their characteristics.
"Alone you can go fast, together you can go far". He applies this in his investing strategy aptly. He believes, a good team is a must to grow the business multi-fold rather than having a one man show.
Whenever, we meet such experienced investors, we think how lucky our we to get their wisdom at such young age. Of course, your own experience is important but meeting and learning from them can help us to avoid some mistakes and become a more informed investor. Reading about a person and meeting in person is altogether a different experience. Happy to have this opportunity.
Ending with his two very good quotes:-
Disclaimers and Disclosures
SEBI Registration No. :INH000017338, IN/AIF3/24-25/1571, IN/AIF2/24-25/1607 | BASL Membership ID: 6276
Investment in Securities Market are subject to market risks. Read all related documents carefully before investing. The securities quoted are for illustration only and are not recommendatory. Registration granted by SEBI, membership of a SEBI recognized supervisory body (if any) and certification from NISM in no way guarantee performance of the intermediary or provide any assurance of returns to investors.

Consumer Durables, Services & Consumption
Launch – Niveshaay Consumer Trends Portfolio
India is a consumption-driven story. What works in India’s favor on the private consumption front is the size of its consumer base, the rising income, and the aspirations of its young population, which is the largest in the world. As for investments, with the size and scale of operations it has to offer to global companies, the availability
India is a consumption-driven story. What works in India’s favor on the private consumption front is the size of its consumer base, the rising income, and the aspirations of its young population, which is the largest in the world. As for investments, with the size and scale of operations it has to offer to global companies, the availability of skill and talent, and technology and innovation capabilities, India continues to be an attractive investment destination. India can rely on its own domestic demand to firepower its growth, specifically, private consumption (accounts 60% of its GDP) and investment spending. What adds an intriguing dimension is the convergence of both these favorable conditions.
The government's emphasis on substantial capital expenditure, encouraging higher private capital spending, creates a multiplier effect on the economy by generating employment, boosting per capita income, and ultimately driving consumption demand. Additionally, India has reached a crucial inflection point, surpassing a GDP per capita of $2500. Historical examples from countries like the United States in the 1950s/60s, Germany in the 1960s, Japan in the 1970s, South Korea in the 1980s, and more recently, China in the 2000s, indicating accelerated consumption, particularly in discretionary spending.
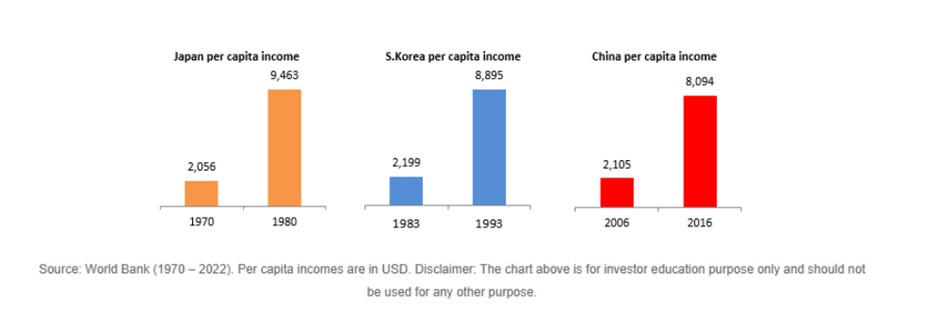
Here, are several noteworthy trends observed in India:
In response to these trends, we’ve devised a smallcase to capitalize on Indian consumption trends, a long-term defensive structural play.
This thematic portfolio is curated to include companies that stand to benefit from prevailing consumption trends. It is tailored for investors seeking opportunities with a 3–5-year investment horizon and who are comfortable with mid to high-risk category investments. The portfolio predominantly comprises major players from the mid and small-cap segments.
Disclaimer:
Investment in securities market are subject to market risks. Read all the related documents carefully before investing. The content in these posts/articles is for informational and educational purposes only and should not be construed as professional financial advice and nor to be construed as an offer to buy /sell or the solicitation of an offer to buy / sell any security or financial products.
Registration granted by SEBI, membership of BASL and certification from NISM in no way guarantee performance of the intermediary or provide any assurance of returns to investors.
The securities quoted are for illustration only and are not recommendatory.
Disclaimers and Disclosures
SEBI Registration No. :INH000017338, IN/AIF3/24-25/1571, IN/AIF2/24-25/1607 | BASL Membership ID: 6276
Investment in Securities Market are subject to market risks. Read all related documents carefully before investing. The securities quoted are for illustration only and are not recommendatory. Registration granted by SEBI, membership of a SEBI recognized supervisory body (if any) and certification from NISM in no way guarantee performance of the intermediary or provide any assurance of returns to investors.

Electronic Manufacturing Services
Key Insights from Smart Metering Summit
India's ambitious goals of achieving 500 GW of renewable energy capacity by 2030 and becoming a net-zero economy by 2070 underscore the critical need for advancements in grid management. The deployment of smart meters is essential for this transition. The Indian smart meter market is experiencing unprecedented growth, driven by a strong governmental push for grid modernization and energy
India's ambitious goals of achieving 500 GW of renewable energy capacity by 2030 and becoming a net-zero economy by 2070 underscore the critical need for advancements in grid management. The deployment of smart meters is essential for this transition.
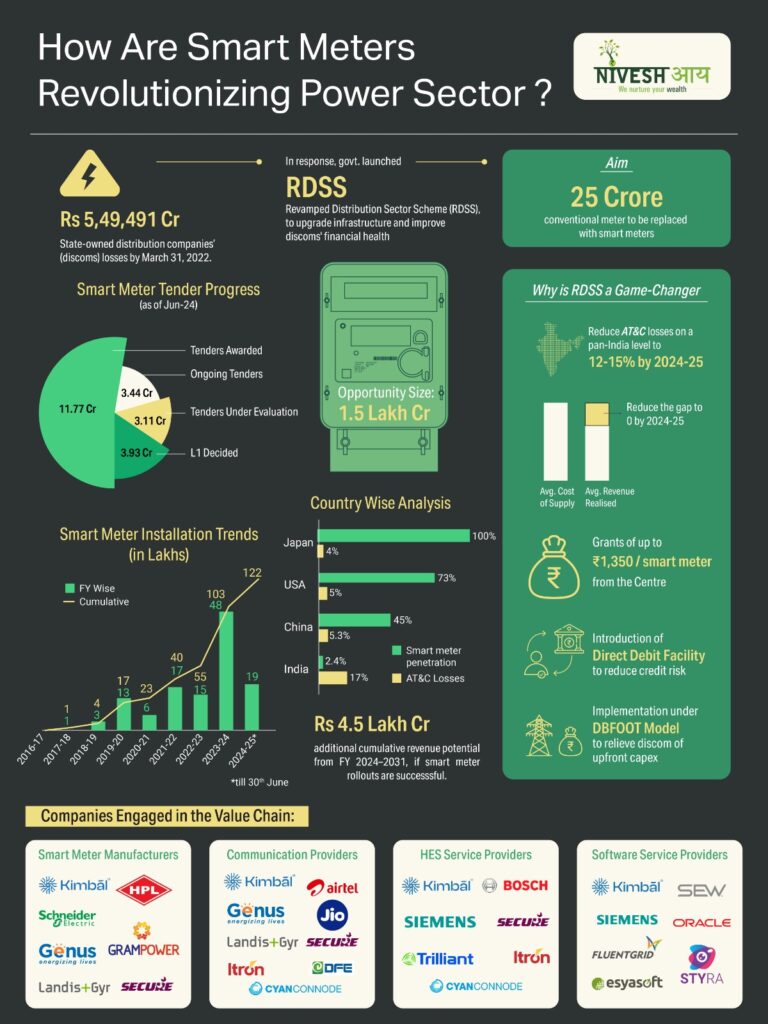
The Indian smart meter market is experiencing unprecedented growth, driven by a strong governmental push for grid modernization and energy efficiency. The target of installing 250 million smart meters highlights the scale of this transformation.
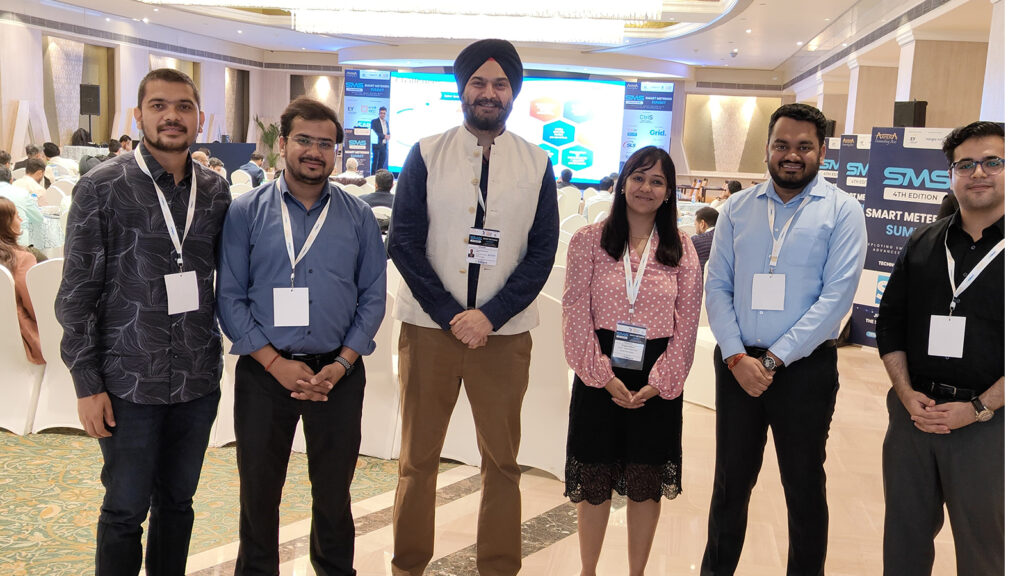
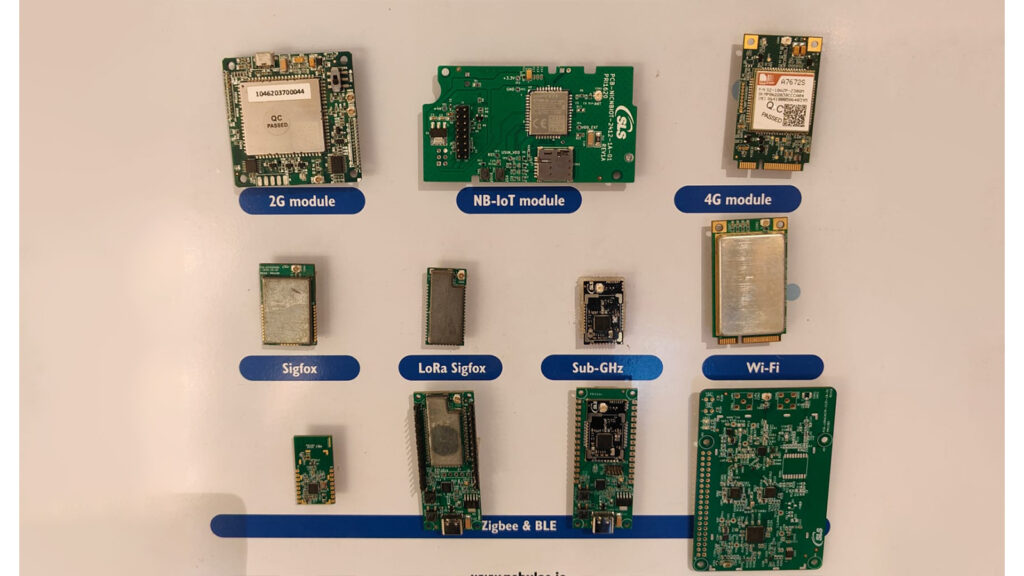
To gain key insights, we attended the Smart Metering Summit 4th edition, where we engaged with various industry players across the smart meter value chain. Here are key insights from the event:
Opportunity and Execution Status
Successful Implementation Factors:
For India's smart meter program, efficient network coverage is vital, with RF, Cellular, and NB-IoT technologies playing key roles. India uses RF and Cellular based on regional needs. Cloud solutions must be well-sized and balanced between IaaS, PaaS, and SaaS for effective data management. Cybersecurity is critical to protect data and system integrity. Additionally, maintaining system reliability while managing costs is essential for a durable and cost-effective smart meter rollout.
Challenges that the industry is facing:
Thebenefits of smart meters extend beyond just reducing Aggregate Technical & Commercial (AT&C) losses. These include:
In a nutshell, industry stakeholders including utilities, Advanced Metering Infrastructure Service Providers (AMISPs), Original Equipment Manufacturers (OEMs), communication solution providers, and software and cybersecurity experts—expressed a unified optimism at the substantial rollout of smart meters in India. Their collective enthusiasm reflects confidence in overcoming challenges and achieving significant advancements in grid management, operational efficiency, and consumer engagement through this massive deployment

Disclaimers and Disclosures
SEBI Registration No. :INH000017338, IN/AIF3/24-25/1571, IN/AIF2/24-25/1607 | BASL Membership ID: 6276
Investment in Securities Market are subject to market risks. Read all related documents carefully before investing. The securities quoted are for illustration only and are not recommendatory. Registration granted by SEBI, membership of a SEBI recognized supervisory body (if any) and certification from NISM in no way guarantee performance of the intermediary or provide any assurance of returns to investors.
Textiles
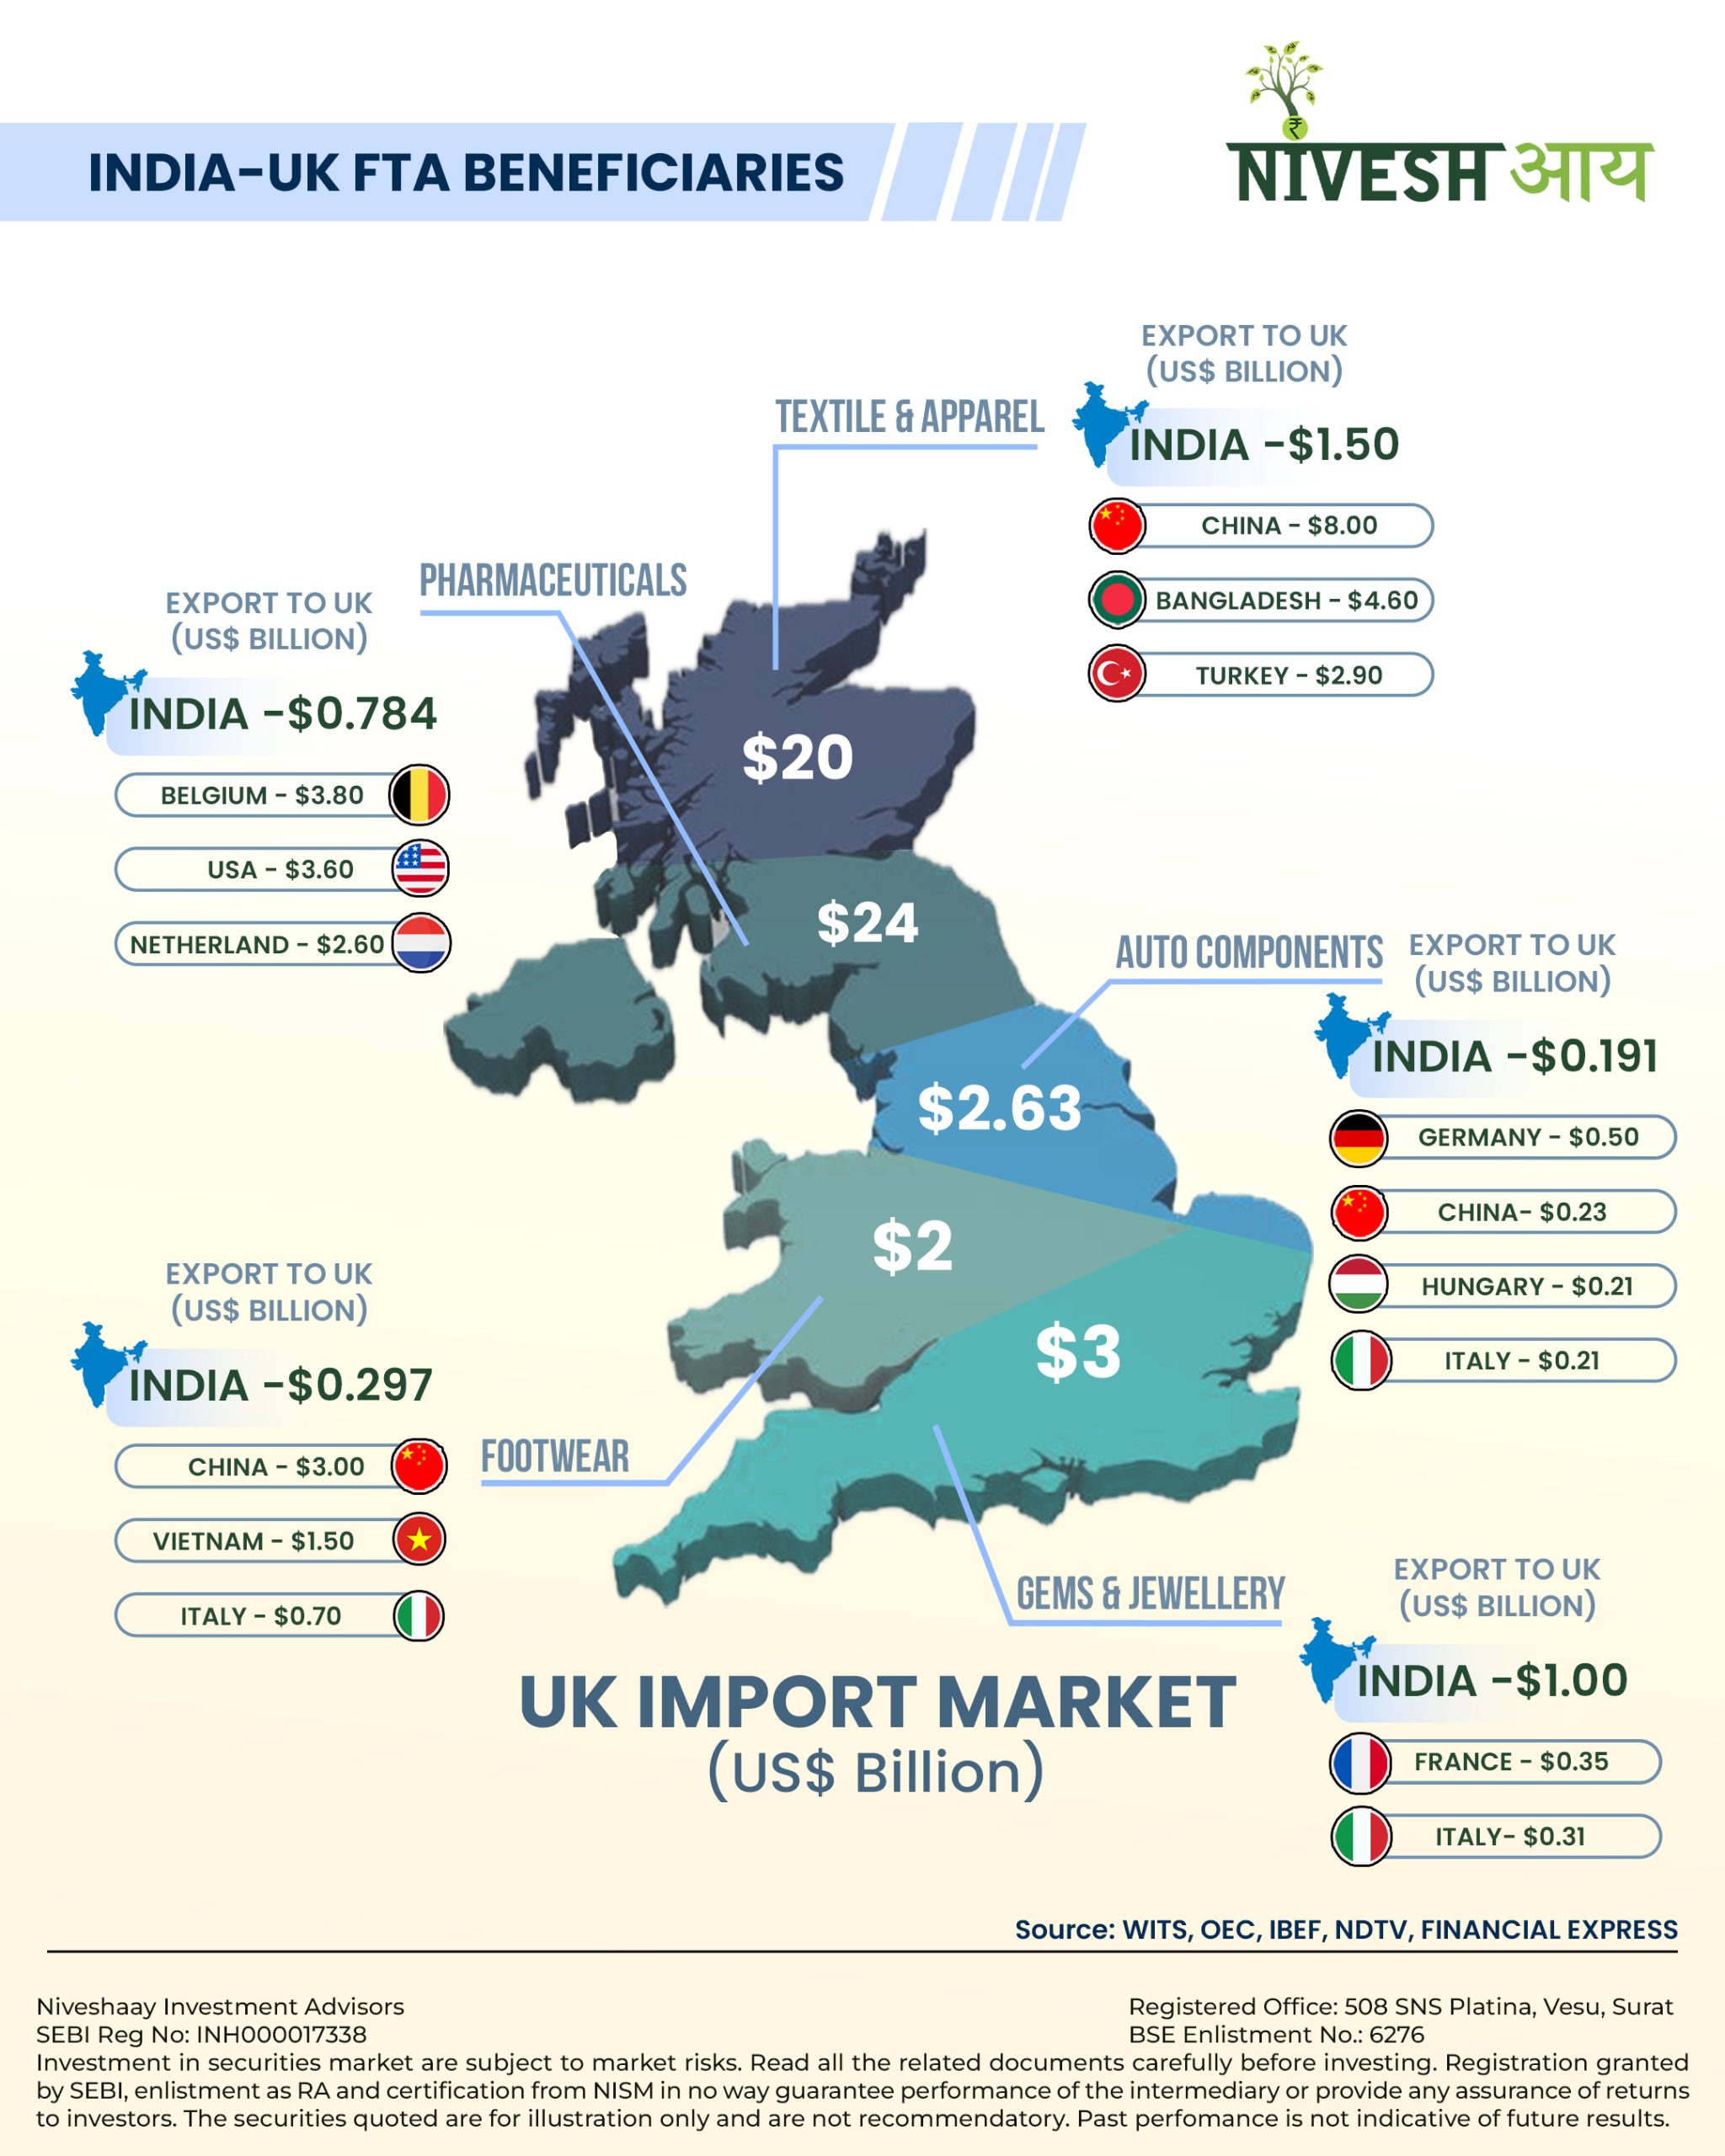
INDIA – UK FTA BENEFICIARIES
As high tariffs fade, Indian exports are poised for unprecedented access to the UK market, unlocking routes long constrained by regulatory and cost barriers. 📉🚀The proposed FTA signals a turning point in bilateral trade — one that could elevate India’s standing in the UK market and foster long-term economic alignment. 🔁📦
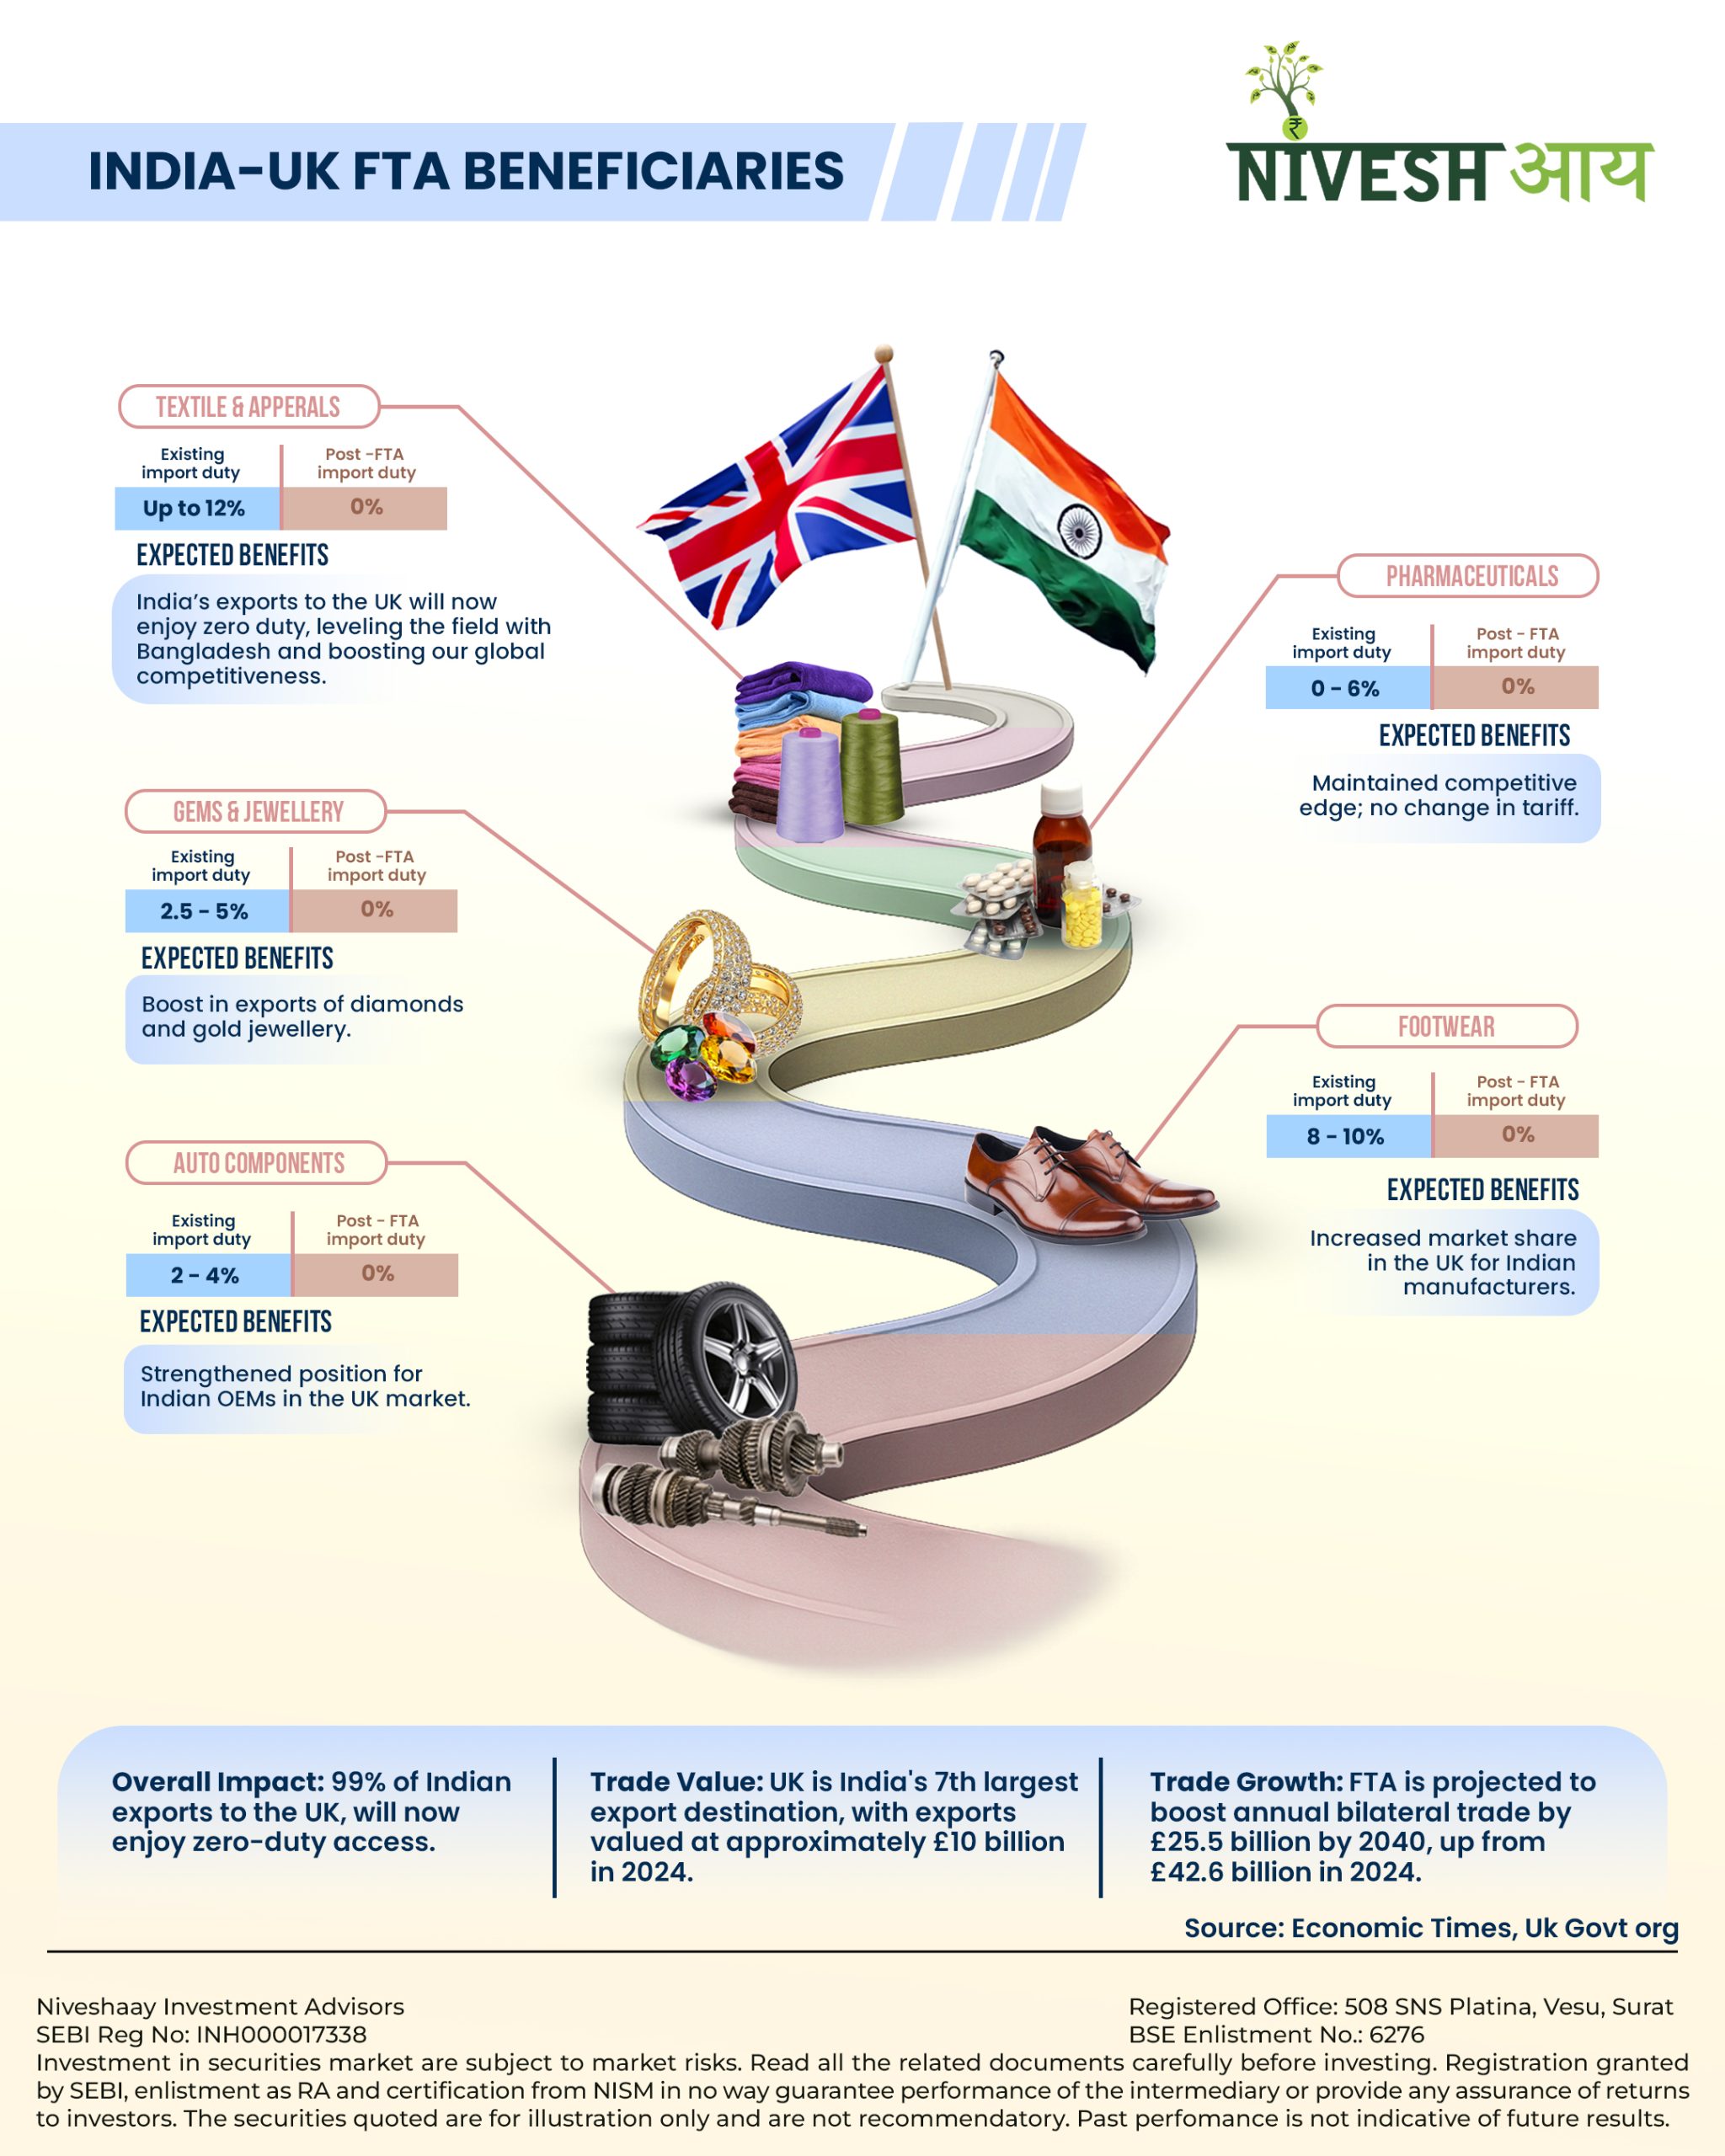
As high tariffs fade, Indian exports are poised for unprecedented access to the UK market, unlocking routes long constrained by regulatory and cost barriers. 📉🚀
The proposed FTA signals a turning point in bilateral trade — one that could elevate India’s standing in the UK market and foster long-term economic alignment. 🔁📦
Consumer Durables, Services & Consumption
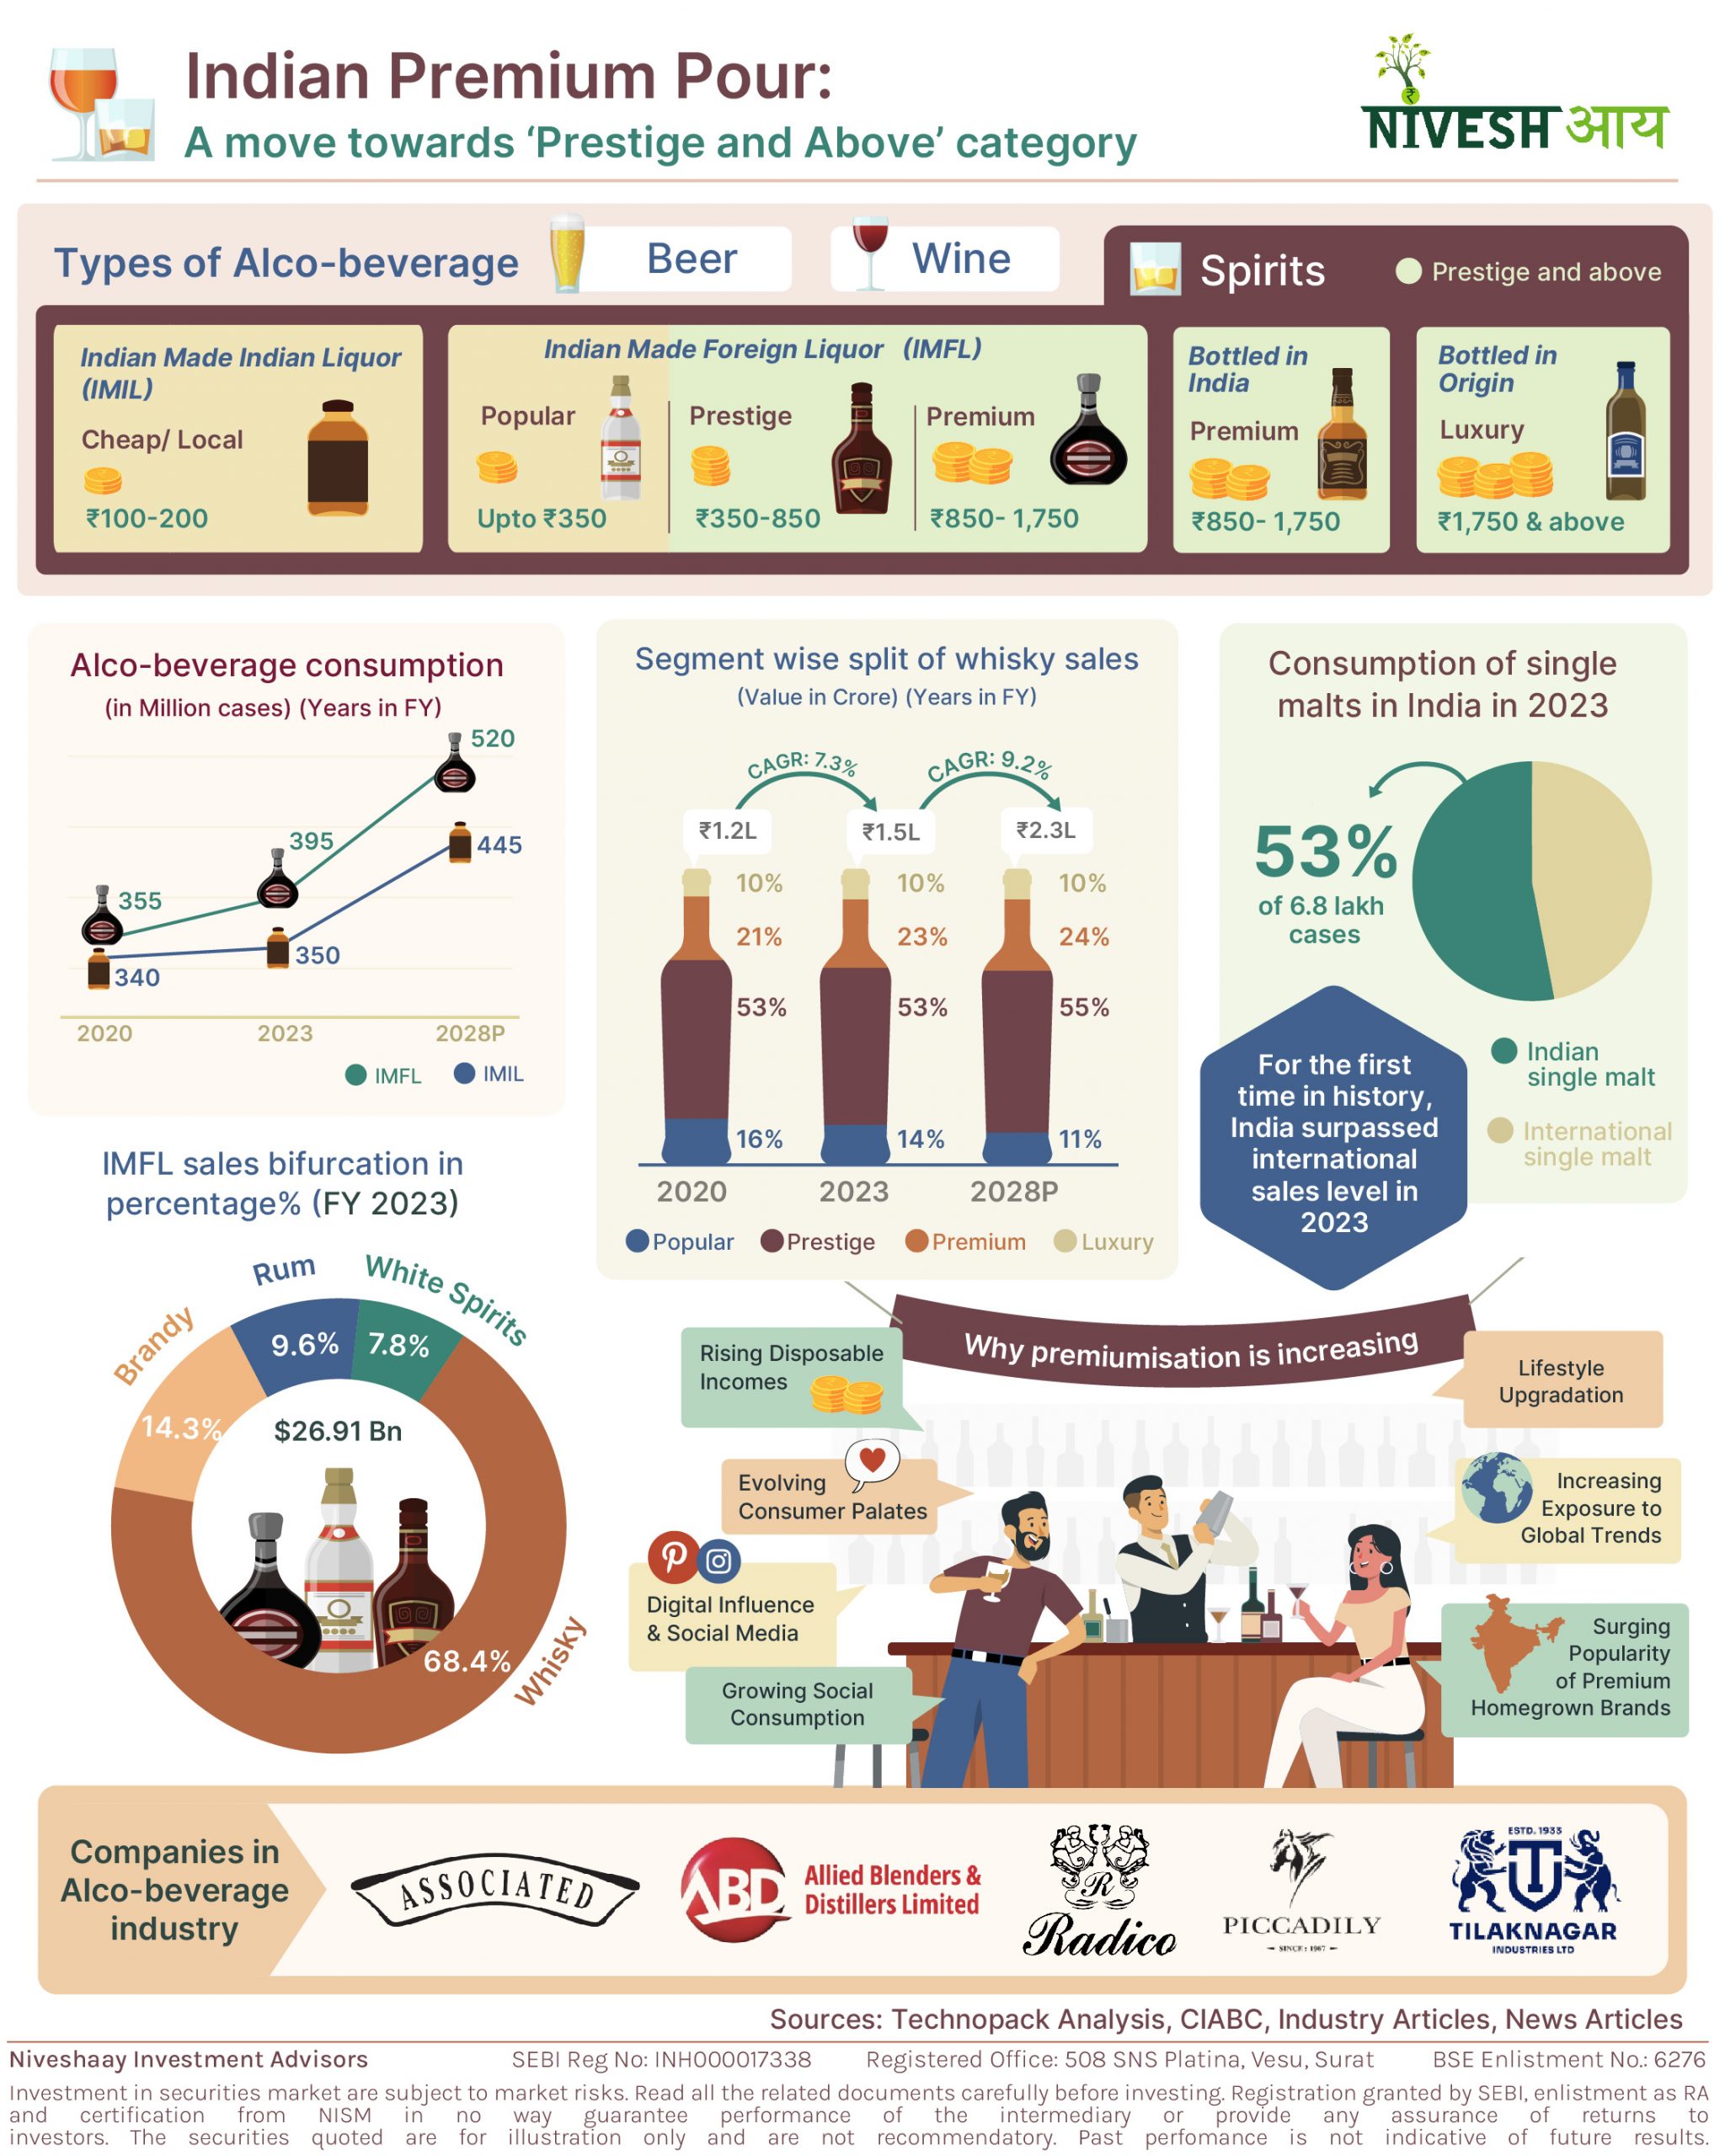
India’s Whisky & Spirits Revolution
A 10-year-old Indian whisky can mature like a 40-year-old Scotch — thanks to our tropical climate. With whisky accounting for 68% of IMFL and the market projected at ₹2.3 lakh crore by 2028, India is becoming a premium spirits leader. 🌎 🏅 Indian single malts like Indri and Amrut Triparva are earning top honors globally,
A 10-year-old Indian whisky can mature like a 40-year-old Scotch — thanks to our tropical climate. With whisky accounting for 68% of IMFL and the market projected at ₹2.3 lakh crore by 2028, India is becoming a premium spirits leader. 🌎 🏅 Indian single malts like Indri and Amrut Triparva are earning top honors globally, while Jin Jiji, a premium Indian gin, is also turning heads with international acclaim. This isn’t just a trend — it's a transformation.

Pharmaceuticals
Rapid Growth of the GLP-1 Drug Market: Trends, Players, and Future Prospects
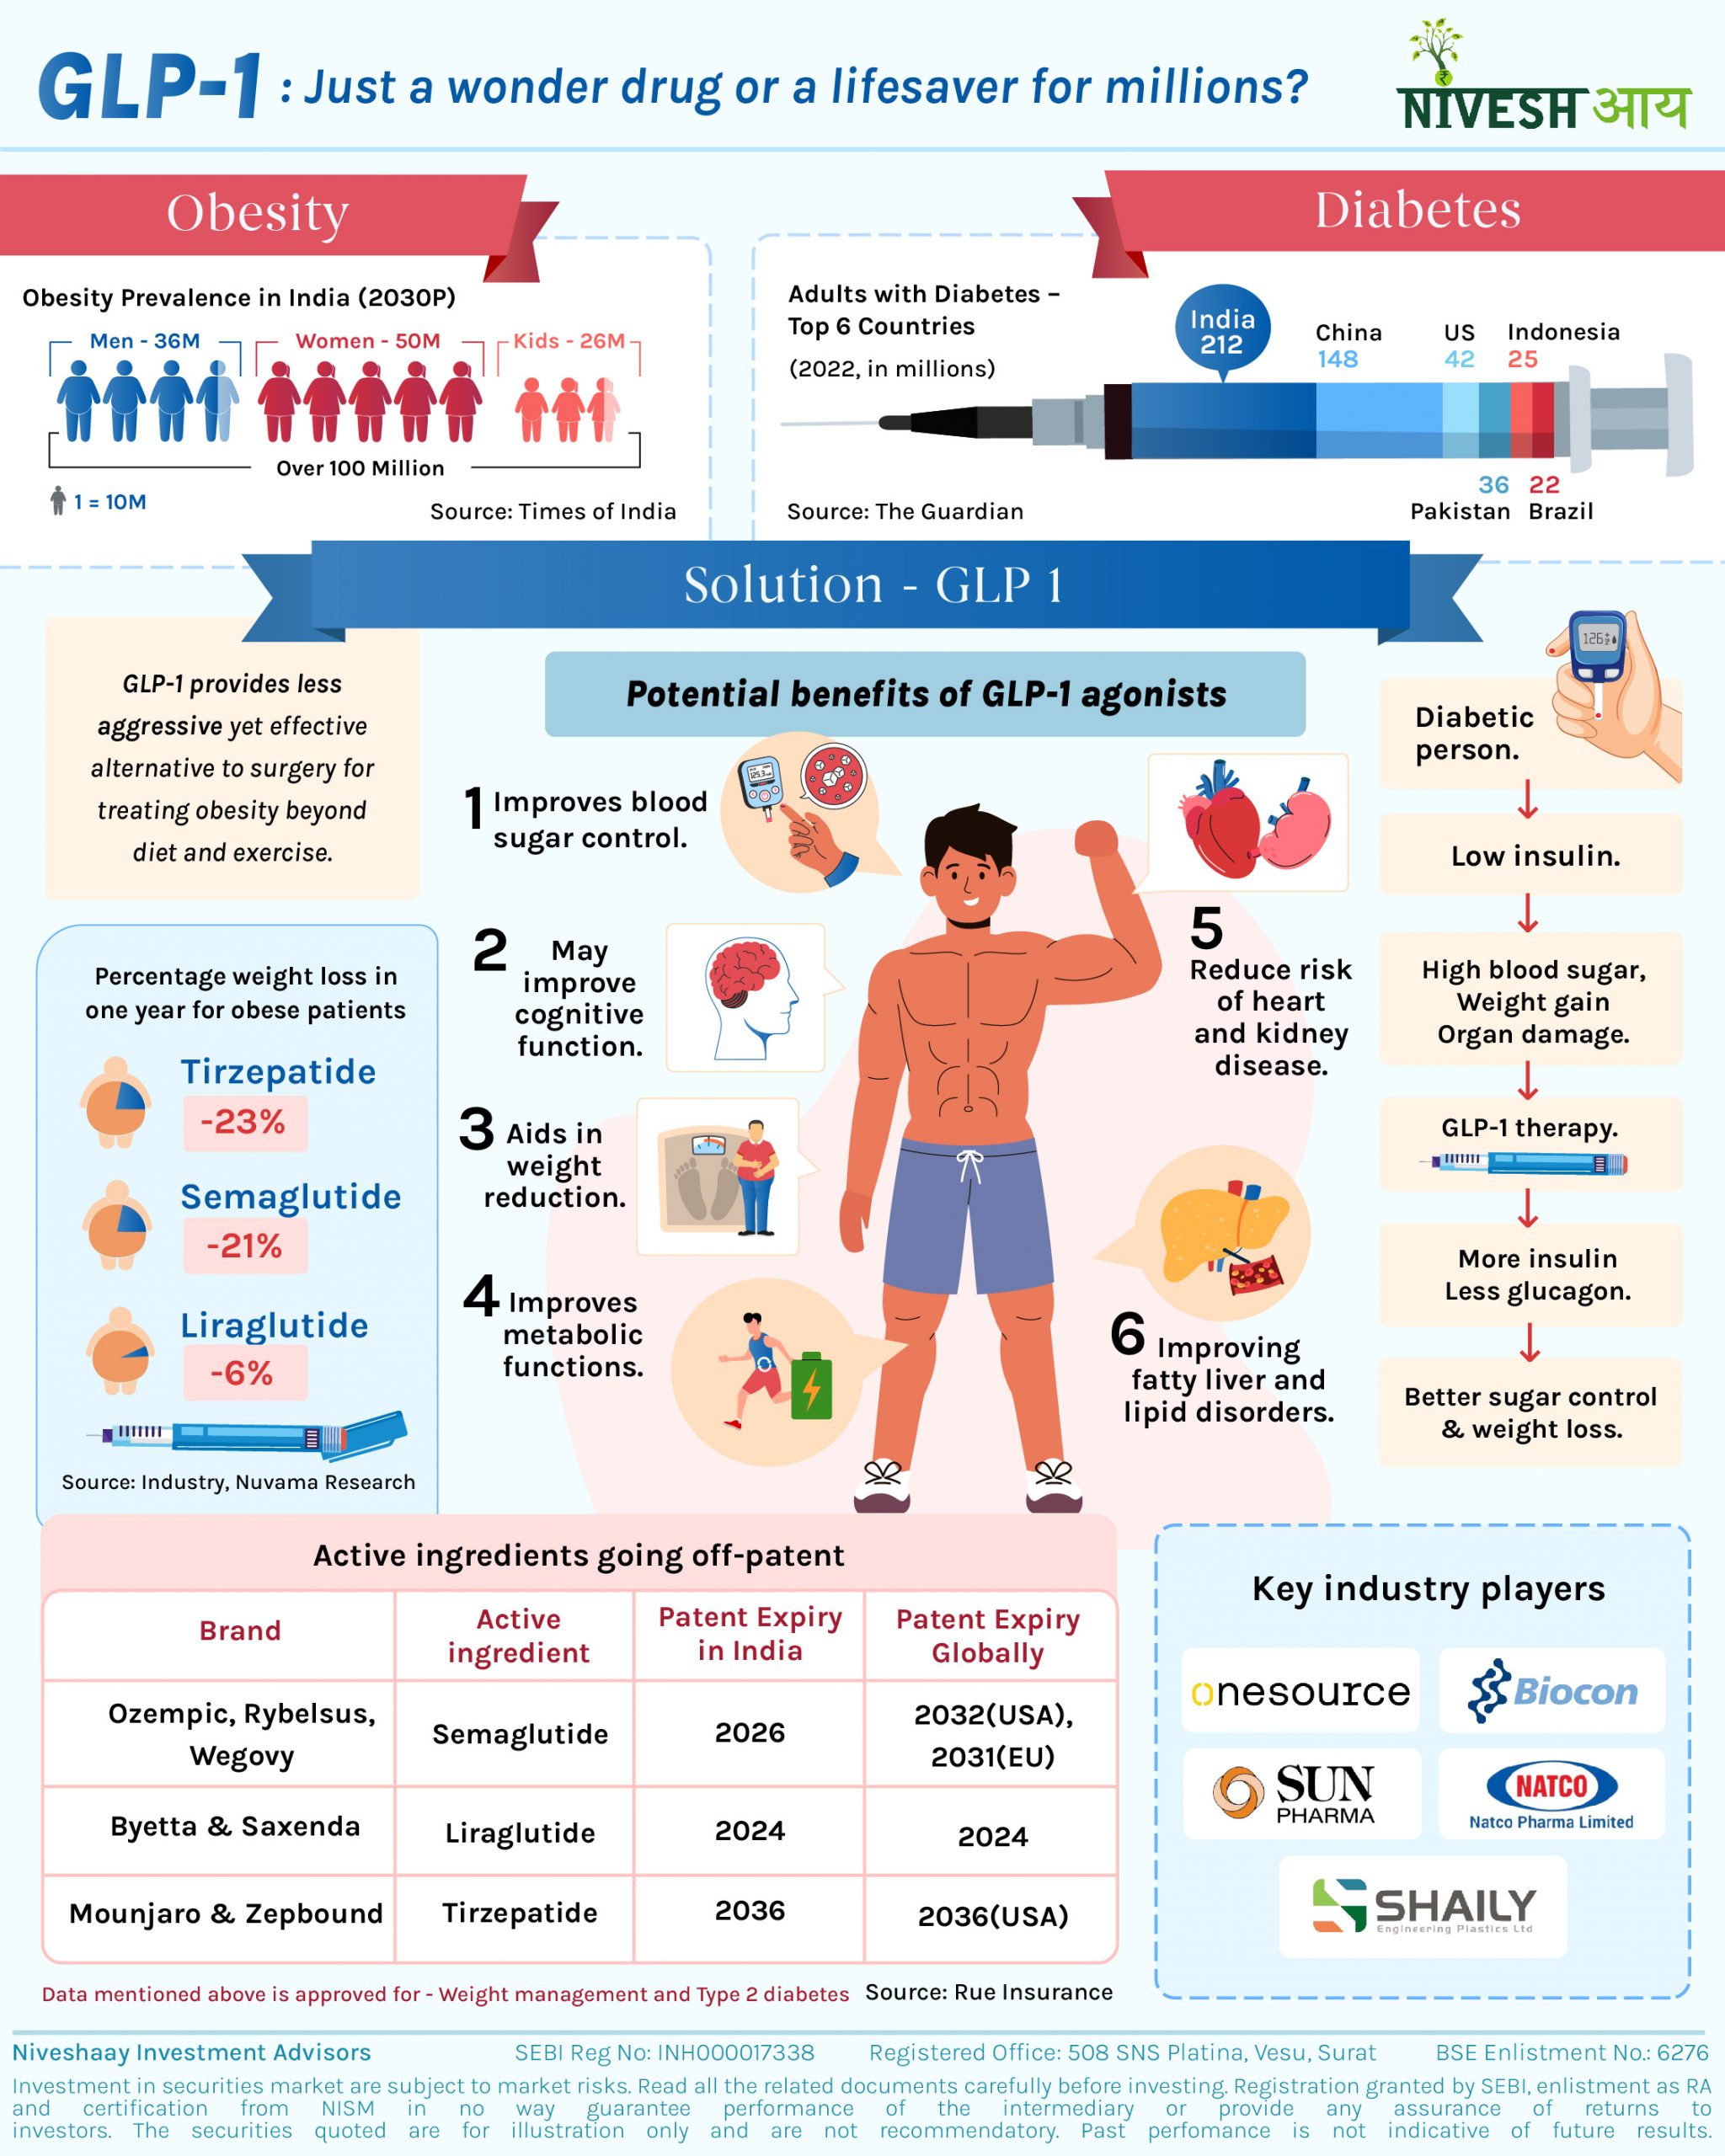
Obesity in India: A Growing Concern From fast food joints to office chairs, have you noticed how obesity is taking over? If you think it's just an occasional observation, think again. India is witnessing a staggering rise in obesity rates, with over 100 million obese individuals today.Some states are more affected than others:Kerala leads with 65.4% of its population
From fast food joints to office chairs, have you noticed how obesity is taking over? If you think it's just an occasional observation, think again. India is witnessing a staggering rise in obesity rates, with over 100 million obese individuals today.
Some states are more affected than others:
Kerala leads with 65.4% of its population categorized as obese, followed by Punjab (62.5%), Delhi (59%), and Tamil Nadu (57.9%). What’s even more alarming? 14.4 million children in India are already battling obesity, it brings a host of challenges, from increased health risks like diabetes and heart disease to social stigma, mobility issues, and rising healthcare costs, making it a complex global concern

This sharp surge in obesity isn’t just a public health concern—it’s reshaping how we approach wellness, nutrition, and chronic disease management. Traditional methods like diet and exercise, while crucial, are often not enough in the face of lifestyle shifts, genetic predispositions, and metabolic challenges. As doctors and patients seek more effective, long-term solutions, science is stepping in with innovative answers. And that’s where the spotlight shifts to a promising new frontier in obesity treatment: Pharmaceutical Intervention.
Enters GLP-1 receptor agonists—the revolutionary class of drugs that are changing the way we tackle diabetes and obesity. Initially developed to help Type 2 diabetes patients manage blood sugar levels, these drugs have demonstrated extraordinary potential in weight loss, cardiovascular health, and other emerging therapeutic areas. With obesity and diabetes cases soaring worldwide, demand for GLP-1 drugs has skyrocketed. Let’s break down why these drugs are making waves.
Our bodies naturally produce Glucagon-Like Peptide-1 (GLP-1), a hormone that regulates blood sugar levels and controls appetite. GLP-1 receptor agonists mimic this hormone, triggering several beneficial effects:
With such powerful benefits, it’s no surprise that GLP-1 drugs are gaining traction not just among diabetics but also among individuals looking for weight loss solutions.

Globally, the GLP-1 receptor agonist market is experiencing robust growth, with a valuation of USD53.46 billion in 2024. Forecasts predict a CAGR of 17.46% from 2025 to 2030, with an expected market value of USD120.91 billion by 2030.
Industry developments include AbbVie’s USD2.23 billion deal with Gubra A/S to develop an amylin-targeting obesity drug, and Eli Lilly’s strategic price reduction for its weight-loss drug Zepbound to maintain market share.
India's GLP-1 receptor agonist market is expanding rapidly, driven by the rising incidence of obesity and diabetes. In 2023, the Indian GLP-1 market was valued at USD 105.7 million and is projected to grow at a CAGR of 27.5%, reaching approximately USD 578.9 million by 2030.
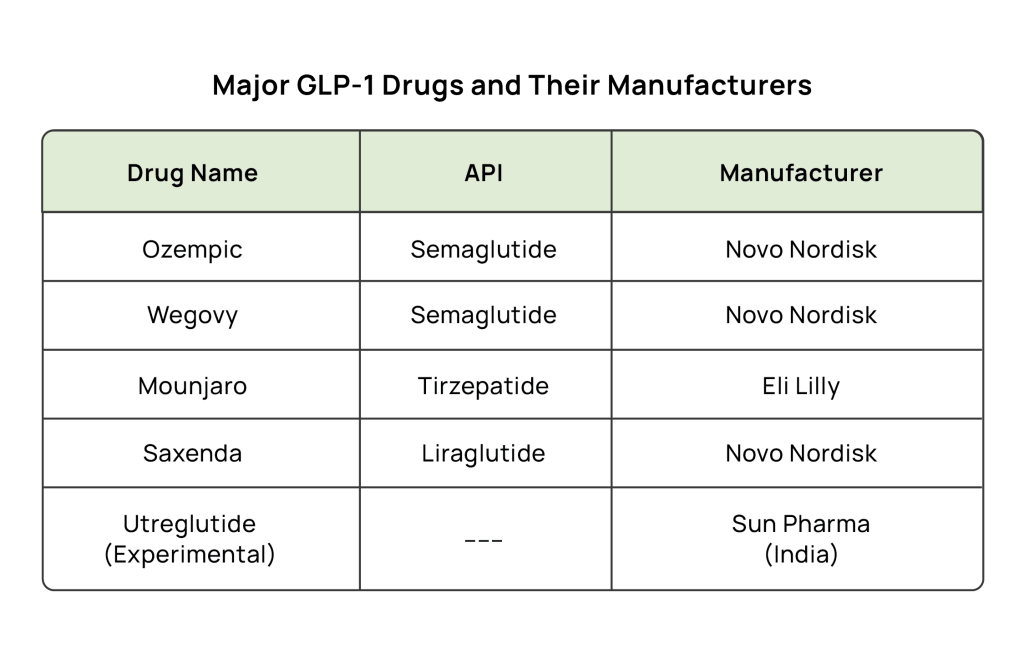
Several GLP-1 drugs are leading the market due to their proven effectiveness:
If you’ve noticed more people discussing weight-loss injections, you’re not alone. The demand for GLP-1 drugs is surging, particularly among non-diabetic individuals looking for effective weight-loss solutions. In the U.S., prescriptions for these drugs among obese patients jumped from 21,000 in 2019 to 174,000 in 2023! Even more fascinating, young adults are embracing these medications at an astonishing 600% higher rate than in 2020.
Surprising fact: A study of 2 million Type 2 diabetes patients found that GLP-1 drug users had a lower risk of developing 42 different health conditions, including Alzheimer’s disease! Additionally, people using these drugs cut their grocery spending by 6% within six months, as they consume fewer ultra-processed foods.
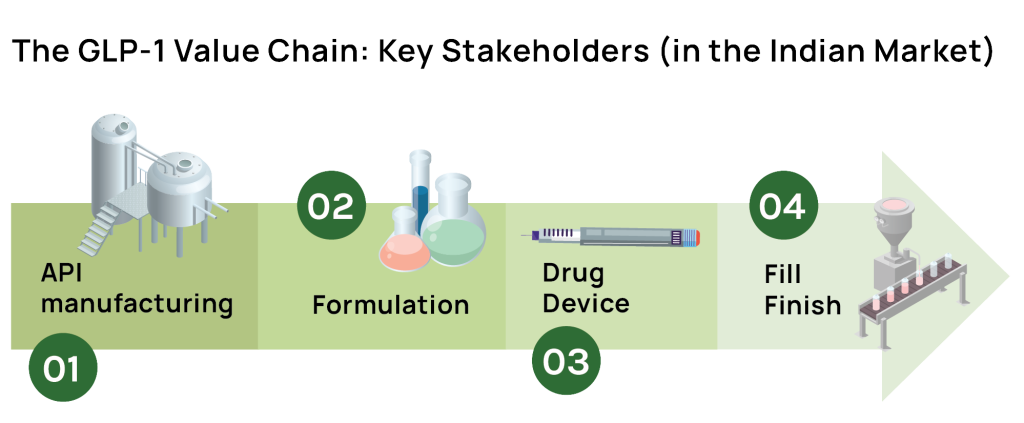
API and Formulations
Drug device
Shaily Engineering Plastics Ltd. has developed several drug delivery devices tailored for GLP-1 therapies, including Neo, Maxim and Axiom

Fill finish and distribution
OneSource has expanded its capacity to produce GLP-1 drug-device combinations. Their services encompass cartridge filling, assembly, and fill-finish processes.
Several pharmaceutical companies are well-positioned to benefit from the GLP-1 market expansion. Sun Pharma is investing in both branded and generic GLP-1 drugs, while Dr. Reddy’s (DRRD) has built a strong pipeline of GLP-1 generics, including Ozempic and Rybelsus. Natco Pharma is expected to be one of the first entrants into the semaglutide generics market by March 2026, while Cipla is working on innovative oral GLP-1 formulations that could revolutionize the market. Shaily Engineering is scaling up injector pen production to meet the rising demand for GLP-1 drug delivery devices.
Despite their efficacy, GLP-1 receptor agonists pose potential challenges and side effects that may impact adoption. Gastrointestinal issues such as nausea, vomiting, diarrhoea, and constipation is common among users. Some individuals have experienced gallbladder problems, including an increased risk of gallstones. Although rare, cases of pancreatitis (inflammation of the pancreas) have been reported. Additionally, some patients undergoing rapid weight loss with GLP-1 drugs have shown signs of muscle and bone loss, necessitating further research into long-term effects. Long term effects are not known as it is only being used since past 5-6 years.
The future of the GLP-1 drug market is driven by key trends, including patent expirations, manufacturing challenges, and advancements in drug delivery.Patent expires in India, Canada, and Brazil by 2026, followed by U.S. market entry in 2031-32, will open opportunities for generics, increasing competition and affordability. The introduction of oral GLP-1 formulations is expected to further drive market expansion by offering a more convenient alternative to injectables. Additionally, the growing demand for GLP-1 drug delivery devices, such as injectors and pens, is prompting companies like Shaily Engineering to scale up production of GLP-1 pen, with a roadmap to enhance capacity from 35 million to 100 million over 3-5 years.
As India strides forward in healthcare innovation, the rise of GLP-1 drugs marks more than just a medical breakthrough—it signifies a societal shift in how we tackle chronic diseases. With an increasing burden of diabetes and obesity, these drugs have the potential to reshape public health policies, redefine preventive care, and alter the economic landscape of the pharmaceutical industry. From boardroom discussions in pharma companies to kitchen-table conversations in Indian households, GLP-1 drugs are not just changing prescriptions—they are changing perspectives. As we navigate this transformation, one thing is clear: the future of metabolic health is being rewritten, and India has a front-row seat in shaping its destiny.
Disclaimers and Disclosures
SEBI Registration No. :INH000017338, IN/AIF3/24-25/1571, IN/AIF2/24-25/1607 | BASL Membership ID: 6276
Investment in Securities Market are subject to market risks. Read all related documents carefully before investing. The securities quoted are for illustration only and are not recommendatory. Registration granted by SEBI, membership of a SEBI recognized supervisory body (if any) and certification from NISM in no way guarantee performance of the intermediary or provide any assurance of returns to investors.
Pharmaceuticals
GLP 1: Just a wonder drug or a lifesaver for millions?
India stands tall as the world’s pharmacy — now poised to lead the GLP-1 revolution. 💉 GLP-1 receptor agonists, which mimic the hormone Glucagon-Like Peptide-1, are transforming treatment for diabetes and obesity. 🩸🧍♂️ With patents set to expire soon, India could unlock access to affordable generics, driving a healthcare breakthrough. The GLP-1 market is projected
India stands tall as the world’s pharmacy — now poised to lead the GLP-1 revolution. 💉 GLP-1 receptor agonists, which mimic the hormone Glucagon-Like Peptide-1, are transforming treatment for diabetes and obesity. 🩸🧍♂️ With patents set to expire soon, India could unlock access to affordable generics, driving a healthcare breakthrough. The GLP-1 market is projected to reach $578.9M by 2030, growing at a 27.5% CAGR — a massive opportunity for India’s health and pharma sectors. 📈🚀
Recycling & Refurbishment
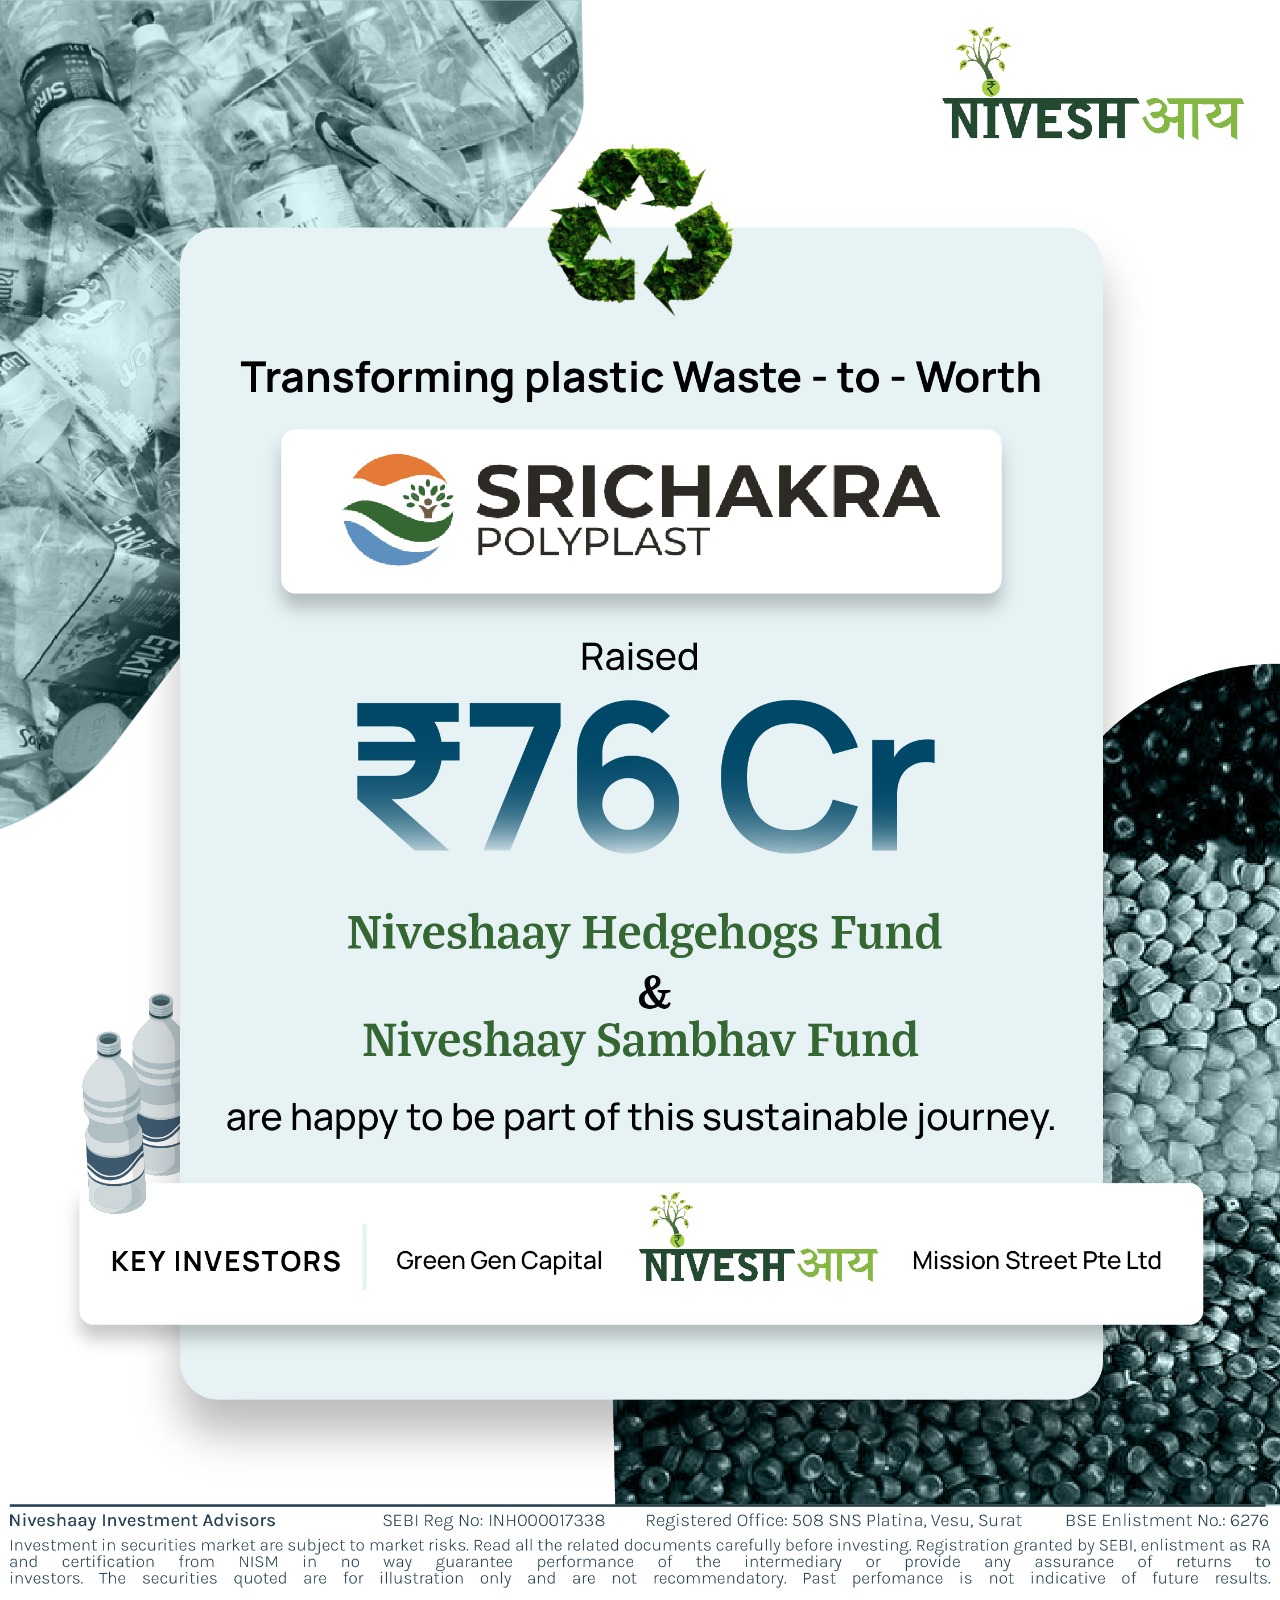
Transforming Plastic Waste-to-Worth
Srichakra Polyplast, being pioneers in revolutionizing plastic recycling turning used bottles into food-grade plastic.
Srichakra Polyplast, being pioneers in revolutionizing plastic recycling turning used bottles into food-grade plastic. Certified by EFSA and FSSAI, their cutting-edge technology transforms waste into valuable materials like PET and polyolefins. ✅♻
By replacing virgin plastic with high-quality recycled alternatives, company is helping close the loop and power the circular economy. 🔁🌱
We’re happy to back Srichakra Polyplast (India) Pvt Ltd, a leader in India’s plastic recycling ecosystem, driving the shift toward food-grade rPET and sustainable packaging.
Here’s why they stood out:
✅ Trusted by leaders — Supplying rPET to Coca-Cola, Pepsi, Kinley and polyolefin chips to L’Oréal, Colgate, Harpic
✅ Massive market tailwinds — PET demand to hit 1.8M MT by 2030; recycled PET share set to double
✅ Scaling fast — Expanding from 42,000 MTPA to 130,000 MTPA by FY2027
✅ Tech advantage — First in India with Starlinger machines
✅ Led by experts — Deep industry & regulatory experience across plastics, finance & manufacturing
✅ Strong supply network — 150+ sourcing partners with distribution edge in South India.
Sri Chakra is building the future of sustainable packaging in India — and we’re excited to be part of their journey.
Space Ecosystem
Geospatial: Mapping India’s Progress with Smarter Insights
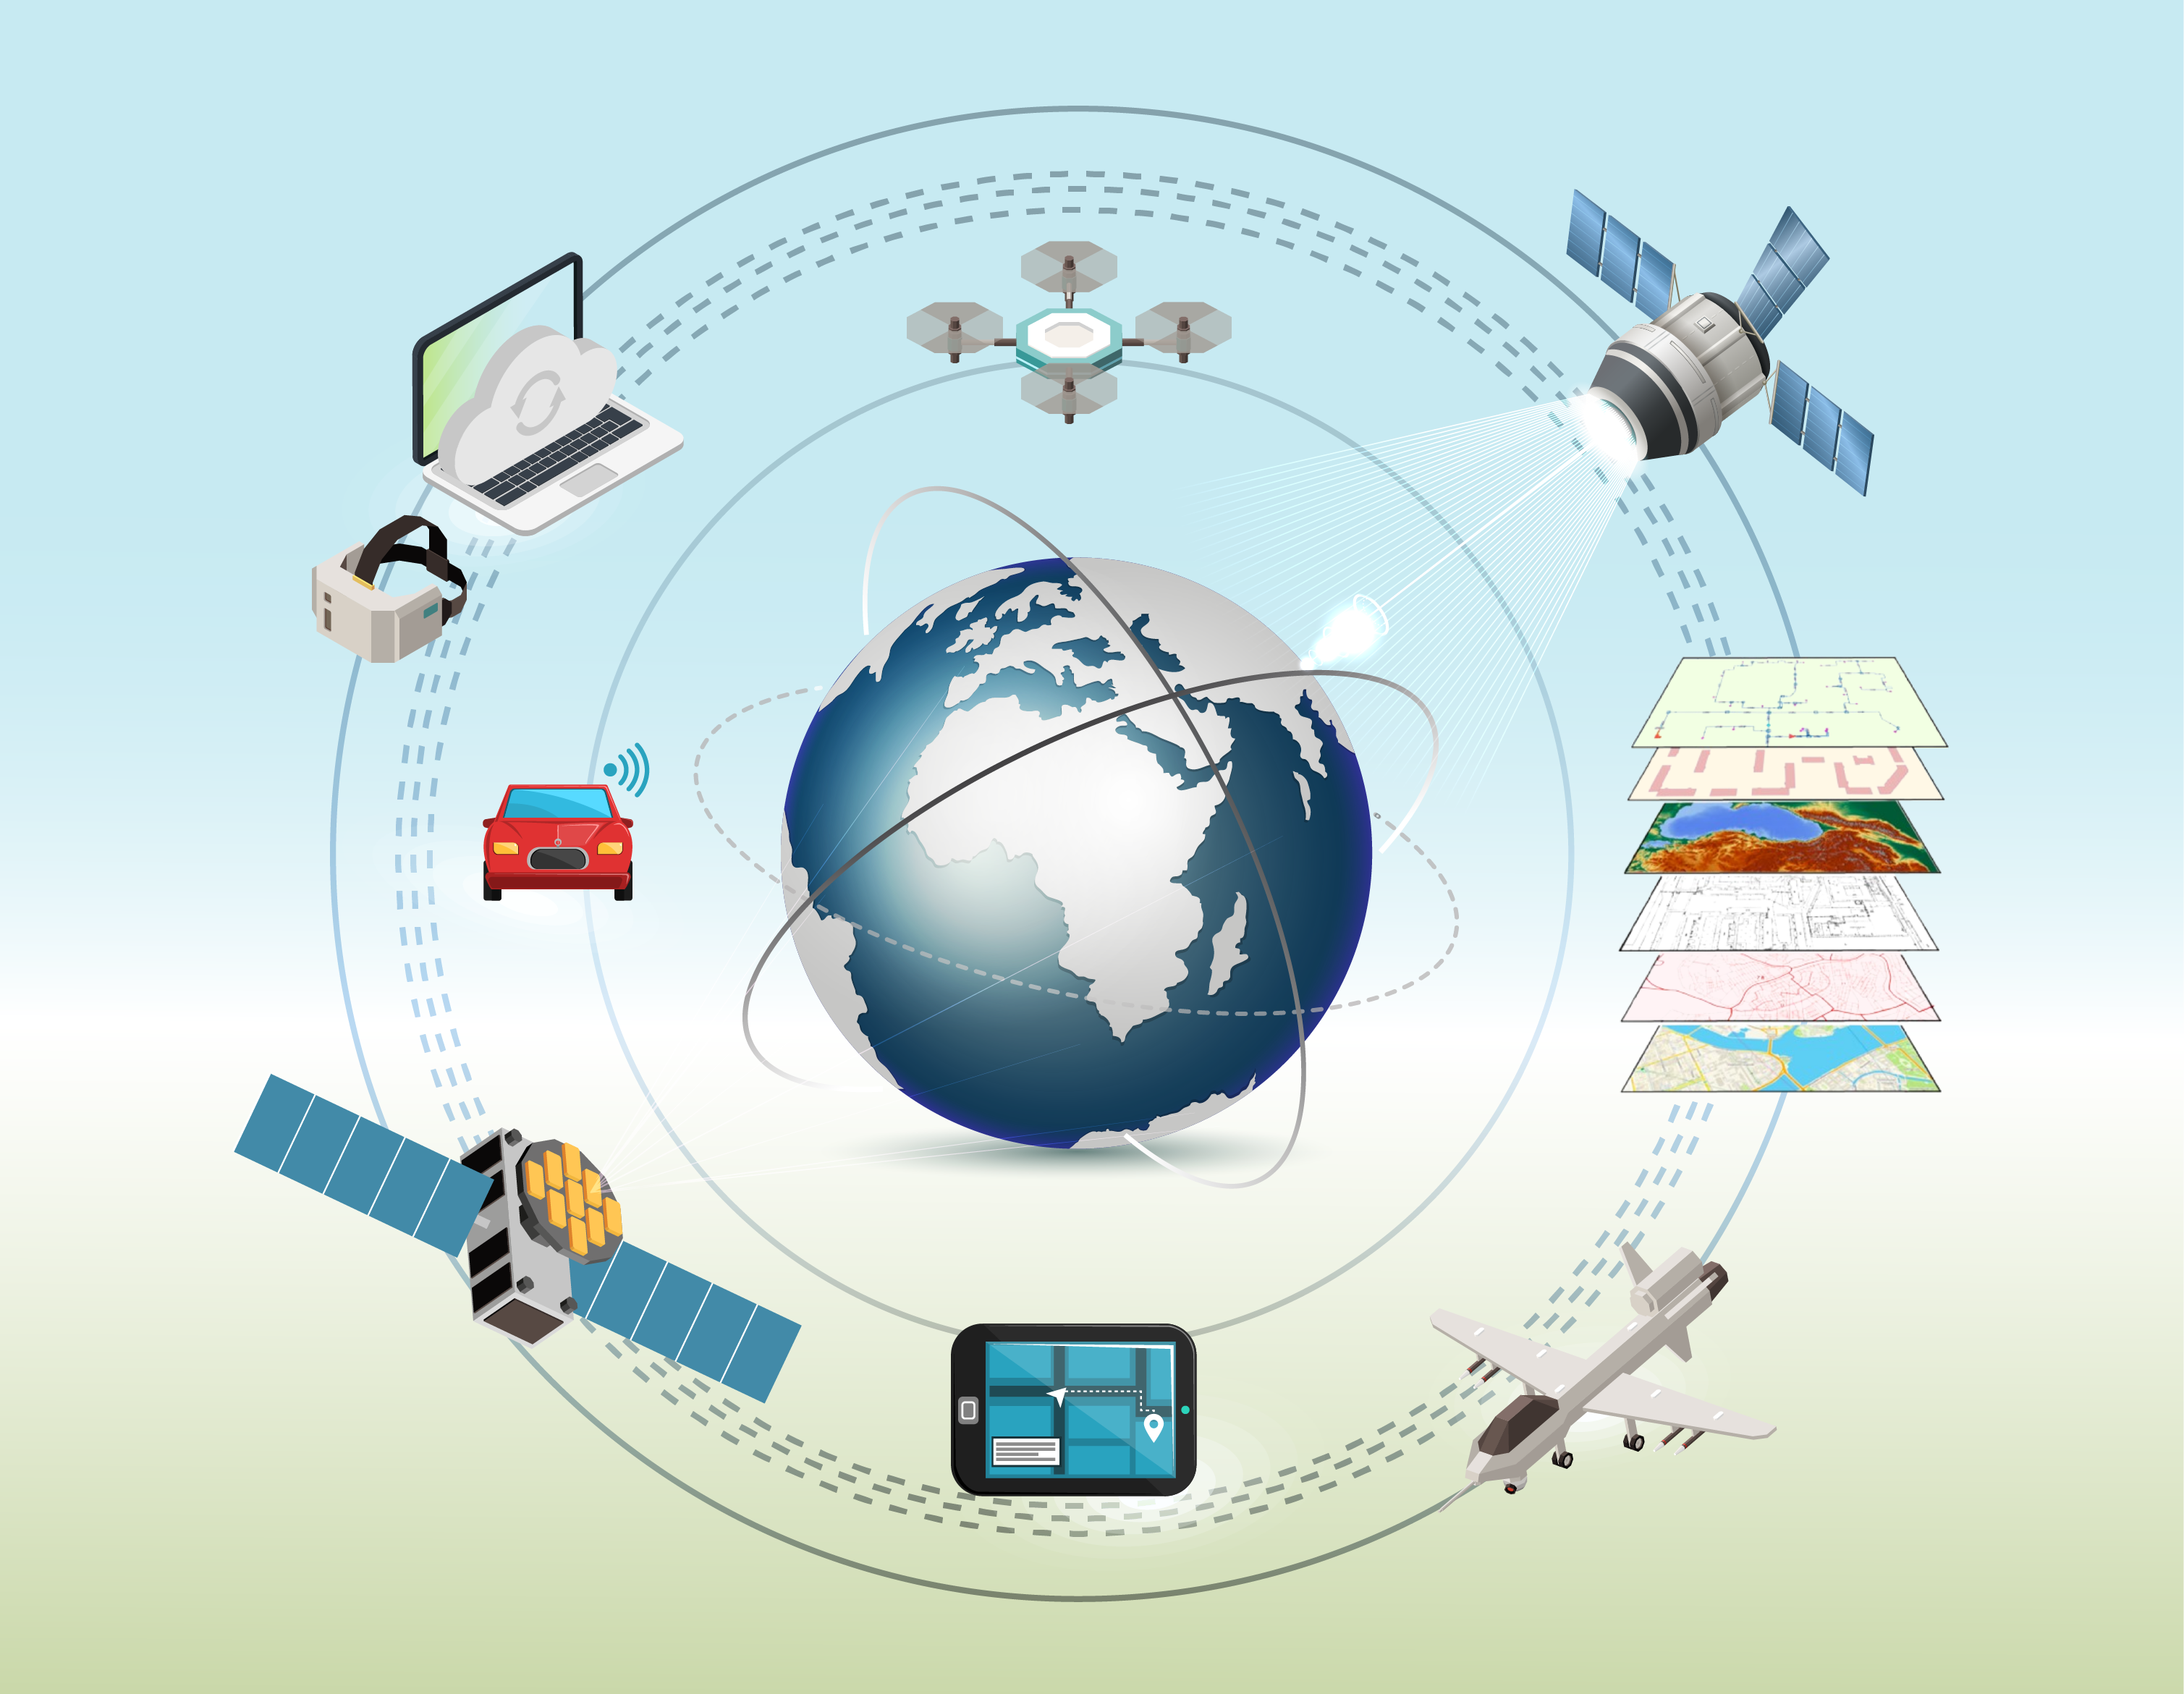
Geospatial computing is transforming how we analyze and interact with spatial data, driving innovations across industries through advanced technologies like AI, IoT, and cloud services. What is Geospatial Computing? Geospatial computing is the science and technology of acquiring, analyzing, visualizing, and managing geographic information. It's about understanding the "where" and using that knowledge to solve
Geospatial computing is transforming how we analyze and interact with spatial data, driving innovations across industries through advanced technologies like AI, IoT, and cloud services.
Geospatial computing is the science and technology of acquiring, analyzing, visualizing, and managing geographic information. It's about understanding the "where" and using that knowledge to solve complex problems. This involves a synergy of technologies:
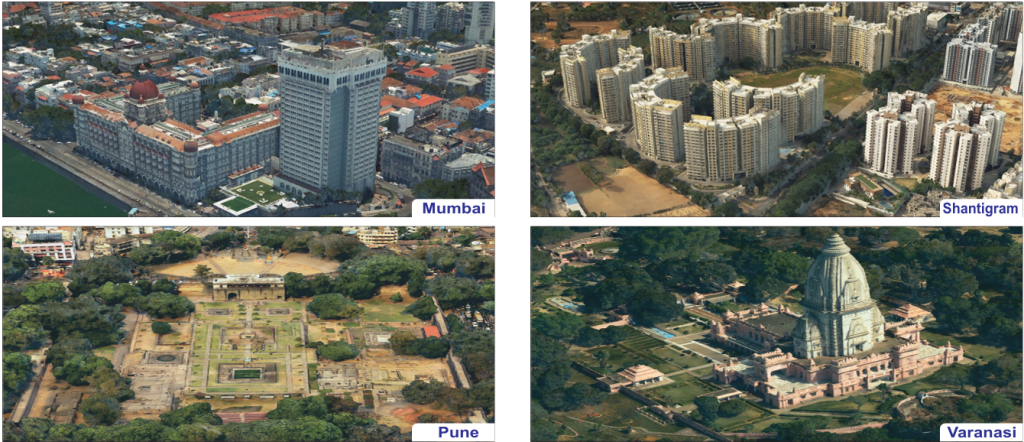
These components integrate to create detailed digital representations of physical spaces, from sprawling urban centers to remote natural landscapes. Geospatial computing is not just about maps; it's about unlocking insights hidden within location data.
The field of spatial computing, a subset of geospatial computing, is gaining prominence. Technologies like Apple's Vision Pro and Meta Quest are bringing spatial computing to the forefront, demonstrating a significant shift in how we interact with digital information and the physical world. This surge in spatial computing is creating new avenues for partnerships and growth for companies specializing in geospatial solutions.
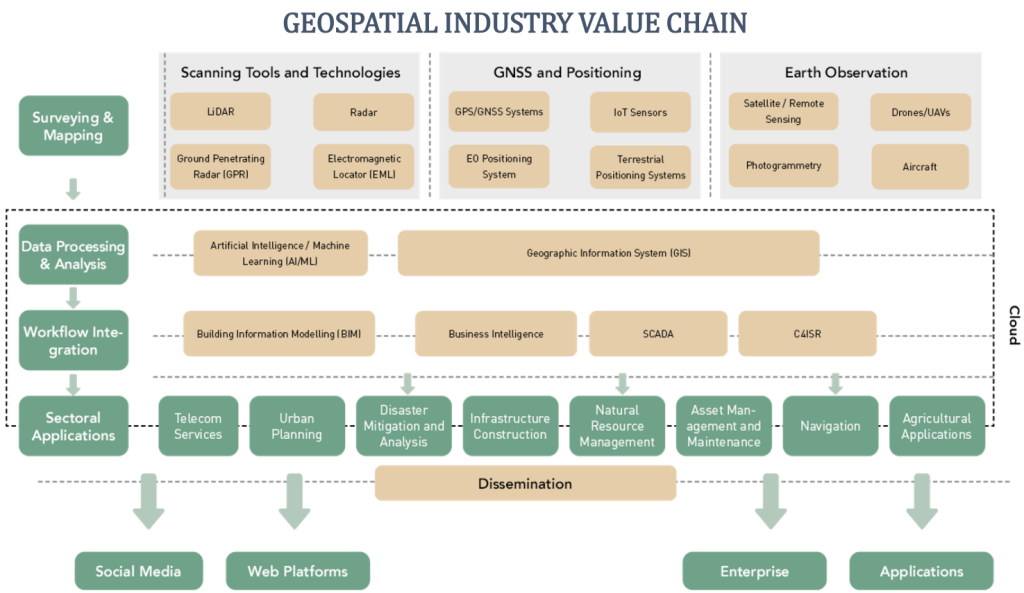
(Source- GW CONSULTING REPORT)
The Geospatial Industry Value Chain represents the various processes and technologies involved in capturing, processing, analyzing, and disseminating geospatial data.
Key Components of the Value Chain:
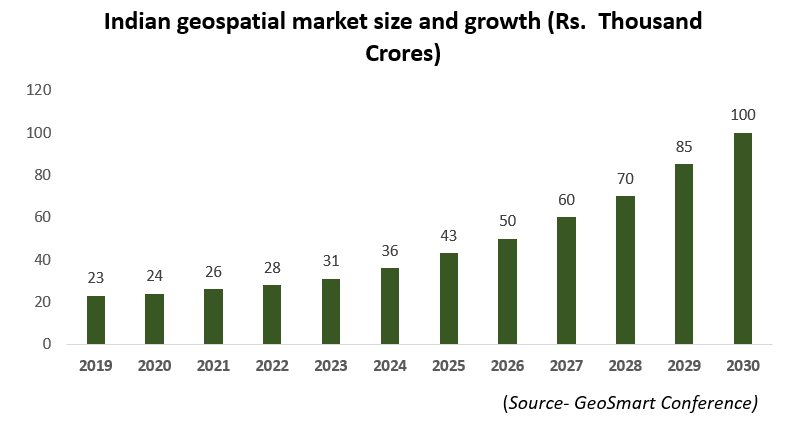
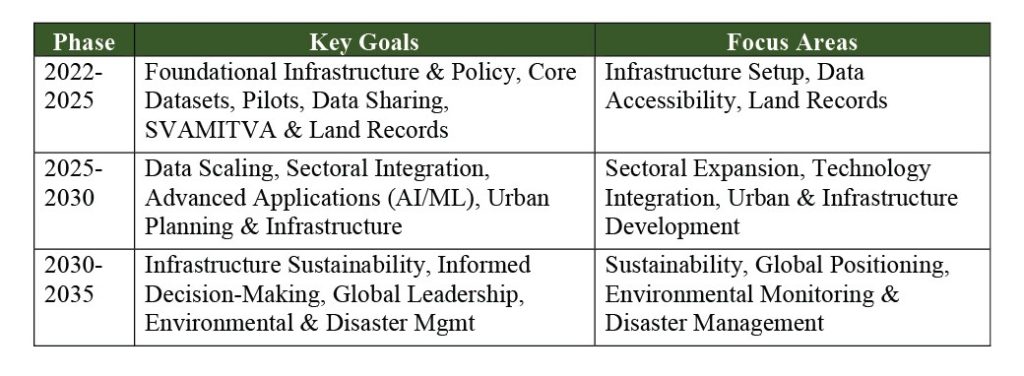
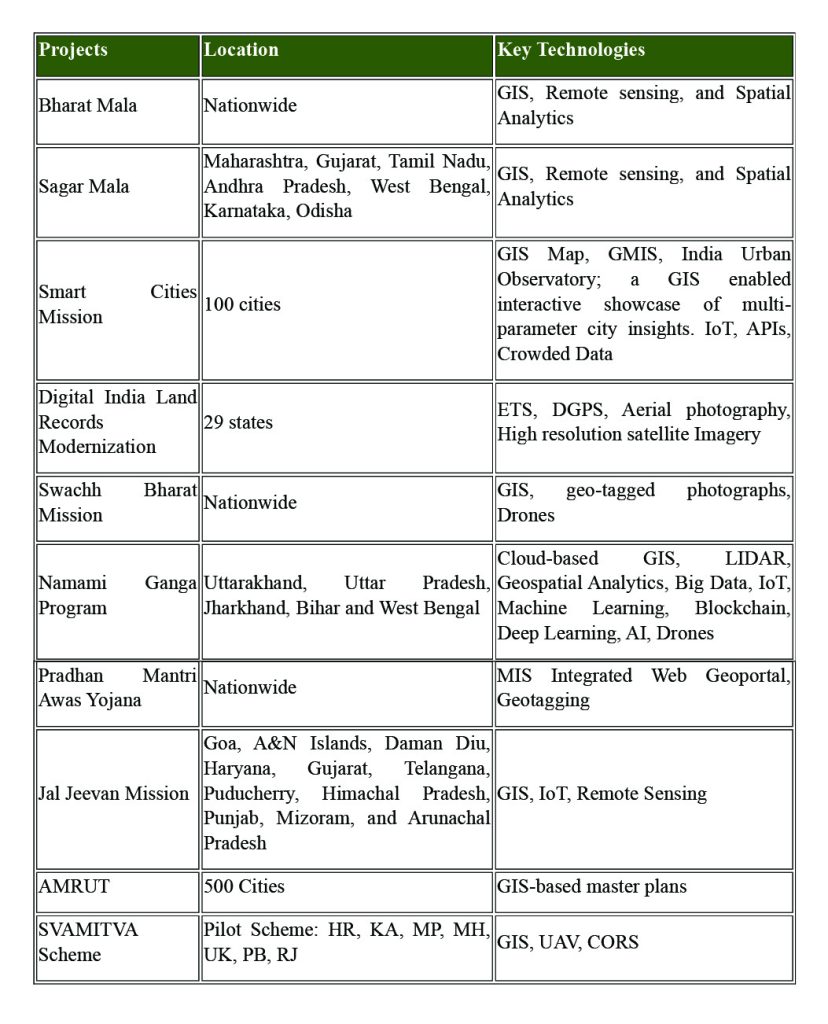
India is leveraging geospatial technology to address a variety of challenges and drive development:
4.1 Agriculture
4.2 Governance
4.3 Healthcare
4.4 Environment
Let's break down the key differences between Genesys, Ceinsys, and MapmyIndia. This comparison will give you a clear understanding of their business models, focus areas, and how they operate within the geospatial industry. By analyzing these distinctions, you’ll gain valuable insights into the sector and the role each company plays in shaping its future.
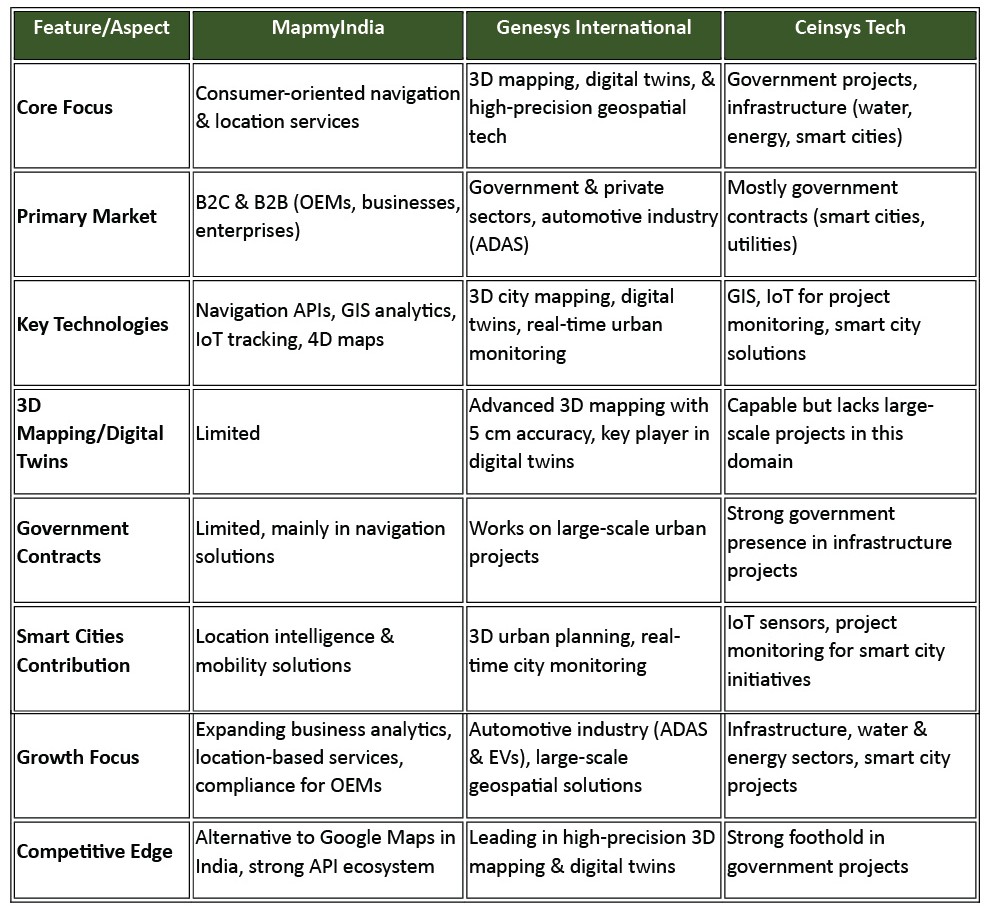
The future of geospatial computing is dynamic, with several key trends shaping its trajectory:
Consumer Technology Integration
Private Sector Expansion
India as a Geospatial Talent Hub
Conclusion
Geospatial computing is a transformative force, reshaping how we understand and interact with the world. From preventing infrastructure failures to improving access to healthcare and enabling sustainable environmental management, its applications are vast and impactful. As technologies continue to advance and the private sector plays a greater role, geospatial computing is poised for continued growth and innovation, promising a future where location intelligence drives smarter decisions and a better world.
Disclaimers and Disclosures
SEBI Registration No. :INH000017338, IN/AIF3/24-25/1571, IN/AIF2/24-25/1607 | BASL Membership ID: 6276
Investment in Securities Market are subject to market risks. Read all related documents carefully before investing. The securities quoted are for illustration only and are not recommendatory. Registration granted by SEBI, membership of a SEBI recognized supervisory body (if any) and certification from NISM in no way guarantee performance of the intermediary or provide any assurance of returns to investors.
Space Ecosystem
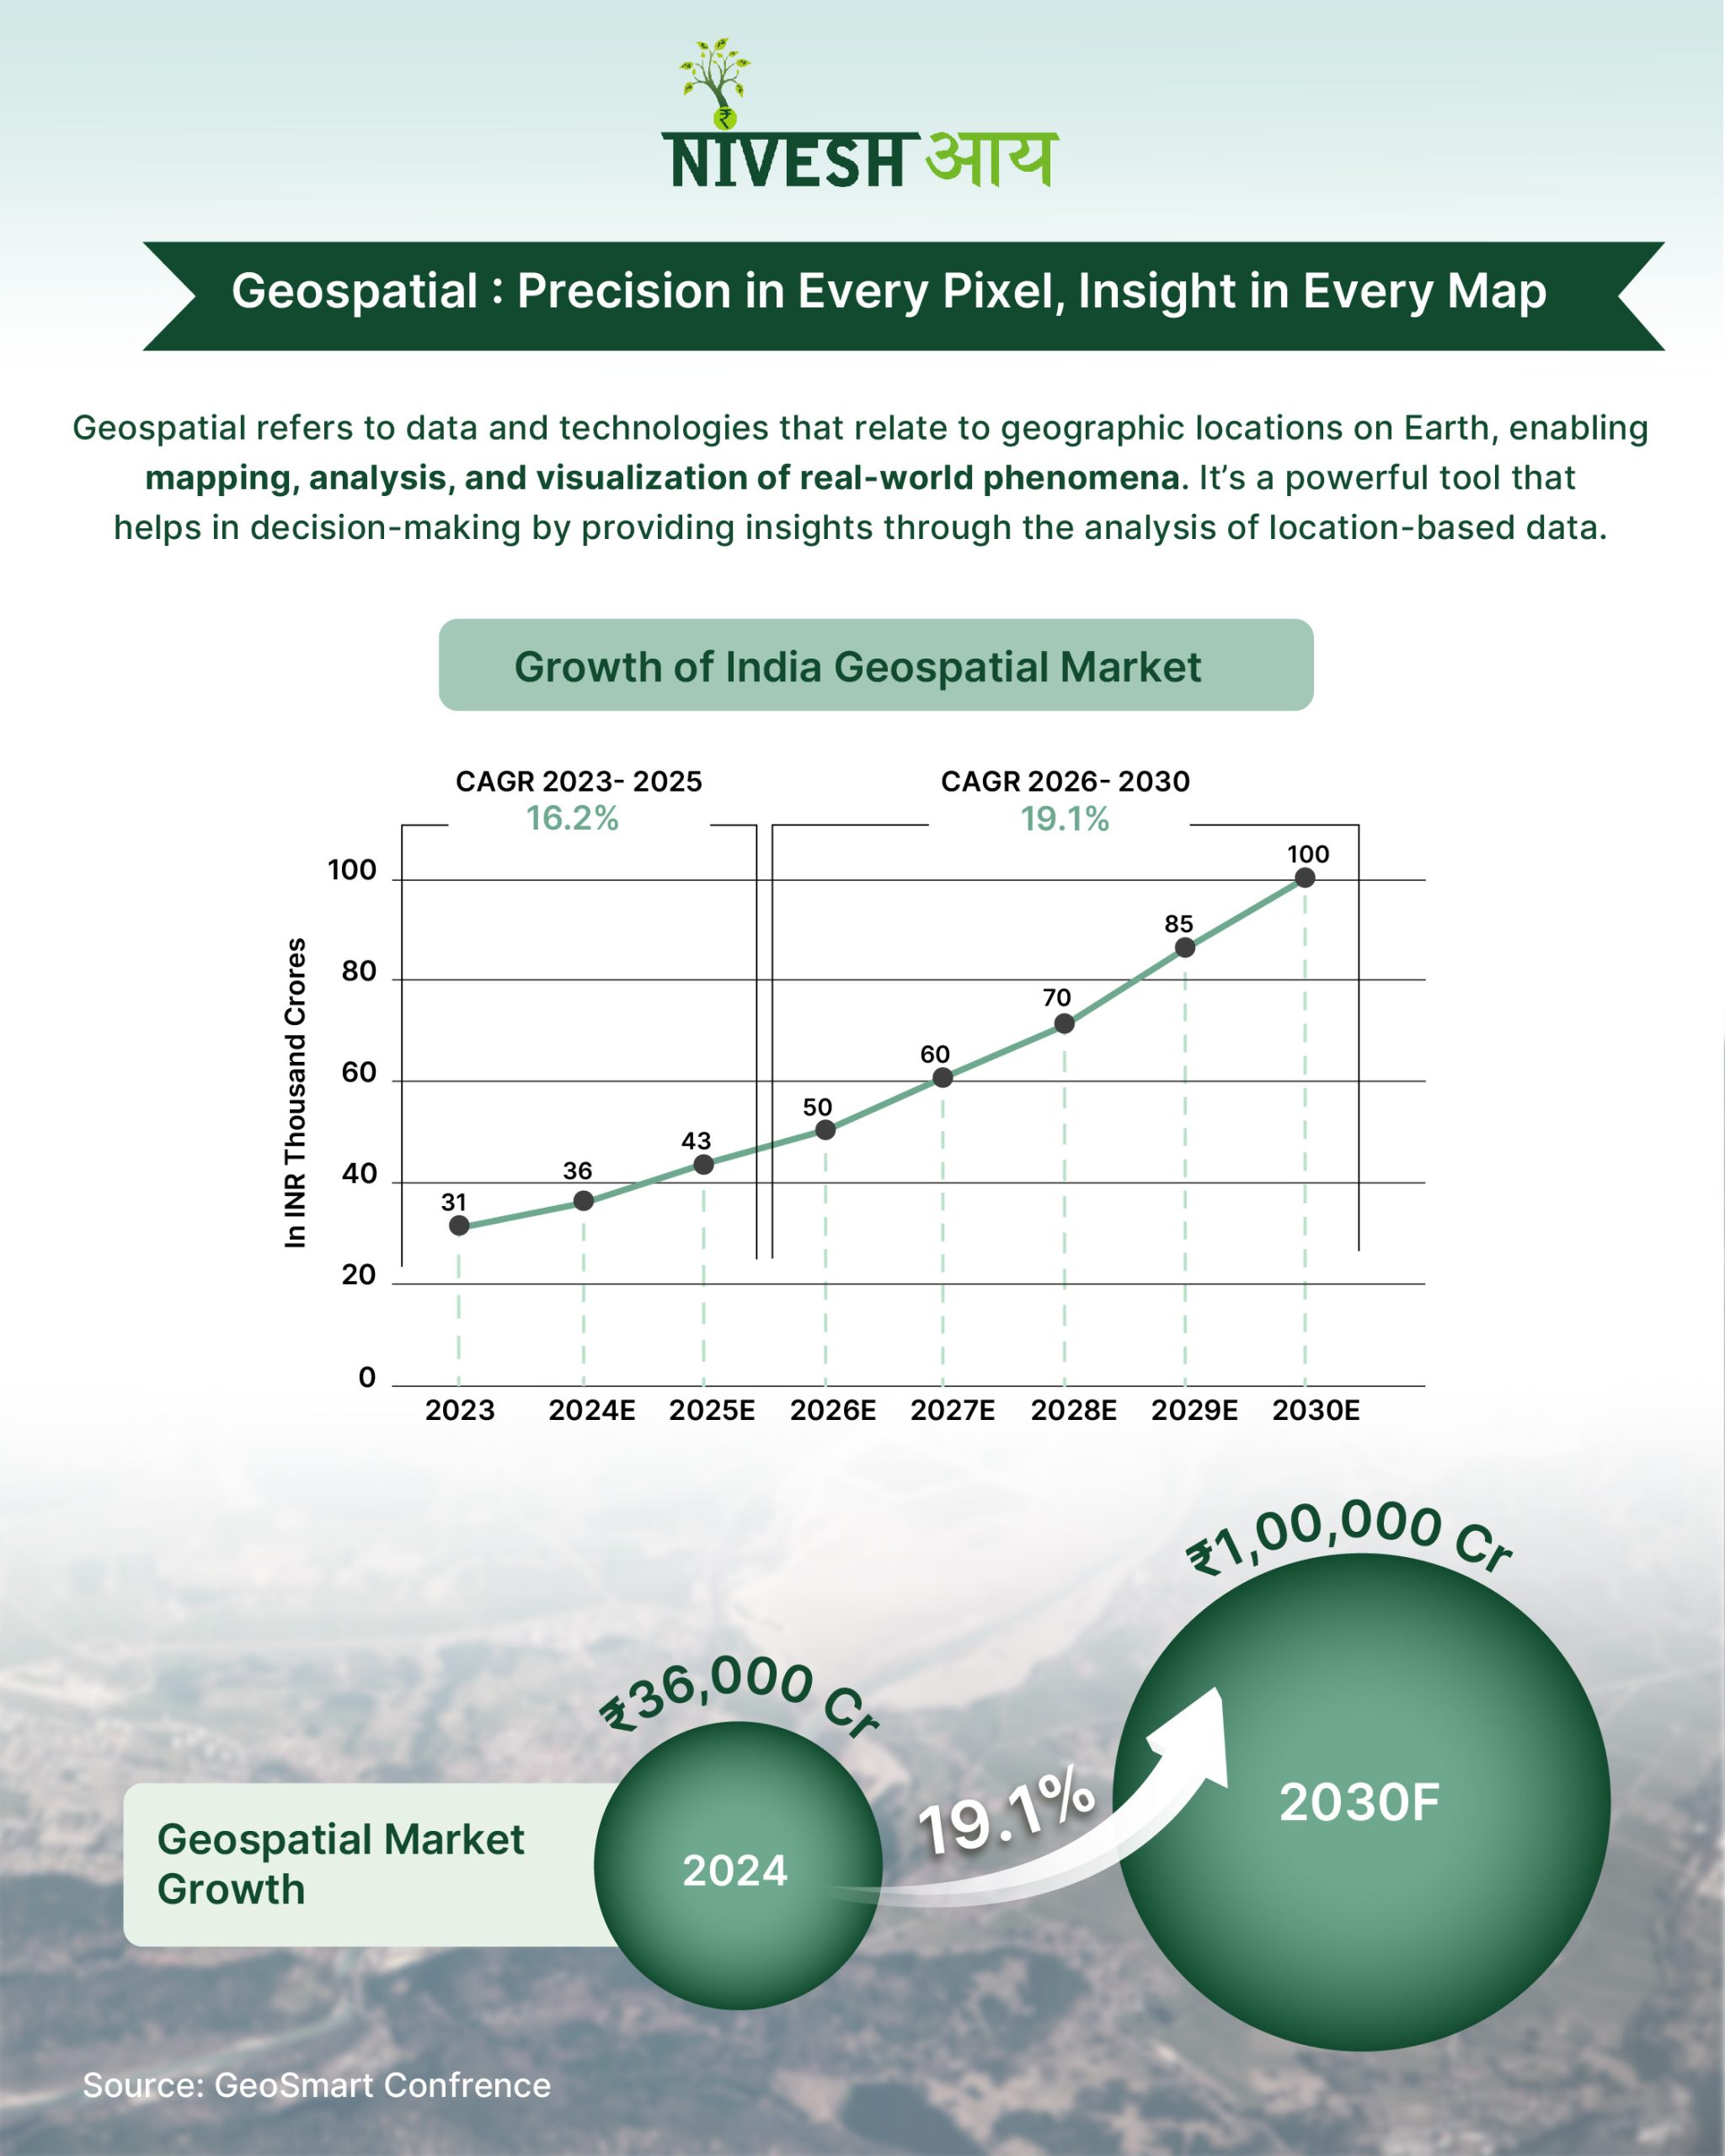
Geospatial : Precision in Every Pixel, Insight in Every Map
India’s geospatial sector is charting new frontiers! 🌍🛰The race isn’t just about data—it’s about who deciphers it best!🧩 🔍Key players are reshaping industries, impact is undeniable, and the future? A thrilling mix of challenges and opportunities.🏭🤝Swipe through our latest infographic 📖 for key insights.!💫
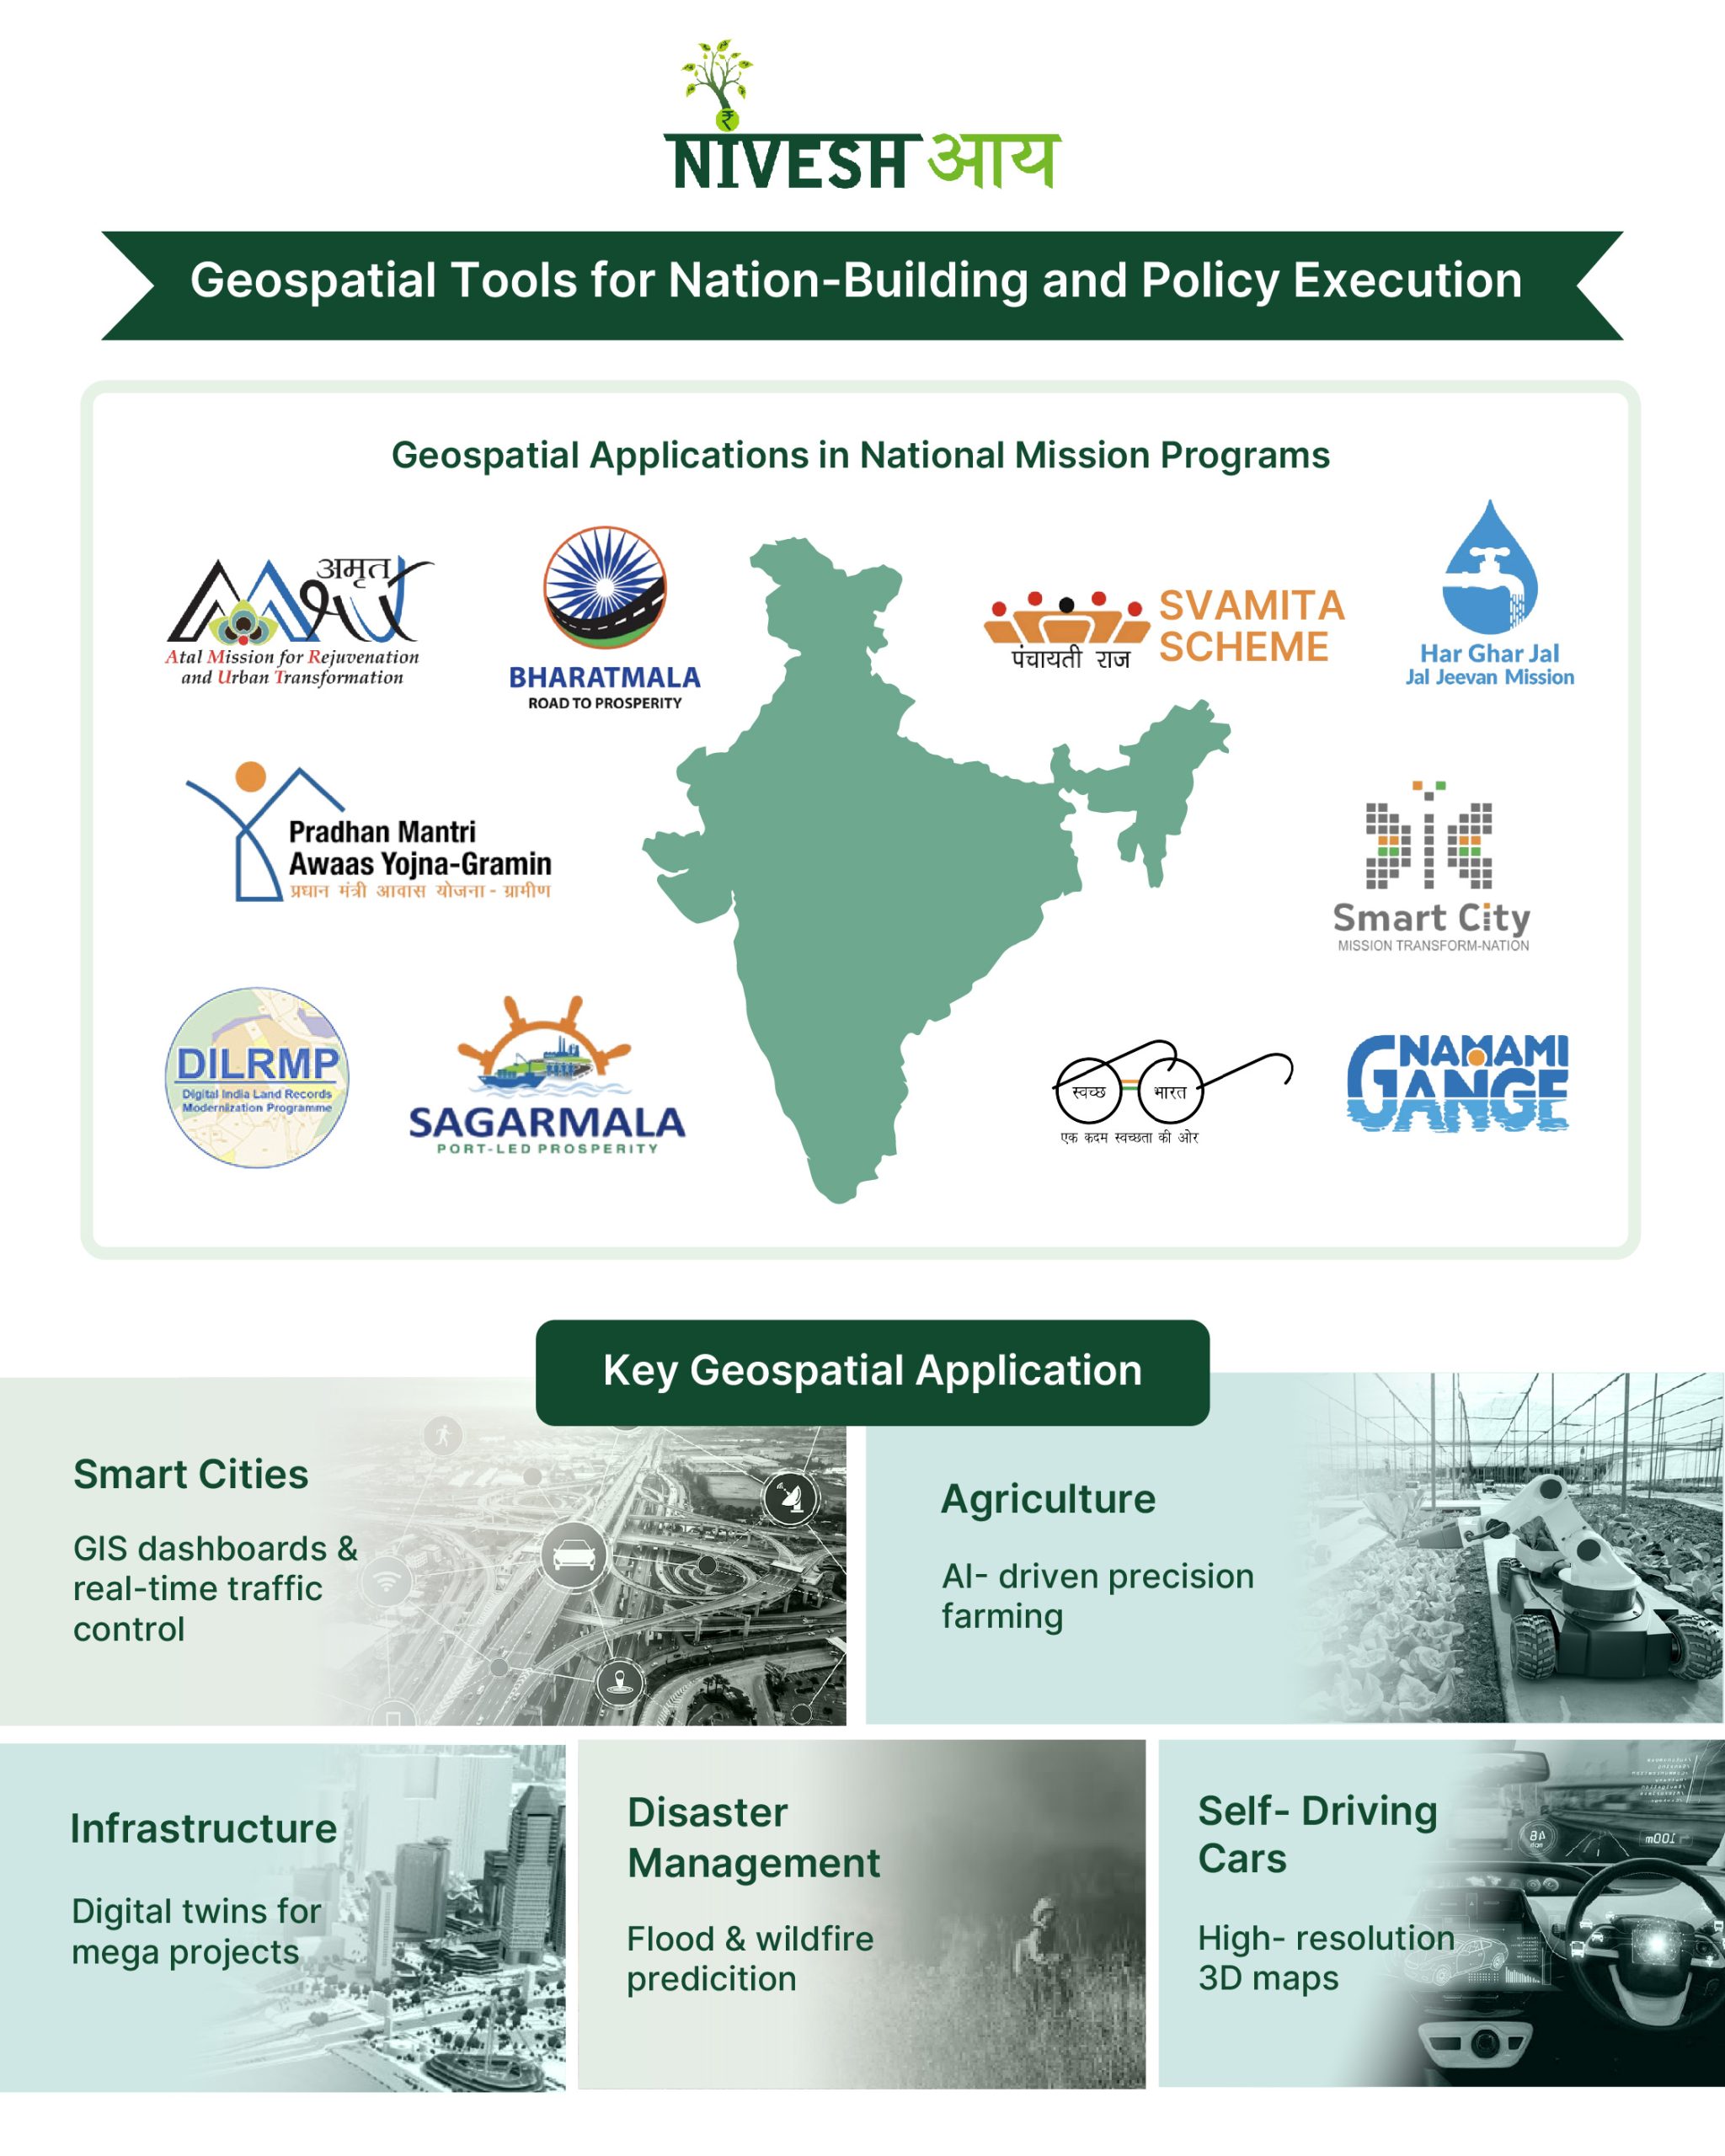
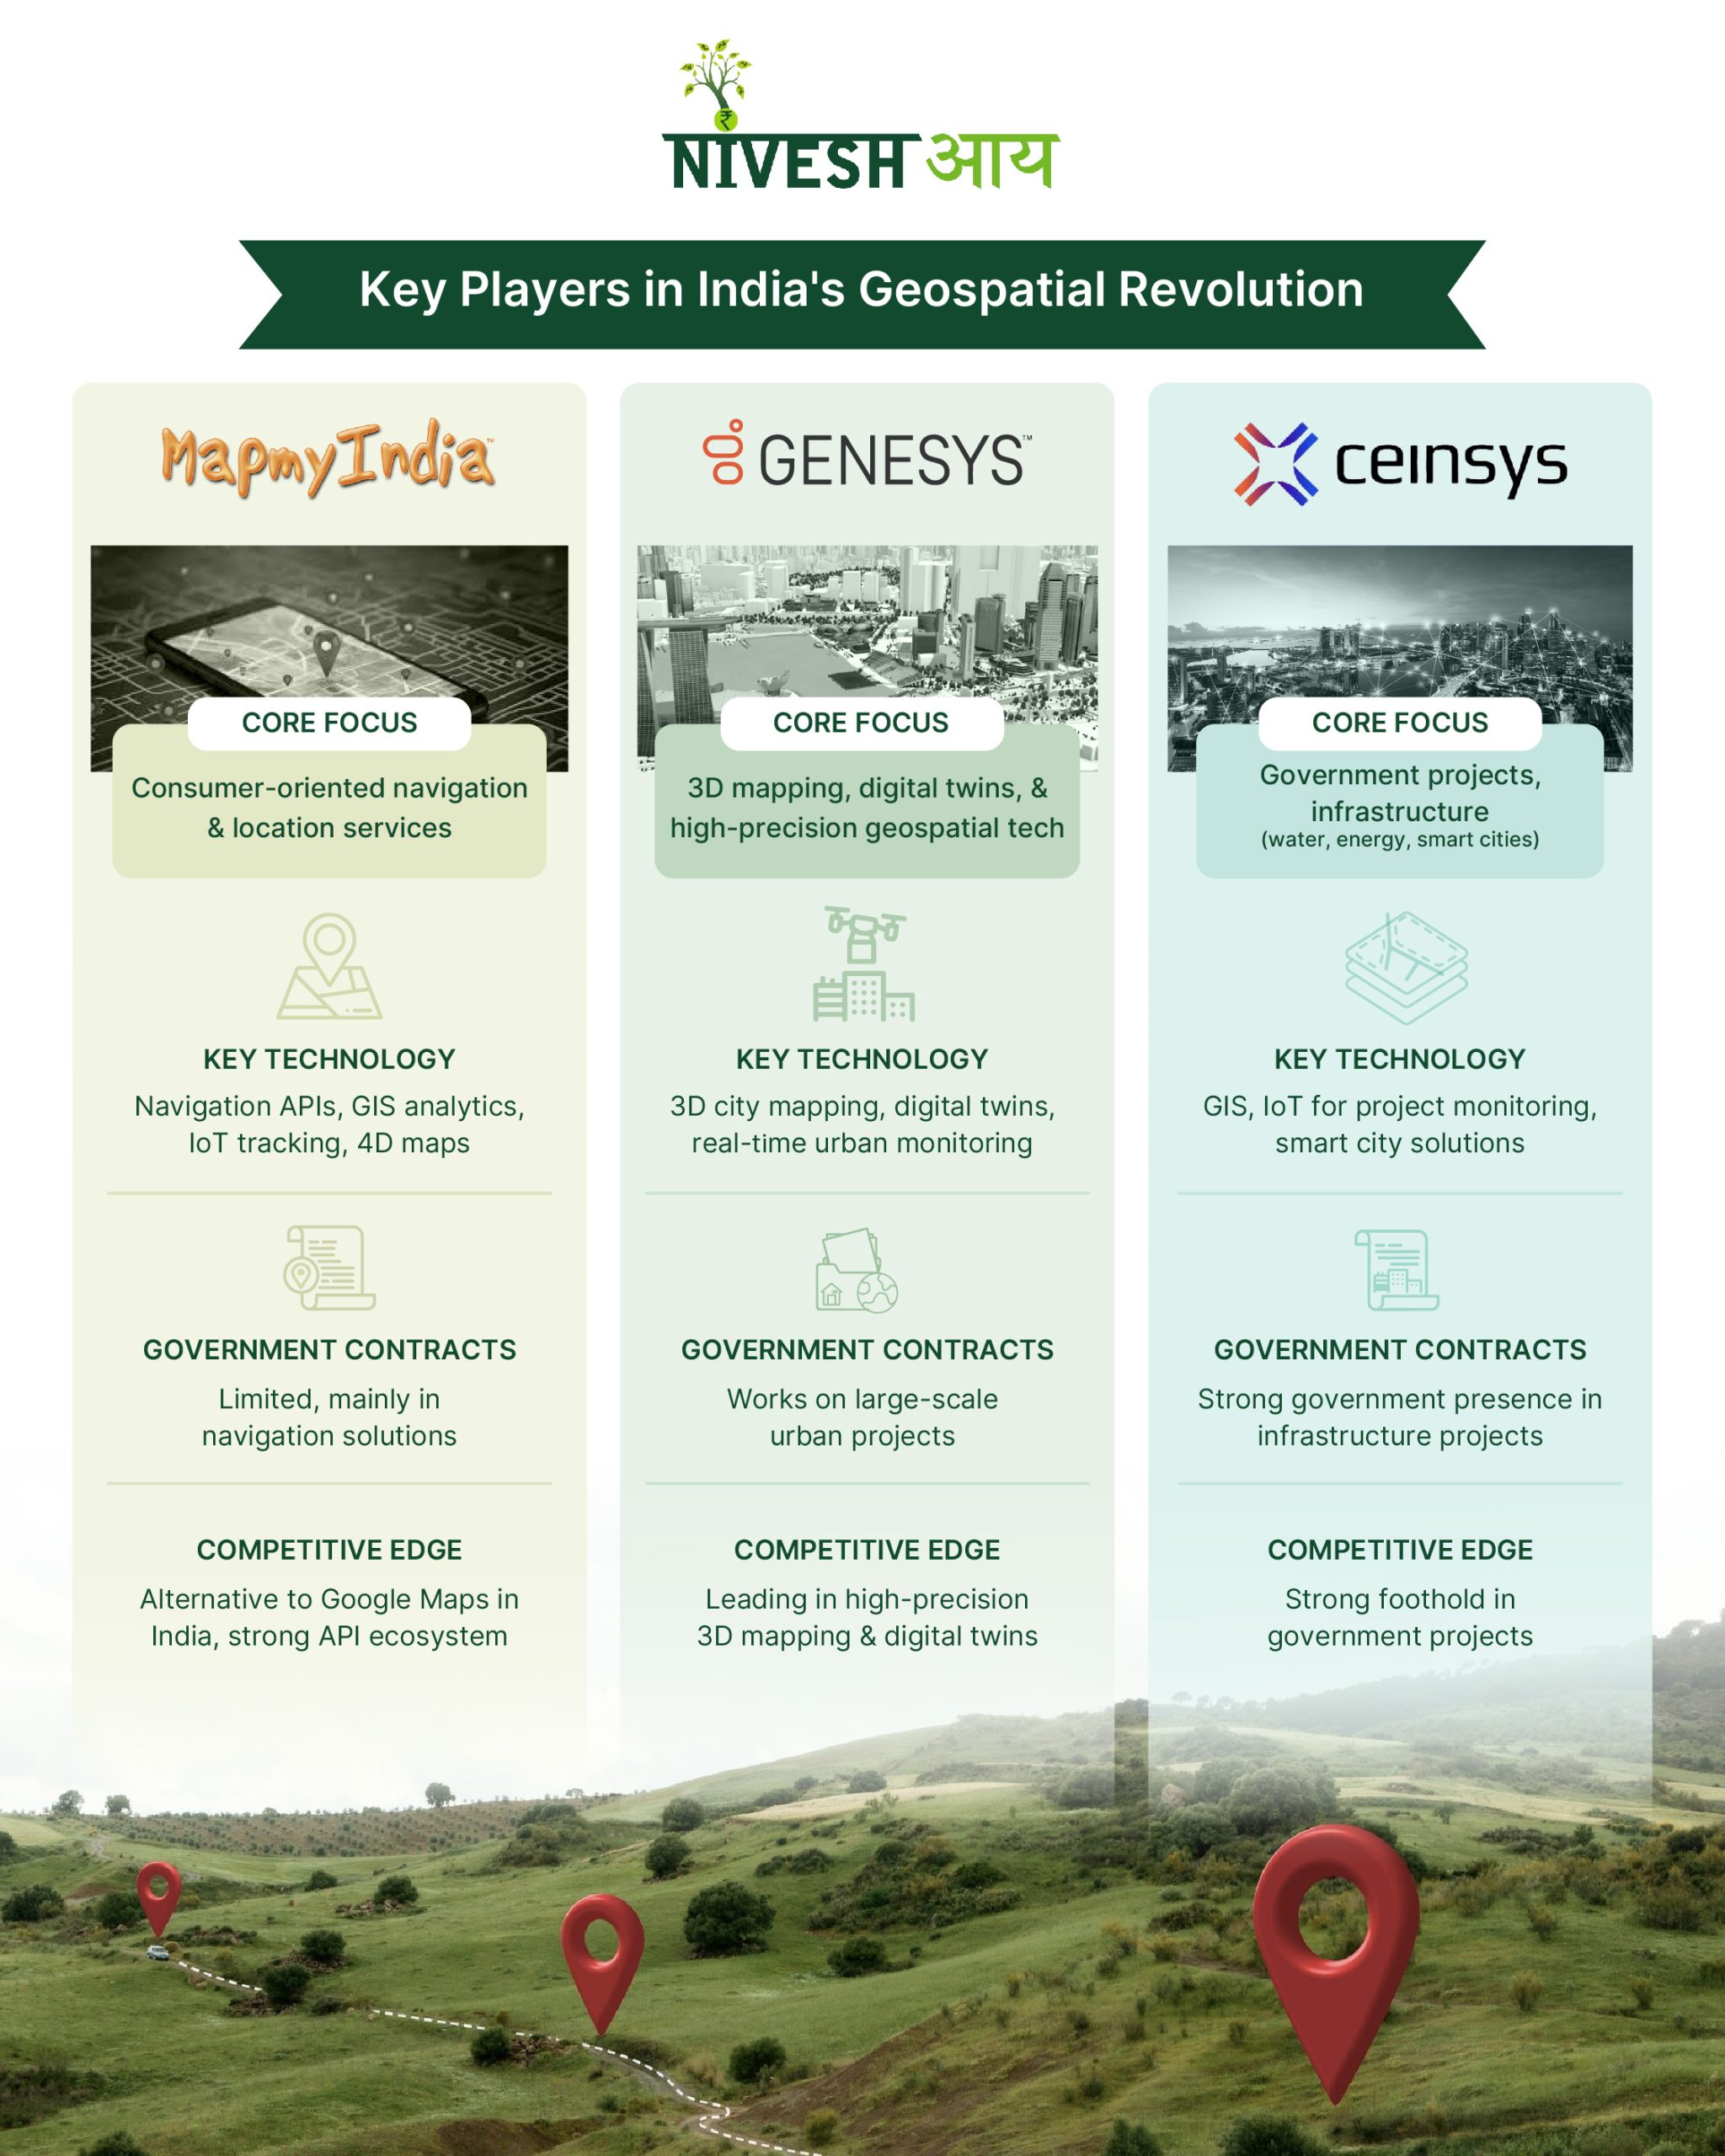
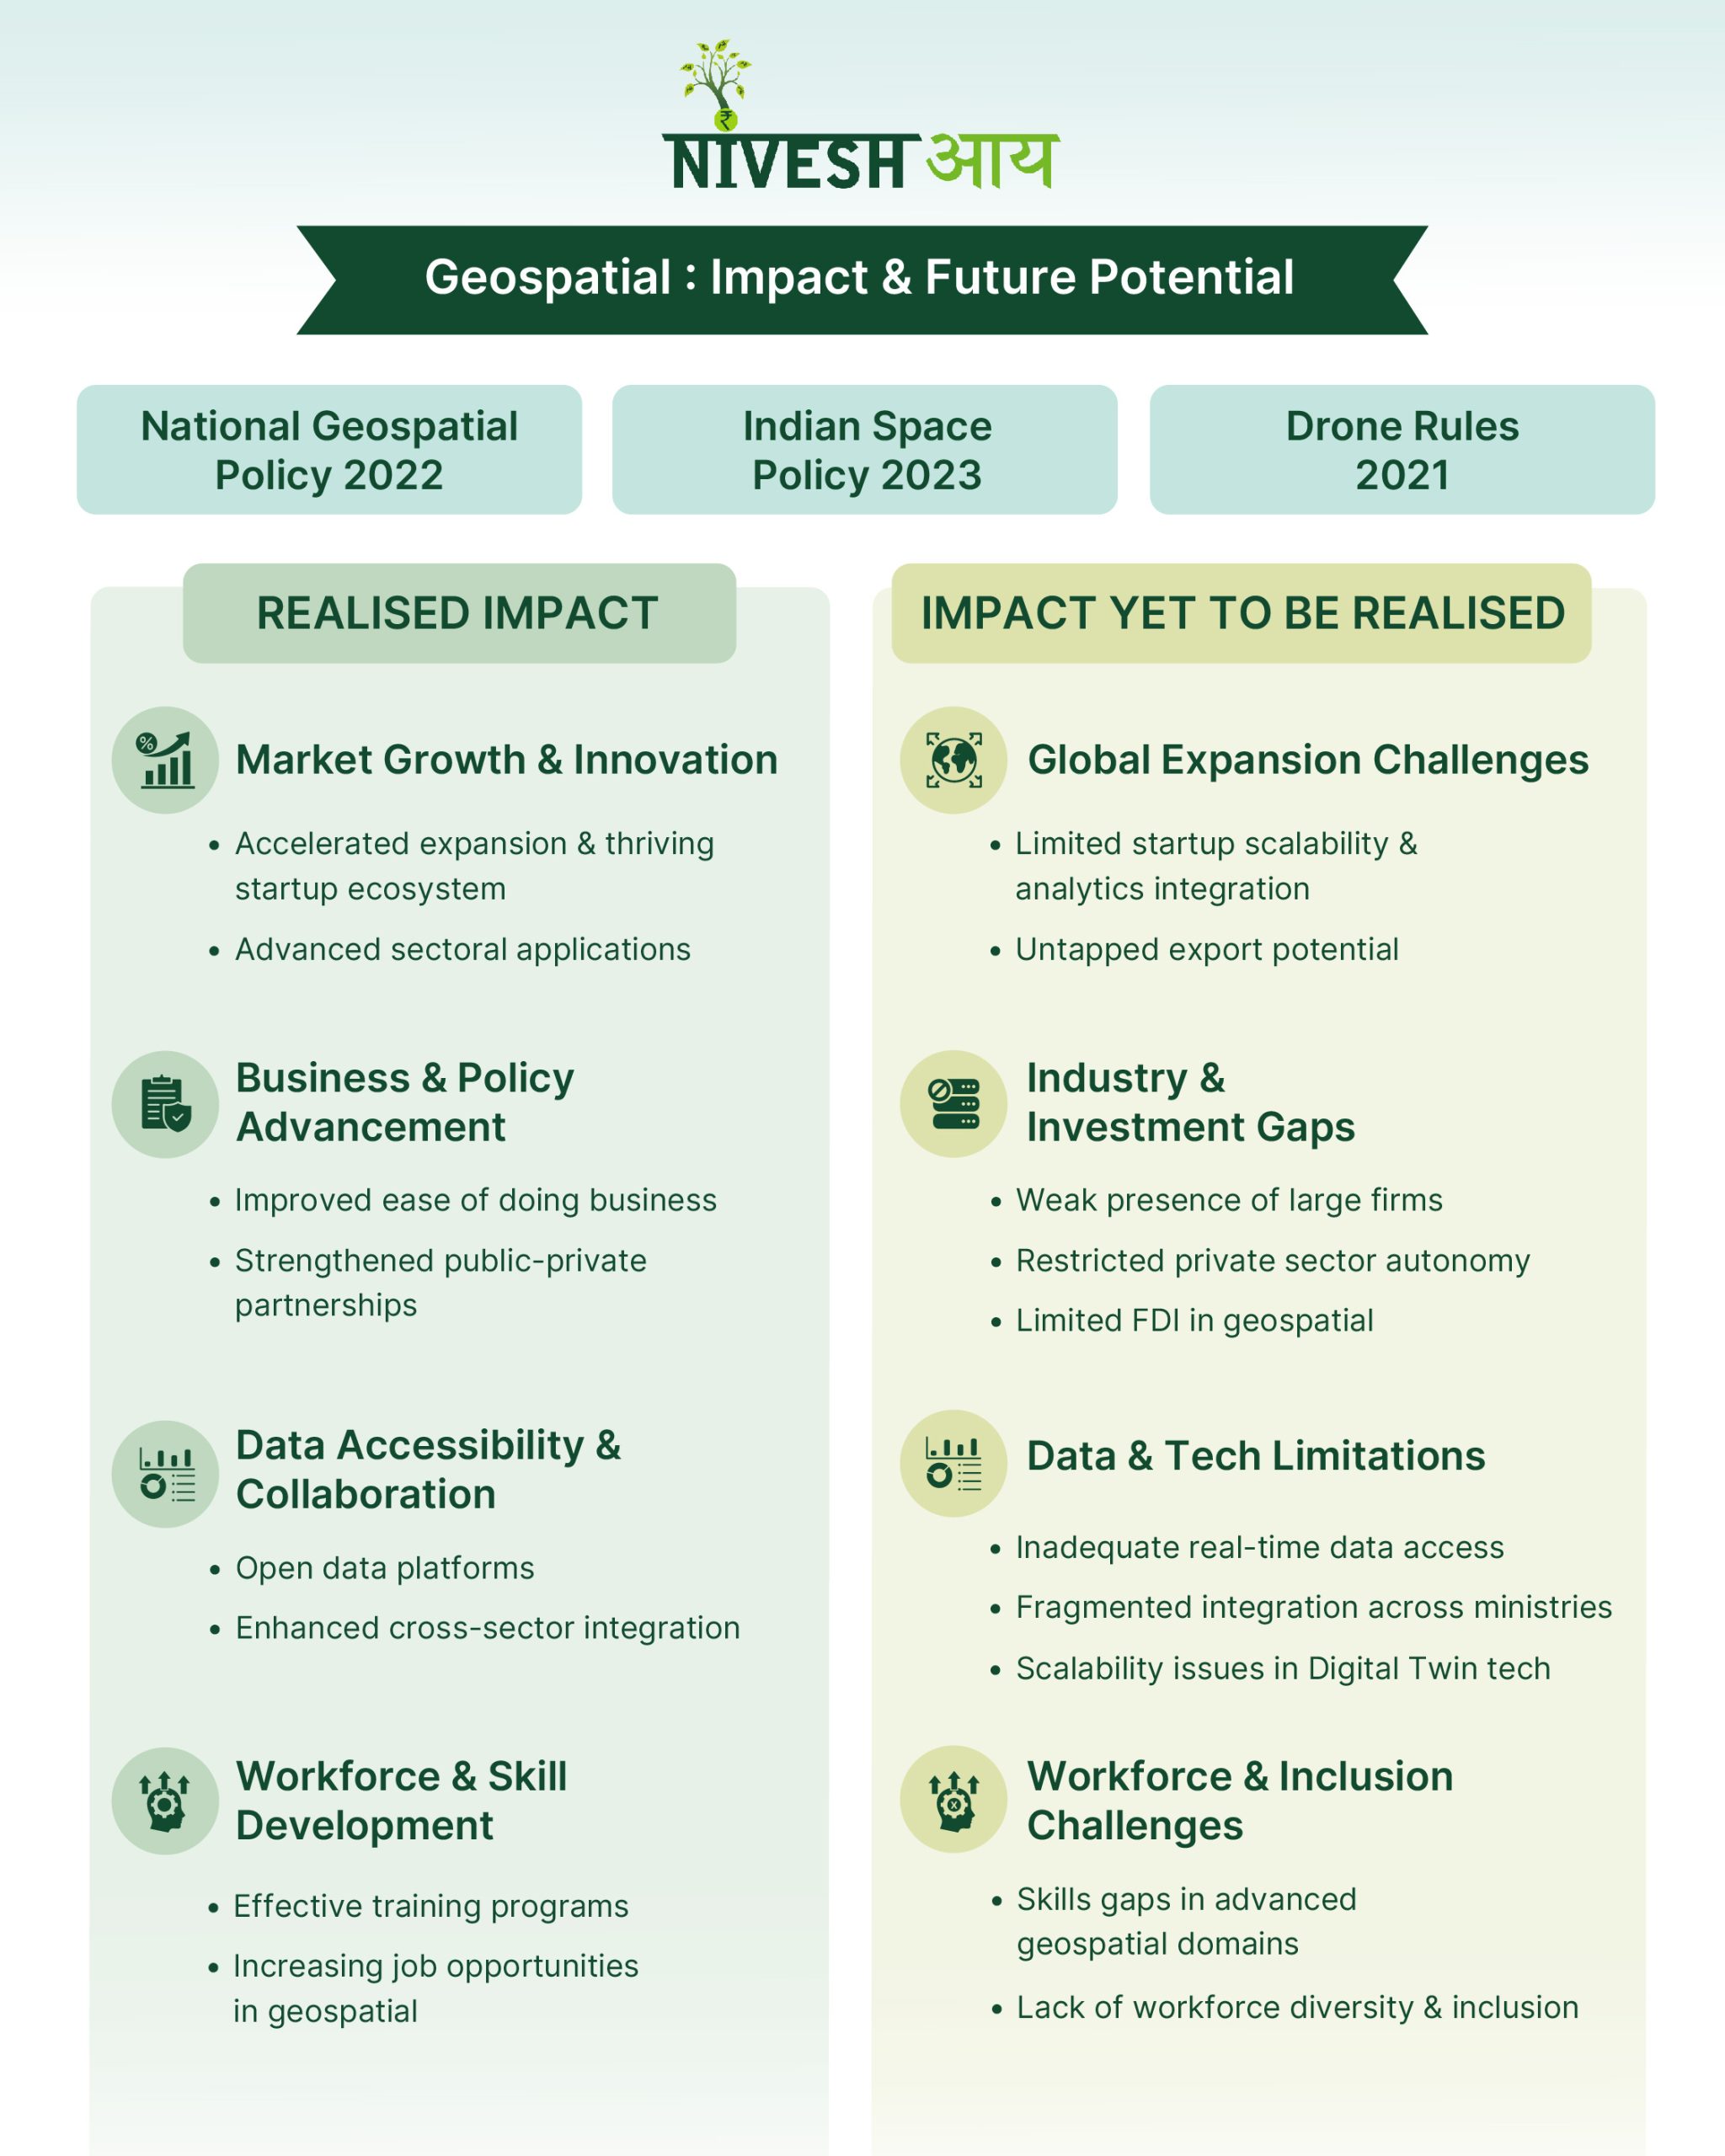
India’s geospatial sector is charting new frontiers! 🌍🛰
The race isn’t just about data—it’s about who deciphers it best!🧩 🔍
Key players are reshaping industries, impact is undeniable, and the future? A thrilling mix of challenges and opportunities.🏭🤝
Digital Infrastructure & Connectivity
IPOs: Beyond the Listing Day Hype – Unlocking Long-Term Wealth
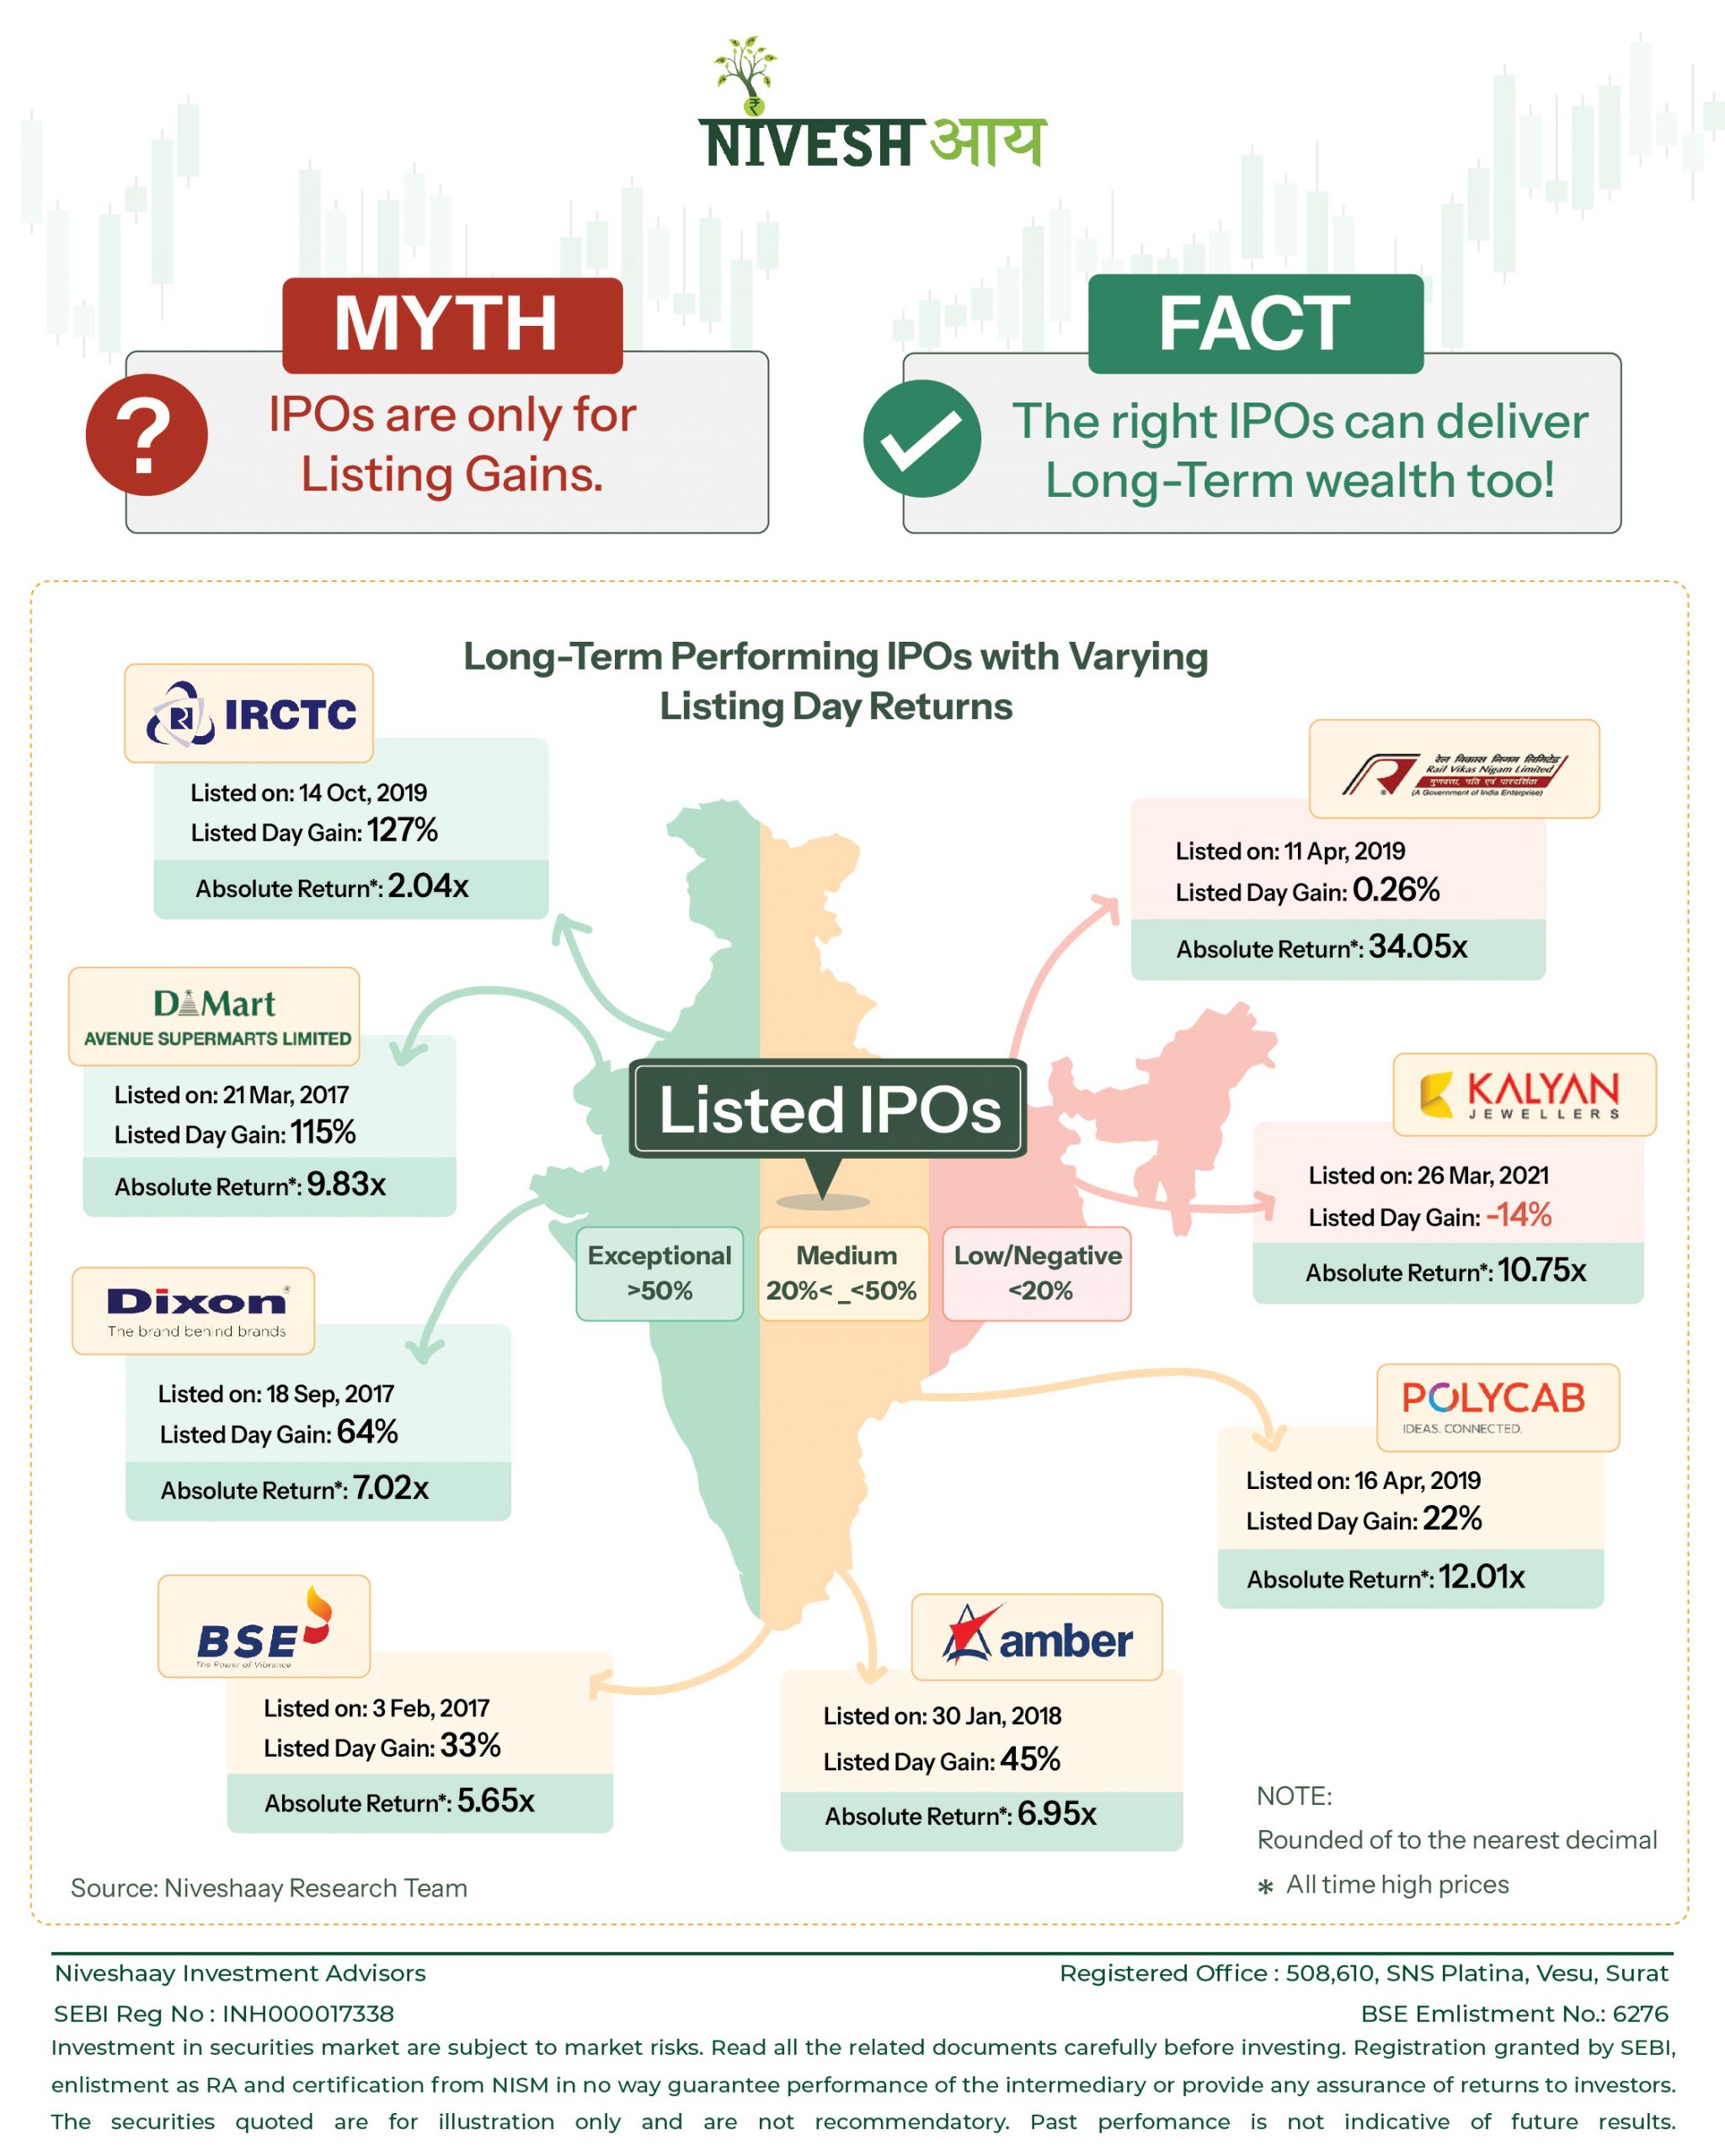
Evaluating an IPO solely based on listing day gains can be misleading📊. For long-term investors, business fundamentals and growth prospects matter more🚀. Companies like these exemplify how IPOs with different initial returns can drive significant long-term wealth creation💡.
Evaluating an IPO solely based on listing day gains can be misleading📊. For long-term investors, business fundamentals and growth prospects matter more🚀. Companies like these exemplify how IPOs with different initial returns can drive significant long-term wealth creation💡.
Textiles
Indian Textiles To The World
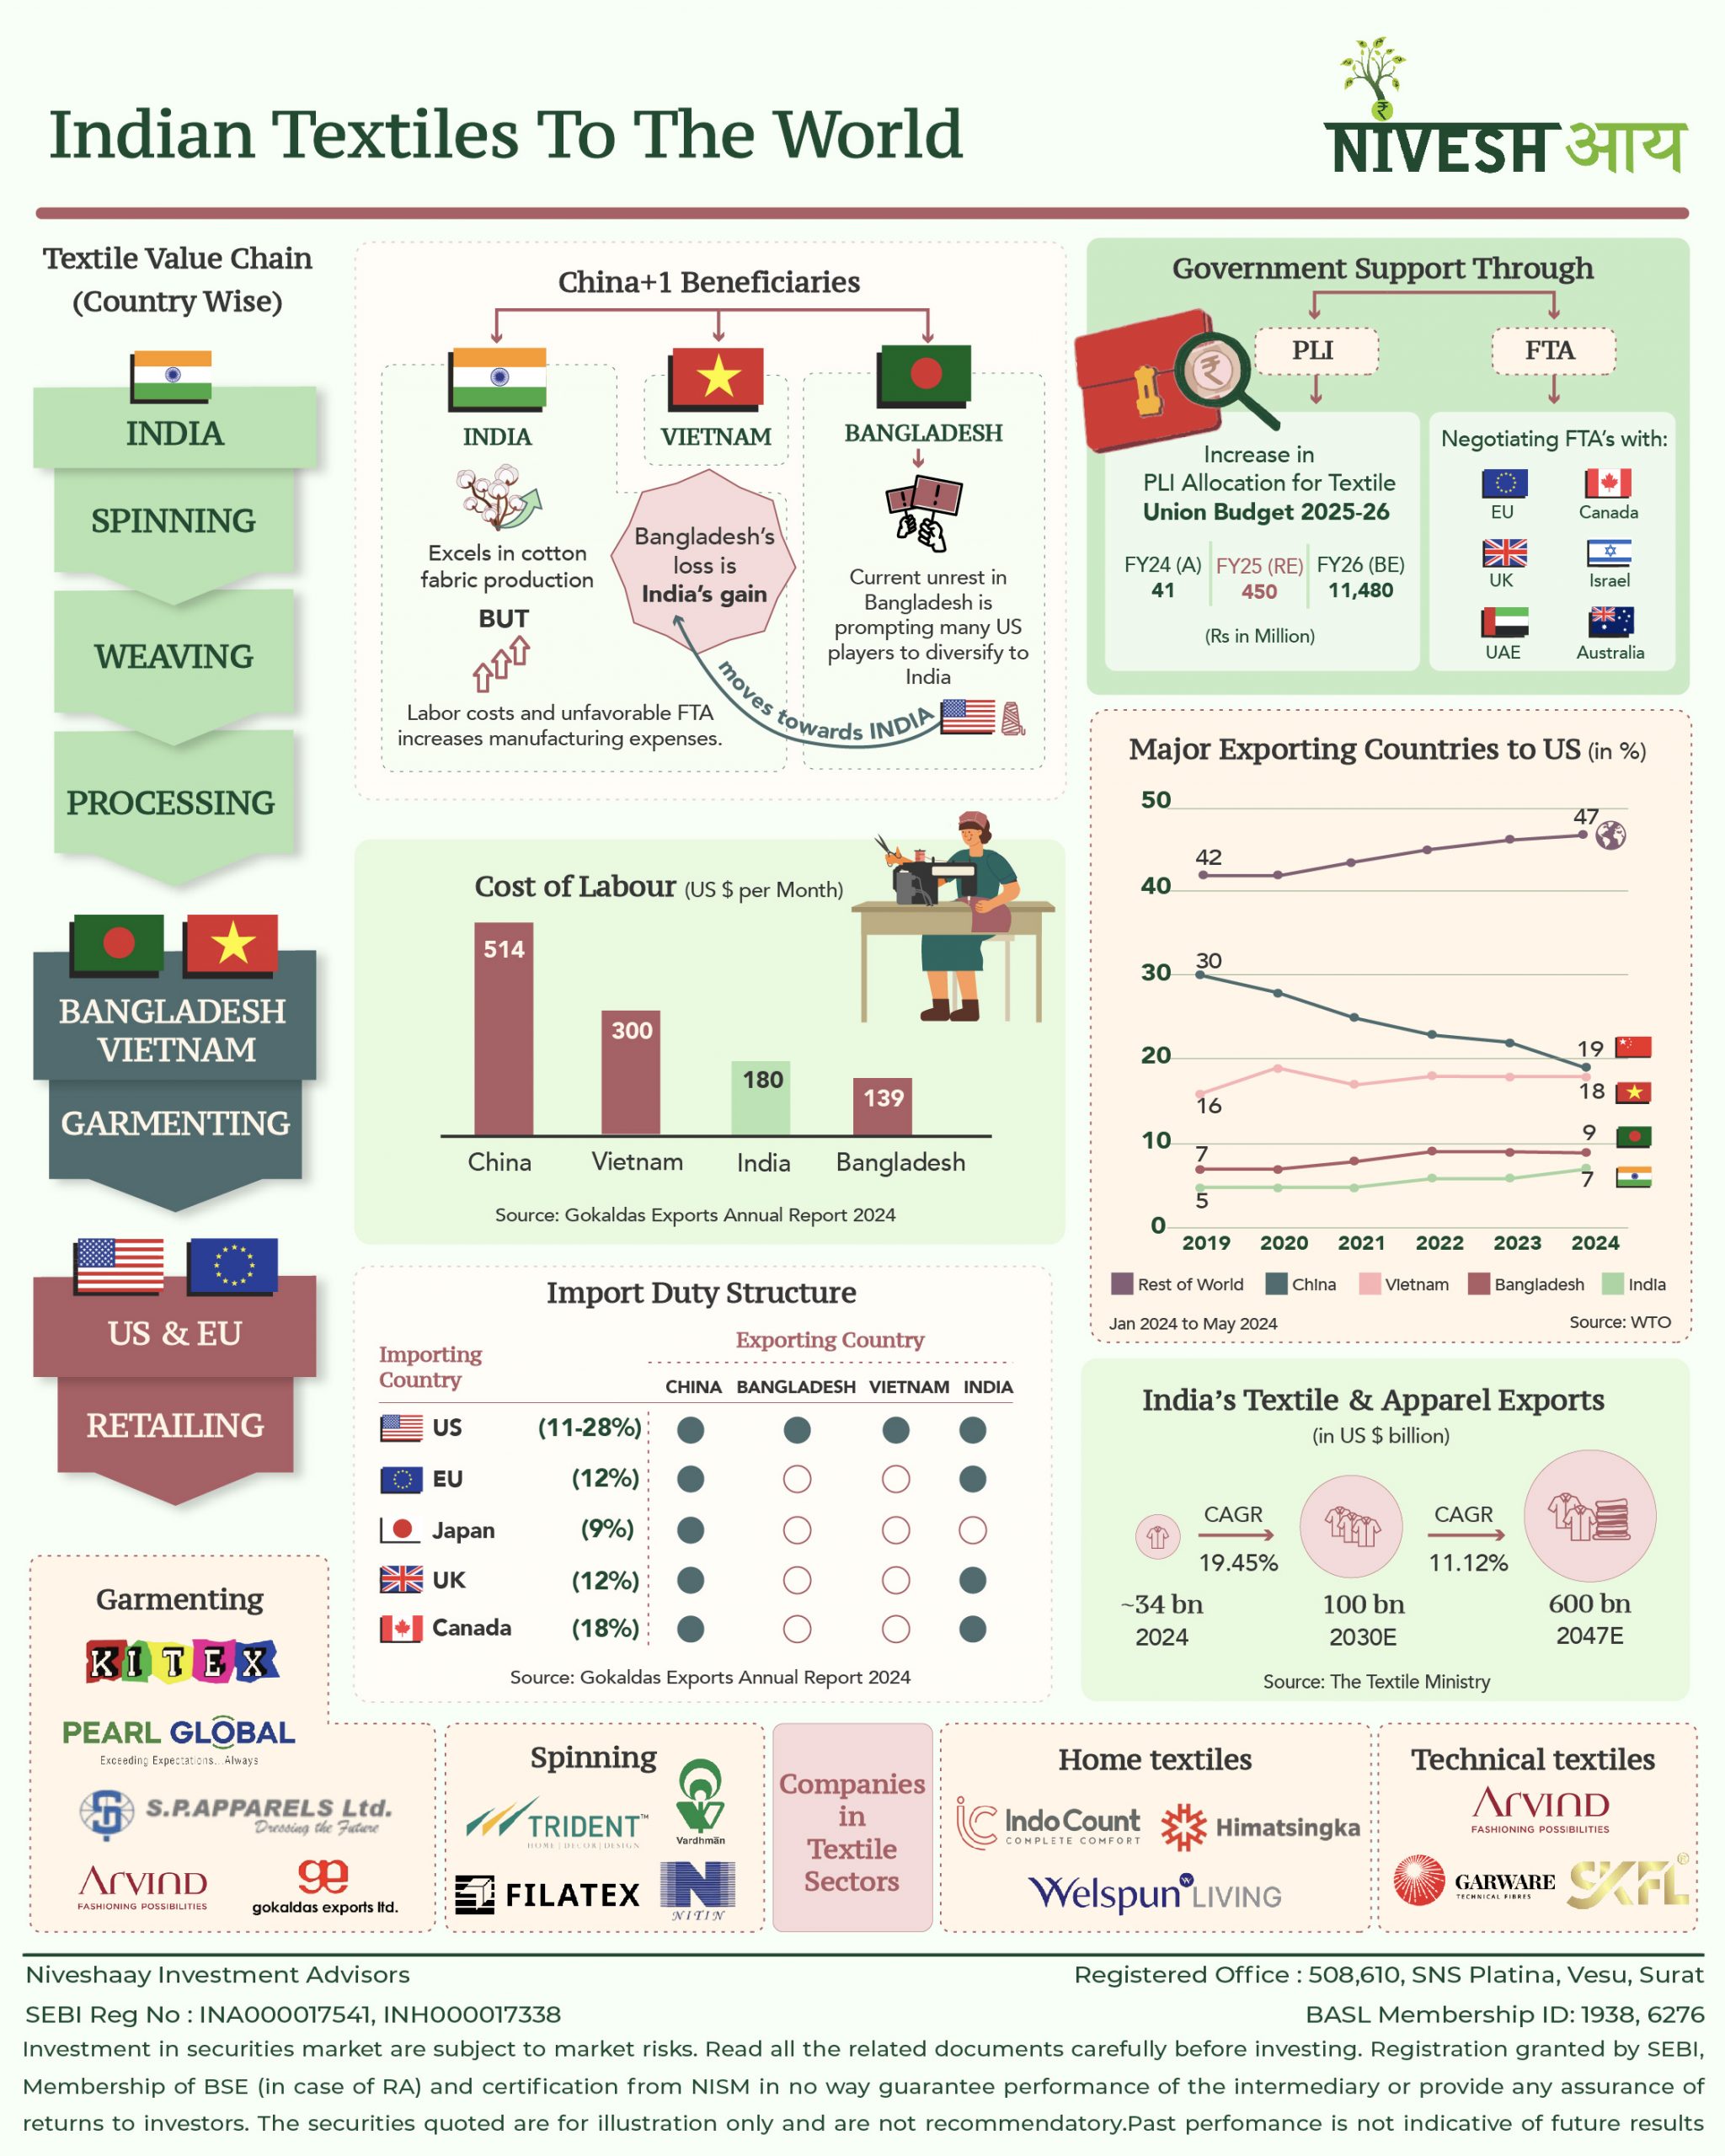
India's textile market is currently valued at $176 billion and contributes 2.3% to the GDP and 12% to exports, playing a crucial role in the economy. With its skilled workforce and cost advantages , India holds a competitive edge over major textile producers.🏭 The industry is on a strong growth trajectory 📈, projected to expand
India's textile market is currently valued at $176 billion and contributes 2.3% to the GDP and 12% to exports, playing a crucial role in the economy. With its skilled workforce and cost advantages , India holds a competitive edge over major textile producers.🏭 The industry is on a strong growth trajectory 📈, projected to expand at a 10% CAGR, reaching $350 billion by 2030. Additionally, textile exports are expected to surge to $100 billion, reinforcing India’s strong global presence and the increasing demand for its products. 👗👕

Textiles
Niveshaay Analysis of Indian Textiles and Apparel Industry
Why Indian Textile Industry?- Second largest employer after agriculture - Contributes 5% to India’s GDP, 7% of industrial outputs in value terms, 12% of the country’s export earnings Being, brought up in a textile family and living in the textile city of India, also led us to research this sector. Of course, there is no bias involved
Why Indian Textile Industry?
- Second largest employer after agriculture
- Contributes 5% to India’s GDP, 7% of industrial outputs in value terms, 12% of the country’s export earnings
Being, brought up in a textile family and living in the textile city of India, also led us to research this sector. Of course, there is no bias involved while presenting the report.
According to Maslow’s hierarchy theory, clothing is a basic and fundamental need. But, the industry working is quite different according to what the theory describes. This report aims to outline the same.
Apart from the supply chain re-alignment or ban on China, one more emerging trend is clothing is massively underutilized. The customers purchase more clothing than they will use and are quick to throw garments after use. Worldwide, clothing utilization – the average number of times a garment is worn before it ceases to be used – has decreased by 36% compared to 15 years ago. This is known as a fast-fashion trend.
In this report, we did an in-depth analysis of how the industry operates and which aspect of the value chain holds the most value and can provide us with great returns.
Generally, no single company in India has invested in the entire value chain from yarn to fabric to apparel.
A detailed note on the analysis is attached below.
niveshaay-textile-industry-report-1DownloadDisclaimers and Disclosures
SEBI Registration No. :INH000017338, IN/AIF3/24-25/1571, IN/AIF2/24-25/1607 | BASL Membership ID: 6276
Investment in Securities Market are subject to market risks. Read all related documents carefully before investing. The securities quoted are for illustration only and are not recommendatory. Registration granted by SEBI, membership of a SEBI recognized supervisory body (if any) and certification from NISM in no way guarantee performance of the intermediary or provide any assurance of returns to investors.

Space Ecosystem
Inside ELECRAMA 2025: Key Insights from the World’s Largest T&D Expo
What is ELECRAMA? ELECRAMA, organized by IEEMA (Indian Electrical and Electronics Manufacturers’ Association), is one of the largest global exhibitions dedicated to the power sector. The event gathers stakeholders from various segments of the power and energy industry, including transmission and distribution companies, equipment manufacturers, and service providers, making it a vital platform for sharing insights, innovations, and future trends
ELECRAMA, organized by IEEMA (Indian Electrical and Electronics Manufacturers’ Association), is one of the largest global exhibitions dedicated to the power sector. The event gathers stakeholders from various segments of the power and energy industry, including transmission and distribution companies, equipment manufacturers, and service providers, making it a vital platform for sharing insights, innovations, and future trends in the sector.

At ELECRAMA, key players from the transmission and distribution sectors showcase their latest technologies and solutions. The event serves as a meeting point for manufacturers of transformers, cables, smart meters, and power equipment, offering a comprehensive view of the entire value chain from generation to distribution.
The transformer market remains one of the most critical segments of the power transmission sector. With the growing demand for electricity globally and the rise in renewable energy integration, the transformer market is poised for strong growth. In the expo, companies showcased their capacity expansions, such as Indo Tech Transformers, which is increasing its capacity from 9,000 MVA to 15,000 MVA by FY27, reflecting strong industry demand. The gap between supply and demand for transformers is 2.5x, creating long-term order visibility and growth opportunities for manufacturers.
The cables and wires industry plays a crucial role in energy transmission, with low-voltage (LVC) and high-voltage (HVC) cables being fundamental for the smooth operation of power systems. The industry is experiencing strong growth, driven by a surge in infrastructure development and renewable energy integration. Dynamic Cables Ltd and other companies highlighted exports and domestic growth, especially in high voltage cables needed for underground cabling and long-distance power transfer. The EHV (Extra High Voltage) cable market, despite being a niche segment, is seeing strong demand due to urbanization and space constraints in cities.
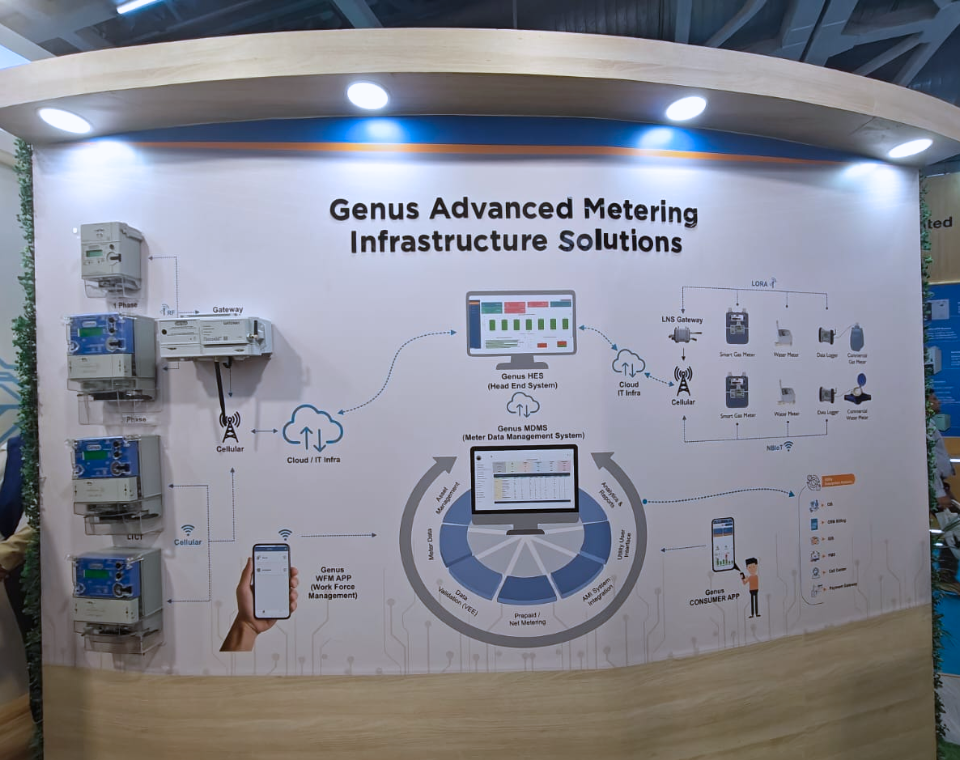
With a focus on smart grids, smart meters are becoming a crucial part of the modern power system. These devices enable more efficient energy management, providing real-time data and improving grid stability.
At ELECRAMA 2025, the spotlight on smart grids underscored the growing importance of smart meters in modernizing India's power sector. These advanced devices play a crucial role in enabling efficient energy management, offering real-time data insights, and enhancing grid stability. With the Indian government targeting the deployment of 250 million smart meters by 2027, the market presents a significant opportunity for technological advancements and investments. However, key challenges such as integrating smart meters with legacy infrastructure, managing deployment costs while maintaining grid reliability, and ensuring robust cybersecurity measures remain focal points for the industry. Additionally, consumer awareness and education are essential for widespread adoption. Beyond reducing Aggregate Technical & Commercial (AT&C) losses, smart meters help curb electricity theft, ensure accurate billing, and provide critical insights for demand forecasting and grid optimization.
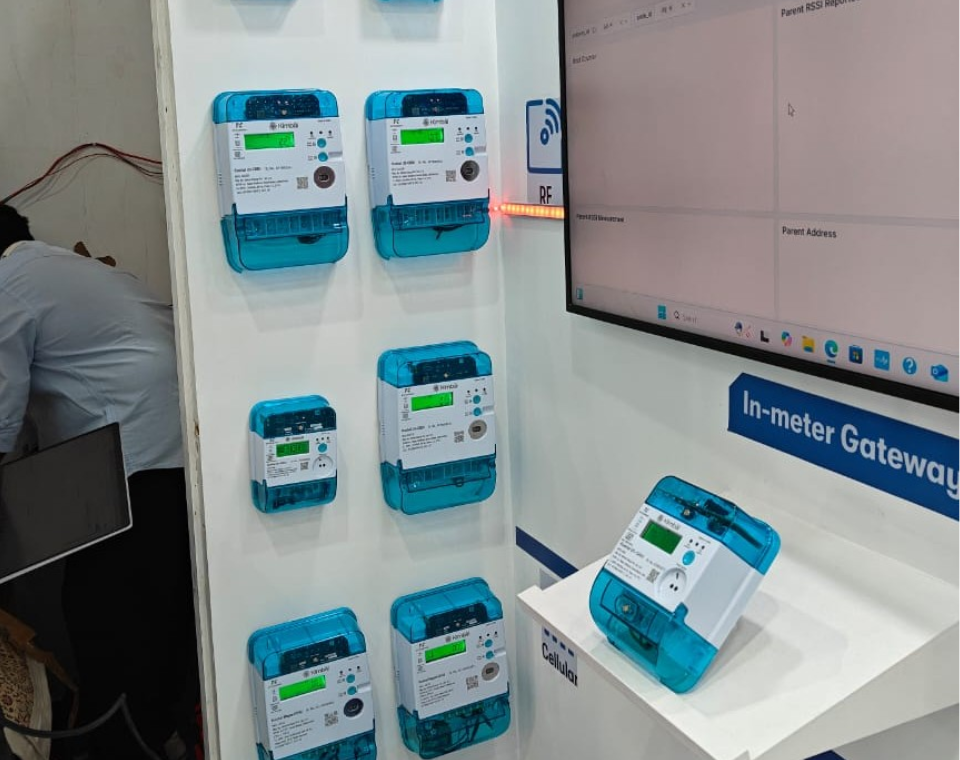
The exhibition saw key partnerships and technological advancements. Tata Power Delhi Distribution Limited (Tata Power-DDL) has teamed up with Probus Smart Things to deploy Bluetooth-enabled Network Interface Cards (NICs) in smart meters, improving connectivity in low-network areas and driving innovation through joint patent filings. Similarly, HPL Electric, in collaboration with Wirepas, launched Wirepas-certified in-meter gateway, integrating RF mesh networking directly into smart meters, reducing infrastructure costs, and enhancing data transmission efficiency. Kimbal showcased its latest innovations, including an in-meter gateway and allied solutions across the power value chain, such as Remote Terminal Units (RTU), Supervisory Control and Data Acquisition (SCADA) systems, and Energy Management Systems (EMS). These advancements reflect the industry's commitment to smarter grid solutions. Industry leaders, including OEMs, communication providers, and cybersecurity experts, expressed optimism at ELECRAMA 2025, signalling a significant step forward in grid modernization, energy efficiency, and consumer engagement within India's evolving power sector.

The government's emphasis on upgrading the power sector, particularly with initiatives like smart grid development and green energy integration, creates significant tailwinds for the industry. These initiatives are designed to improve grid reliability, integrate solar and wind energy, and expand cross-border transmission. With increased capital expenditure in power infrastructure, the transformer and cable markets are expected to grow at double digits for the next 3-4 years.
As the world transitions to clean energy, the demand for High Voltage Direct Current (HVDC) technology is accelerating. Quality Power Ltd, with a niche product to the HVDC market, has emerged as a strong player with high-voltage power systems that cater to the global energy transition. The growing demand for HVDC solutions stems from the need for long-distance power transmission and renewable energy integration. Companies investing in HVDC technologies are poised to capture a significant share of this growing market.
The future of the power industry looks promising, with significant growth expected in transformers, cables, smart meters, and HVDC technologies. The continued investments in renewable energy, power transmission infrastructure, and smart grid solutions are set to drive long-term industry expansion. Companies with strong R&D capabilities, such as Apar Industries with their innovative ACCE core conductors, are likely to lead in product differentiation, while those with backward integration, like TRIL, will benefit from improved supply chain efficiency and cost control.
New players in niche markets, such as HVDC and smart meters, are emerging and will likely disrupt traditional models by offering advanced, efficient solutions. As the demand for green energy and smart grids increases, established and emerging companies will need to adapt quickly to technological advancements and market demands.
ELECRAMA 2025 highlighted the dynamic growth and transformation happening in the power transmission and distribution industries. From transformers and cables to smart meters and HVDC systems, the industry is moving towards innovative, efficient solutions to meet the rising demand for electricity and the integration of renewable energy. The strong government support, along with technological advancements and strategic industry collaborations, ensures that the power sector will continue to evolve, offering exciting opportunities for investors and stakeholders. As the market expands, companies that can innovate and adapt to the changing energy landscape will be the key players in shaping the future of the power industry.
Disclaimers and Disclosures
SEBI Registration No. :INH000017338, IN/AIF3/24-25/1571, IN/AIF2/24-25/1607 | BASL Membership ID: 6276
Investment in Securities Market are subject to market risks. Read all related documents carefully before investing. The securities quoted are for illustration only and are not recommendatory. Registration granted by SEBI, membership of a SEBI recognized supervisory body (if any) and certification from NISM in no way guarantee performance of the intermediary or provide any assurance of returns to investors.
Aerospace & Defense
Niveshaay’s Take On ‘Union Budget 2025’
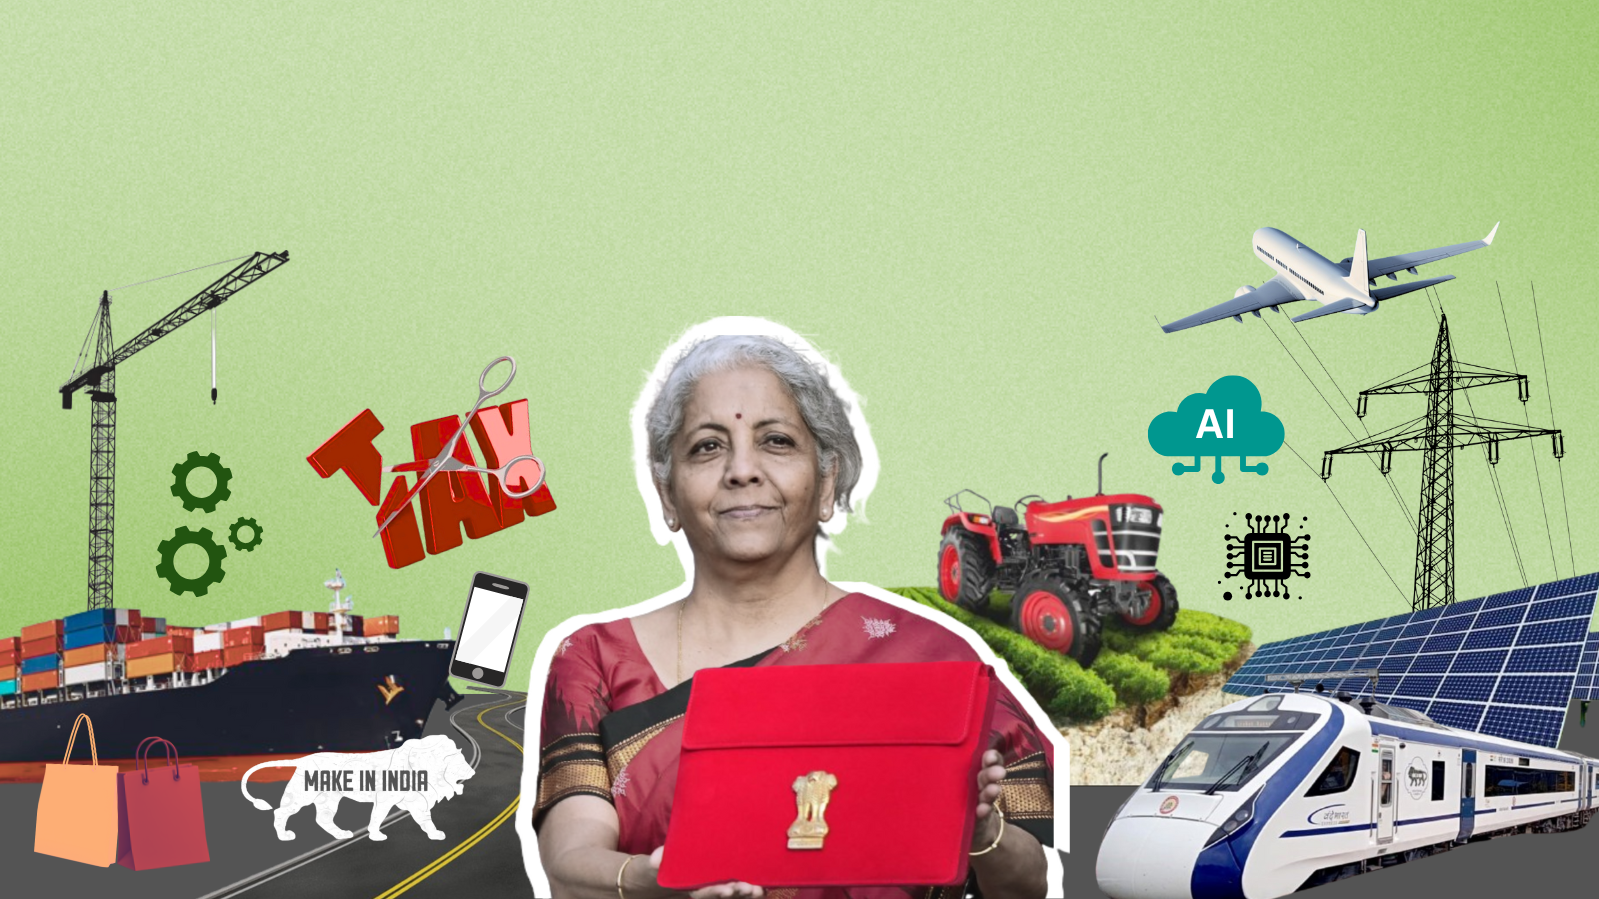
The Union Budget 2025 reflects the government’s commitment to balancing fiscal discipline with growth-oriented reforms to support India’s economic development amid global uncertainties. With a projected GDP growth of 6.3– 6.8% for FY26 and a fiscal deficit target of 4.4% (down from 4.8%), the budget strikes a prudent balance between fiscal consolidation and economic expansion. The budget strongly
The Union Budget 2025 reflects the government’s commitment to balancing fiscal discipline with growth-oriented reforms to support India’s economic development amid global uncertainties. With a projected GDP growth of 6.3– 6.8% for FY26 and a fiscal deficit target of 4.4% (down from 4.8%), the budget strikes a prudent balance between fiscal consolidation and economic expansion.
The budget strongly emphasizes boosting domestic consumption through targeted measures aimed at enhancing disposable income, stimulating demand, and driving economic activity. This is evident through income tax relief for the middle class, encouraging higher spending, and initiatives like the modified UDAN scheme to improve regional connectivity and tourism.
The government plans to forgo Rs. 1 lakh crore in direct taxes and Rs. 2,600 crores in indirect taxes due to various tax breaks. Despite this, the finance minister expects the fiscal deficit to decrease from 4.8% to 4.4% of GDP in FY26. This is possible because the government is relying on non-tax revenue from increased dividends from public sector companies and banks, which are expected to rise by 10%. Additionally, even with lower direct taxes, increased consumer spending will likely boost GST collections. Since companies are not receiving tax relief but are expected to benefit from higher demand, corporate tax revenue is projected to grow by 10%, reaching Rs. 10.8 lakh crore for FY26.
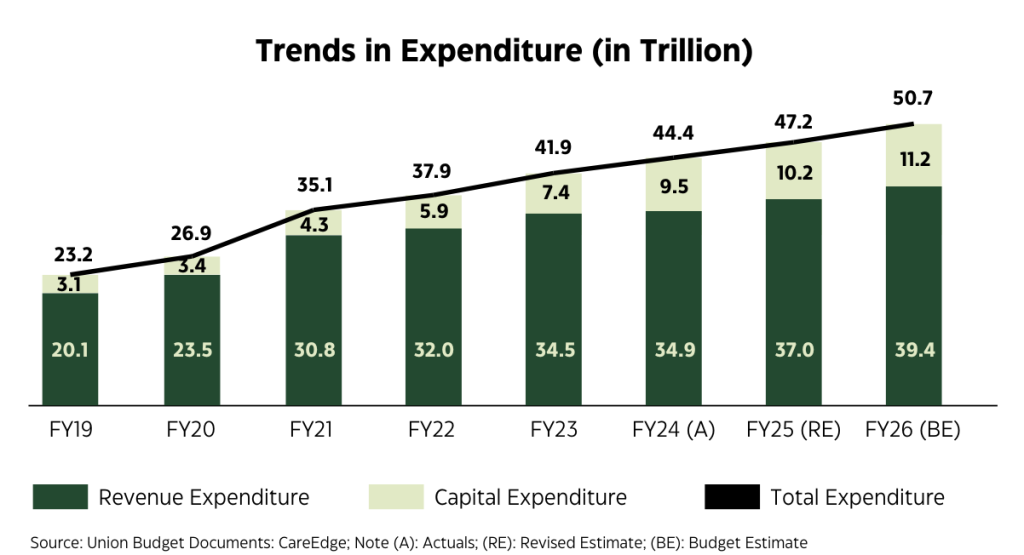
In the current budget, the government’s capital expenditure (capex) for FY 2024- 25 was initially targeted at Rs. 11.11 lakh crore, but the actual capex stands at Rs.10.18 lakh crore, reflecting a more conservative spending approach amid fiscal constraints. This shortfall highlights cautious expenditure driven by revenue pressures from lower tax collections and non-tax receipts. As a result of these fiscal pressures, the capex for the next fiscal year (FY 2025-26) is projected at Rs. 11.21 lakh crore, indicating moderate growth with a continued focus on fiscal prudence. To maintain fiscal discipline while supporting growth, the government is prioritizing investments in critical sectors like infrastructure, energy, and healthcare.
Energy: Green Growth Strategy
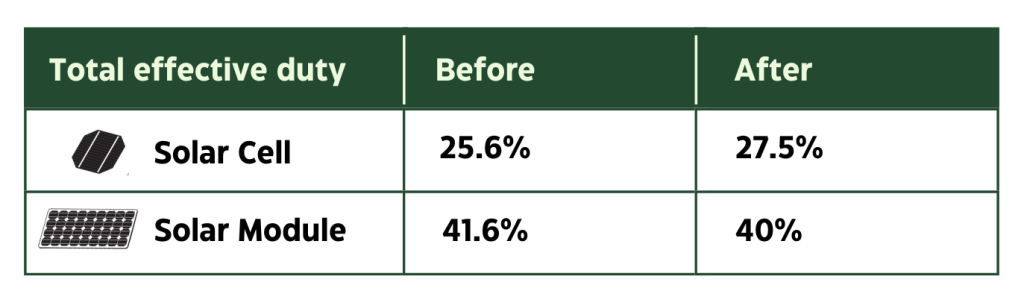
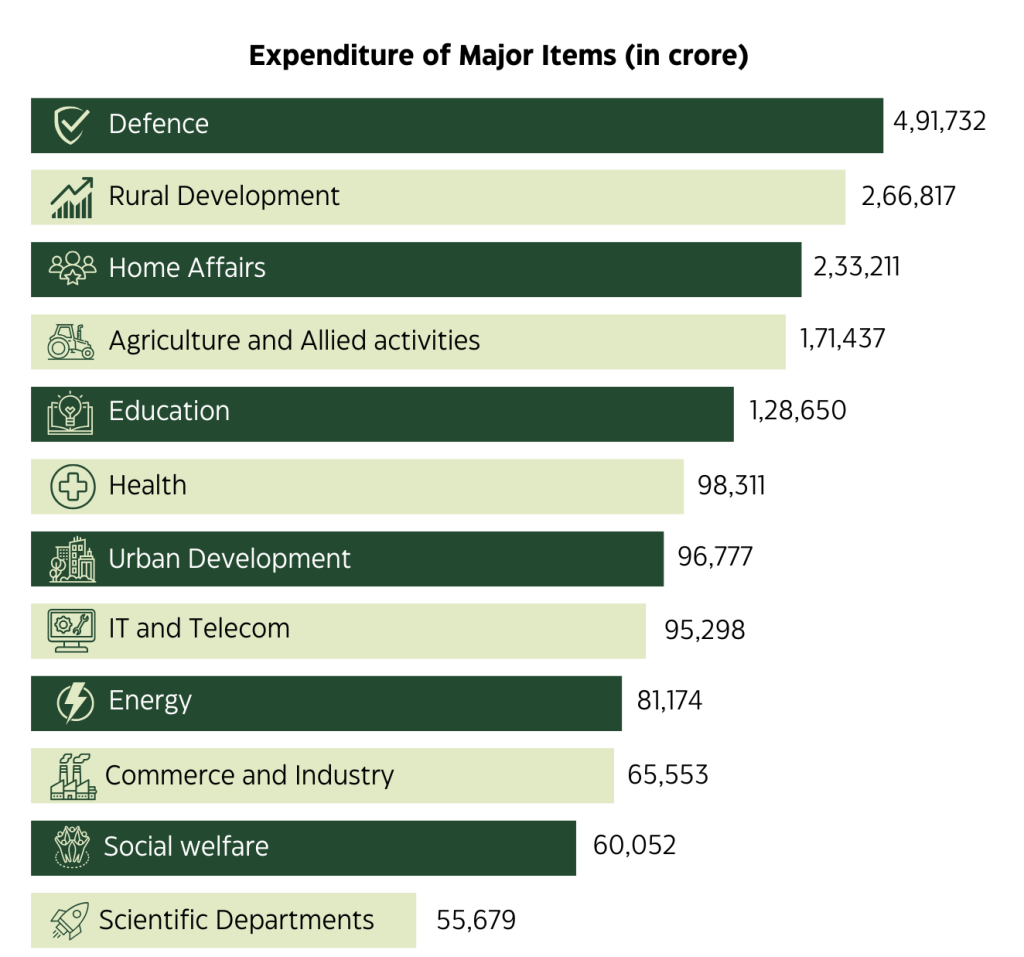
The budget prioritizes the development of India's manufacturing capabilities in strategically important areas. With a focus on the power sector’s role in national growth, the government aims to strengthen domestic value addition in solar energy, electric vehicles, lithium-ion batteries, and high-voltage transmission.
While higher solar cell duties may affect module makers' margins, it aims to reduce imports and strengthen local manufacturing.
The budget aims to develop atleast 100 GW of nuclear energy by 2047, allocating Rs. 20,000 crore for a new Nuclear Energy Mission focused on small modular reactors, marking a key step in advancing India’s nuclear energy capabilities and supporting the energy transition.
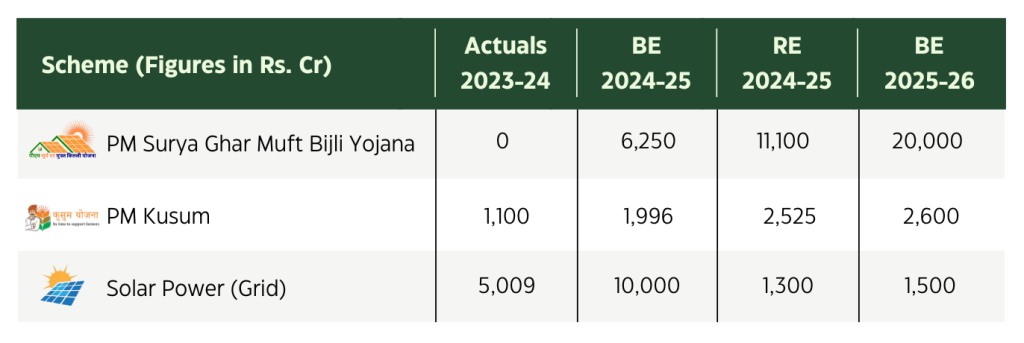
As part of the outlay, there is a significant increase in allocation for PM Surya Ghar and a marginal increase in PM KUSUM and Solar power grid. PM-KUSUM Yojana has benefited the farmers by improving irrigation facilities through subsidies provided by either promoting the installation of solar pumps or solarisation of existing grid-connected agricultural pumps.
In a significant move to boost the availability of critical minerals essential for India’s clean energy transition, the finance minister eliminated customs duties—previously at 10%, 5%, and 2.5%—on waste and scrap of key minerals like antimony, beryllium, bismuth, cobalt, cadmium, molybdenum, rhenium, tantalum, tin, tungsten, zirconium, and copper.
Waste and scrap of lithium-ion batteries, cobalt powder, lead, and zinc, which were previously subject to a 5% duty, have also been fully exempted.
This follows Sitharaman’s July 2024 Budget announcement to exempt basic customs duty on 25 critical minerals unavailable domestically and to reduce duties on two others, aimed at encouraging their processing, particularly by micro, small, and medium enterprises. These measures would secure raw material availability for domestic manufacturing and create employment opportunities for Indian youth.
The Union Budget 2025 marks a pivotal shift in India’s economic policy, with more focus on a consumption-driven growth model. Instead of relying solely on capital-intensive investments, the government is channeling resources toward stimulating domestic demand and consumer spending. A landmark move in this direction is the extension of the tax-free threshold to Rs 12.75 lakh for individual salaried taxpayers under the new tax regime, injecting Rs 1 trillion into middle-class households and significantly boosting disposable income to invigorate the marketplace.
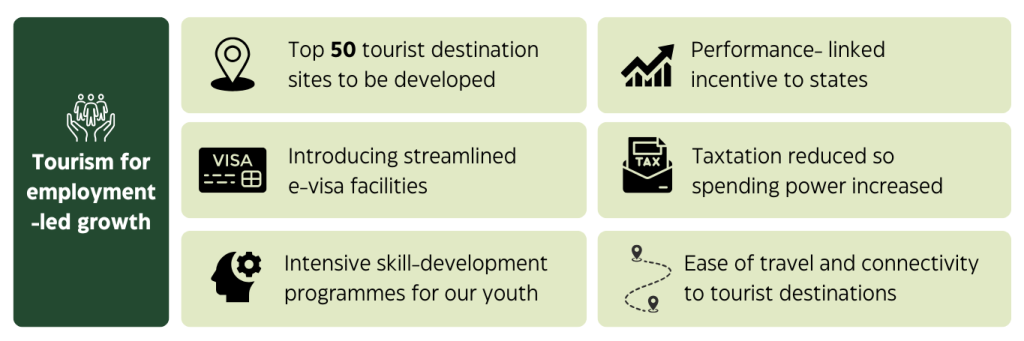
Supporting this consumption-led growth, the modified UDAN scheme aims to connect 120 new destinations and carry 4 crore passengers over the next decade, enhancing regional connectivity and indirectly stimulating sectors like hospitality, retail, and local businesses. Additionally, the development of 50 key tourist destinations is set to drive domestic tourism, creating employment opportunities and fostering economic activity in related sectors.
The budget promotes consumerism while encouraging responsible financial behavior. Rising per capita income is set to drive India’s consumption growth, while also fostering a culture of savings and investments. This balanced approach will benefit the wealth management sector, poised for growth with an expanding retail investor base and high-net-worth individuals, helping maximize financial potential in India’s evolving economy.
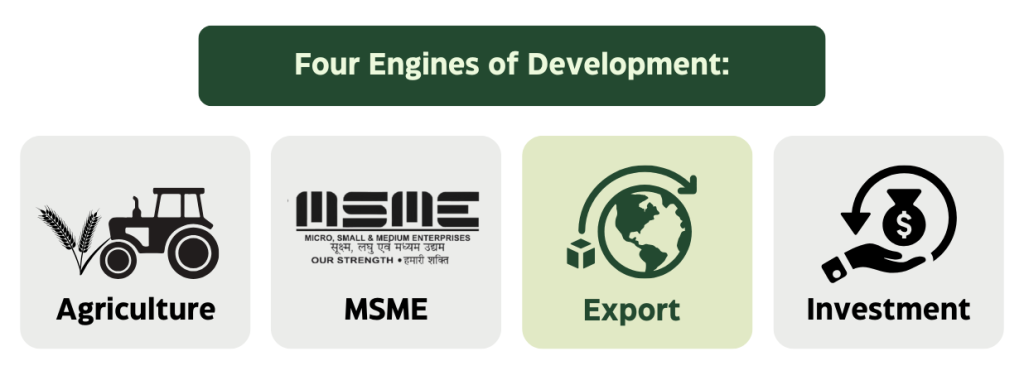
This budget demonstrates a strong government focus on boosting exports. A multi-pronged approach aims to streamline export processes and enhance competitiveness. The Export Promotion Mission, with sectoral targets, will facilitate easier access to export credit, cross-border factoring support, and assistance for MSMEs navigating overseas market challenges.
'BharatTradeNet' (BTN), a new digital platform, will unify trade documentation and financing solutions, supporting integration with global supply chains. A National Framework for GCCs (Global Capability Centres) will guide states in promoting these centers in tier 2 cities, potentially creating new export opportunities. Finally, upgraded air cargo warehousing, especially for perishable goods, will address logistical bottlenecks and facilitate their export.
Electronics Industry
Further, it was also announced that the government will support the domestic electronic equipment industry in leveraging the opportunities related to Industry 4.0.
Crucially, substantial funding increases for the Ministry of Electronics and Information Technology (MeitY), including a near doubling of the allocation for semiconductor development, and a 55% rise in overall PLI scheme funding to Rs 9,000 crore, directly support and strengthen domestic electronics and semiconductor manufacturing.
Textiles, Pharma and Others
The duty on shuttle-less looms has been eliminated, promoting domestic production of geotextiles, Agro-textiles, and medical textiles, reflecting the government's goal to enhance technical textile output.
Similarly, the reduction in duties on pharmaceutical ingredients aims to boost domestic manufacturing in the pharma sector. Beyond these, the budget also promotes local toy manufacturing and includes various other announcements aimed at bolstering the manufacturing sector, collectively aiming to enhance India's manufacturing capabilities and self- reliance.
The Union Budget 2025 takes a significant step toward tax simplification and easing the financial burden on taxpayers. By increasing the income tax exemption limit to Rs. 12 lakh, the government is providing substantial relief to the middle class, which will not only boost savings and investments but also lead to higher disposable income, driving increased consumer spending.
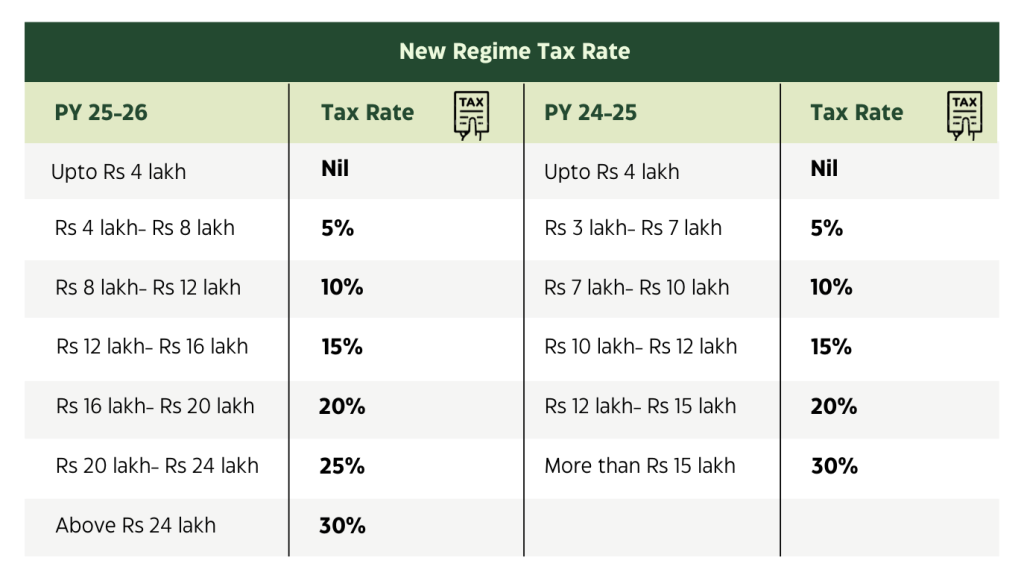
New Income Tax Bill would be tabled in Parliament in this Budget Session. This is proposed to replace existing Income Tax Act, 1961.
The Union Budget 2025-26 strikes a balance between growth aspirations and fiscal discipline. For investors, the focus on capex, renewable energy, domestic manufacturing, and tax reforms creates a dynamic landscape of opportunities across sectors. As India charts its path towards a $10 trillion economy, strategic investments aligned with government priorities can unlock significant value.
Budget 2025 thus reflects a strategic balance, shifting from an infrastructure- centric approach to a model that leverages consumption and responsible investments to drive sustainable economic growth and long-term prosperity.
Disclaimers and Disclosures
SEBI Registration No. :INH000017338, IN/AIF3/24-25/1571, IN/AIF2/24-25/1607 | BASL Membership ID: 6276
Investment in Securities Market are subject to market risks. Read all related documents carefully before investing. The securities quoted are for illustration only and are not recommendatory. Registration granted by SEBI, membership of a SEBI recognized supervisory body (if any) and certification from NISM in no way guarantee performance of the intermediary or provide any assurance of returns to investors.
Power & Renewable Energy
Union budget 2025
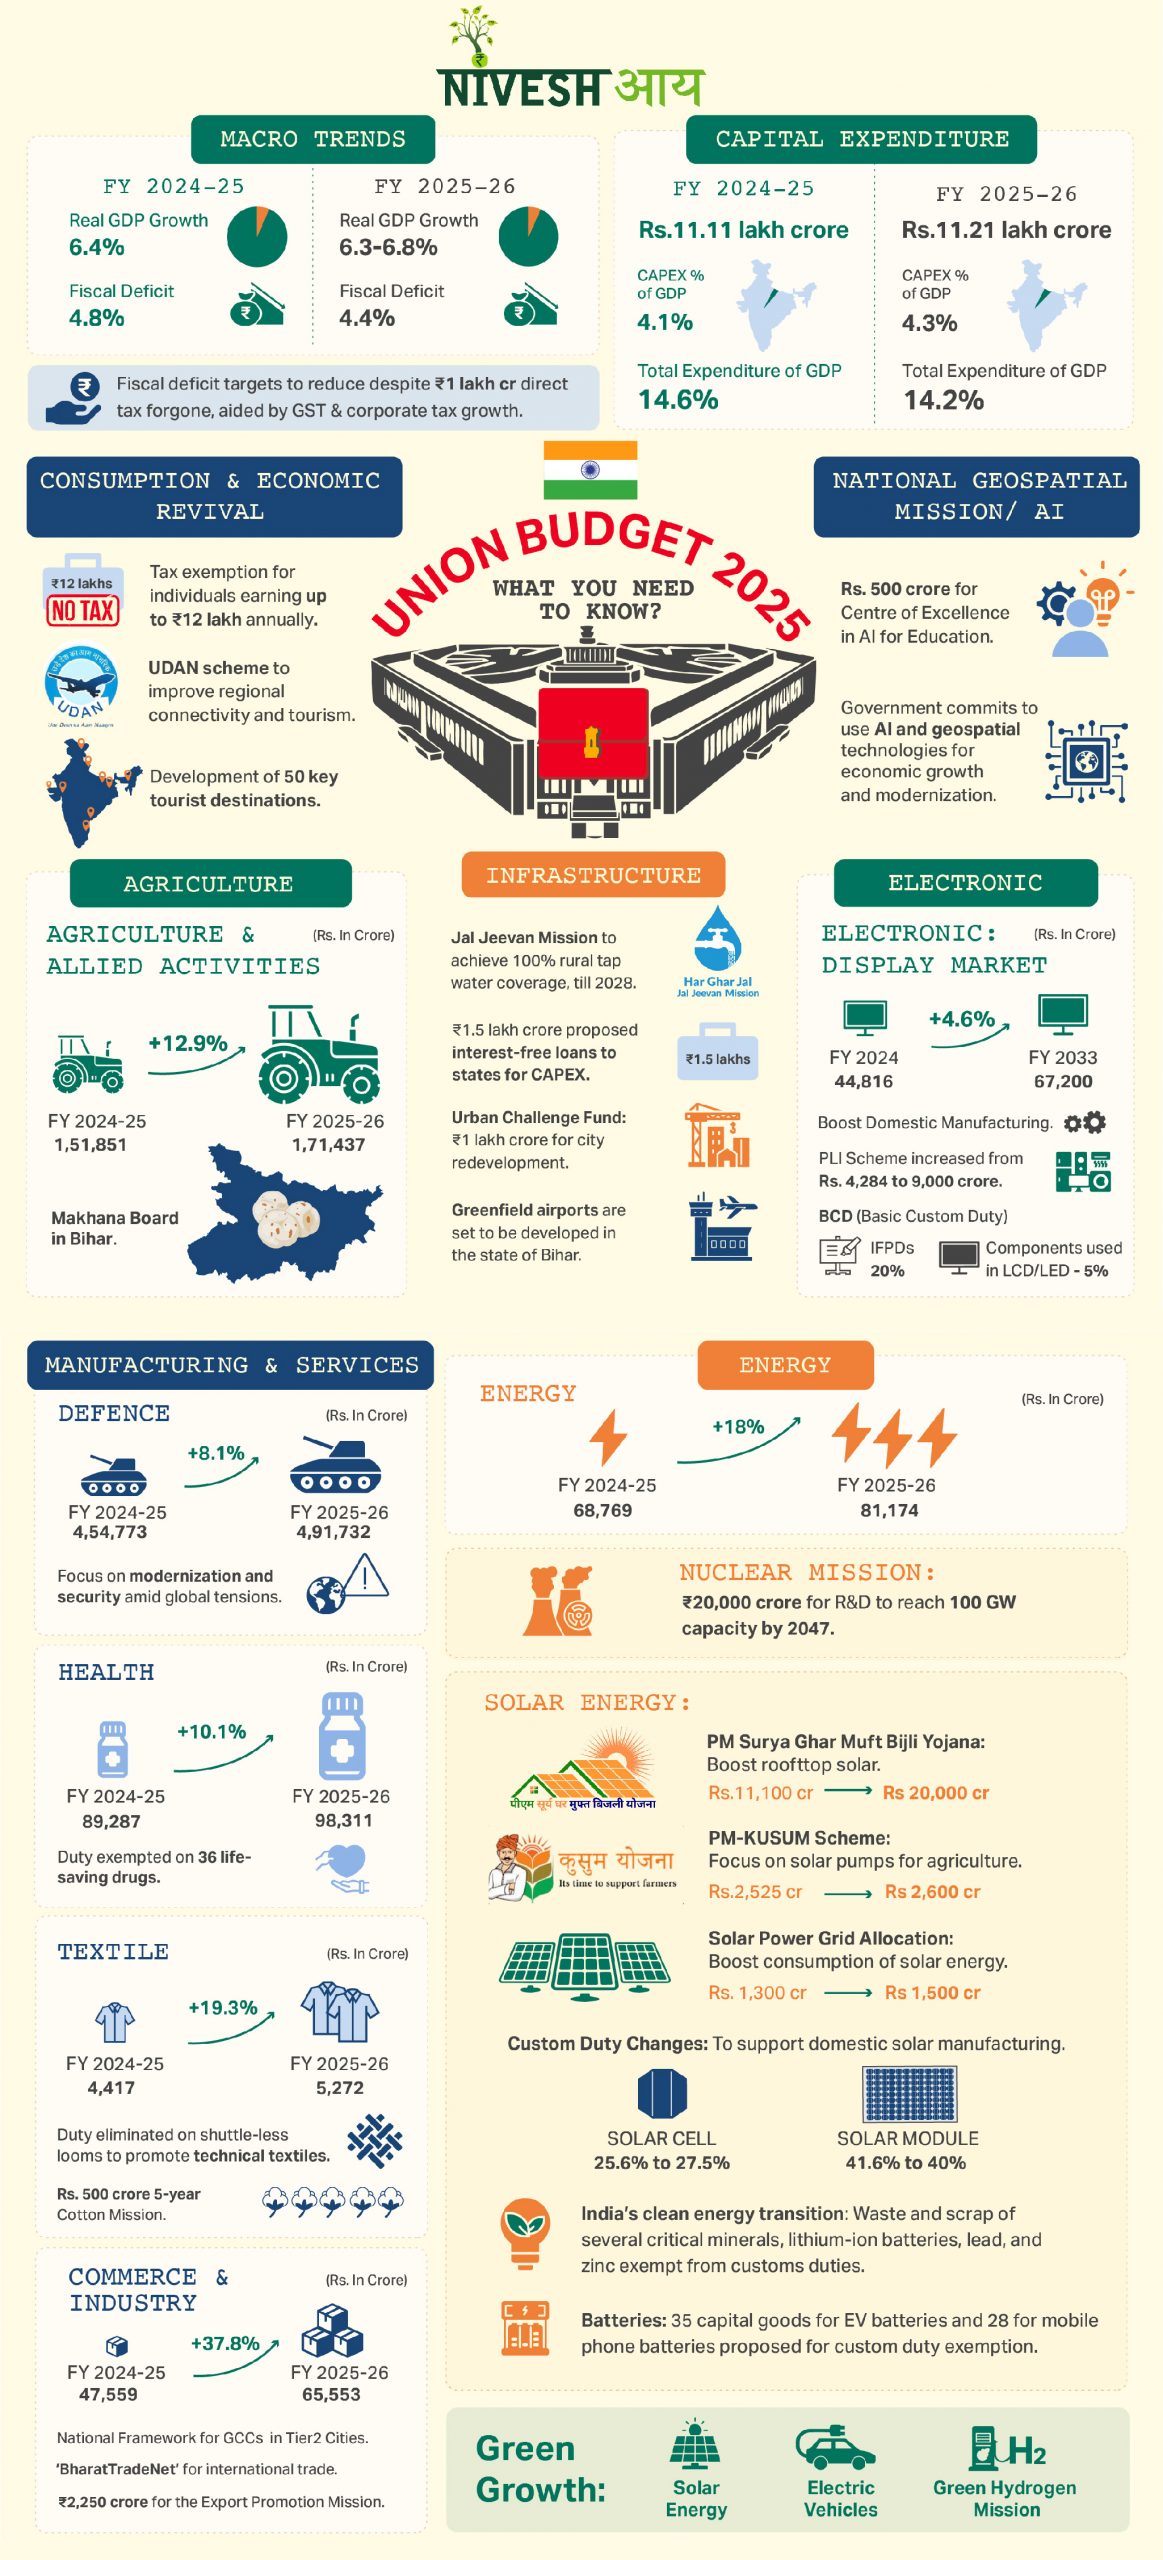
The Union Budget 2025-26 strikes a balance between economic growth, tax relief, and fiscal discipline. From capital expenditure to manufacturing to energy, here’s a crisp overview of this year’s budget priorities. 💰🏗️ You can read our blog for a detailed analysis!
The Union Budget 2025-26 strikes a balance between economic growth, tax relief, and fiscal discipline. From capital expenditure to manufacturing to energy, here’s a crisp overview of this year’s budget priorities. 💰🏗️ You can read our blog for a detailed analysis!
Space Ecosystem
Upcoming Corporate Ecosystem
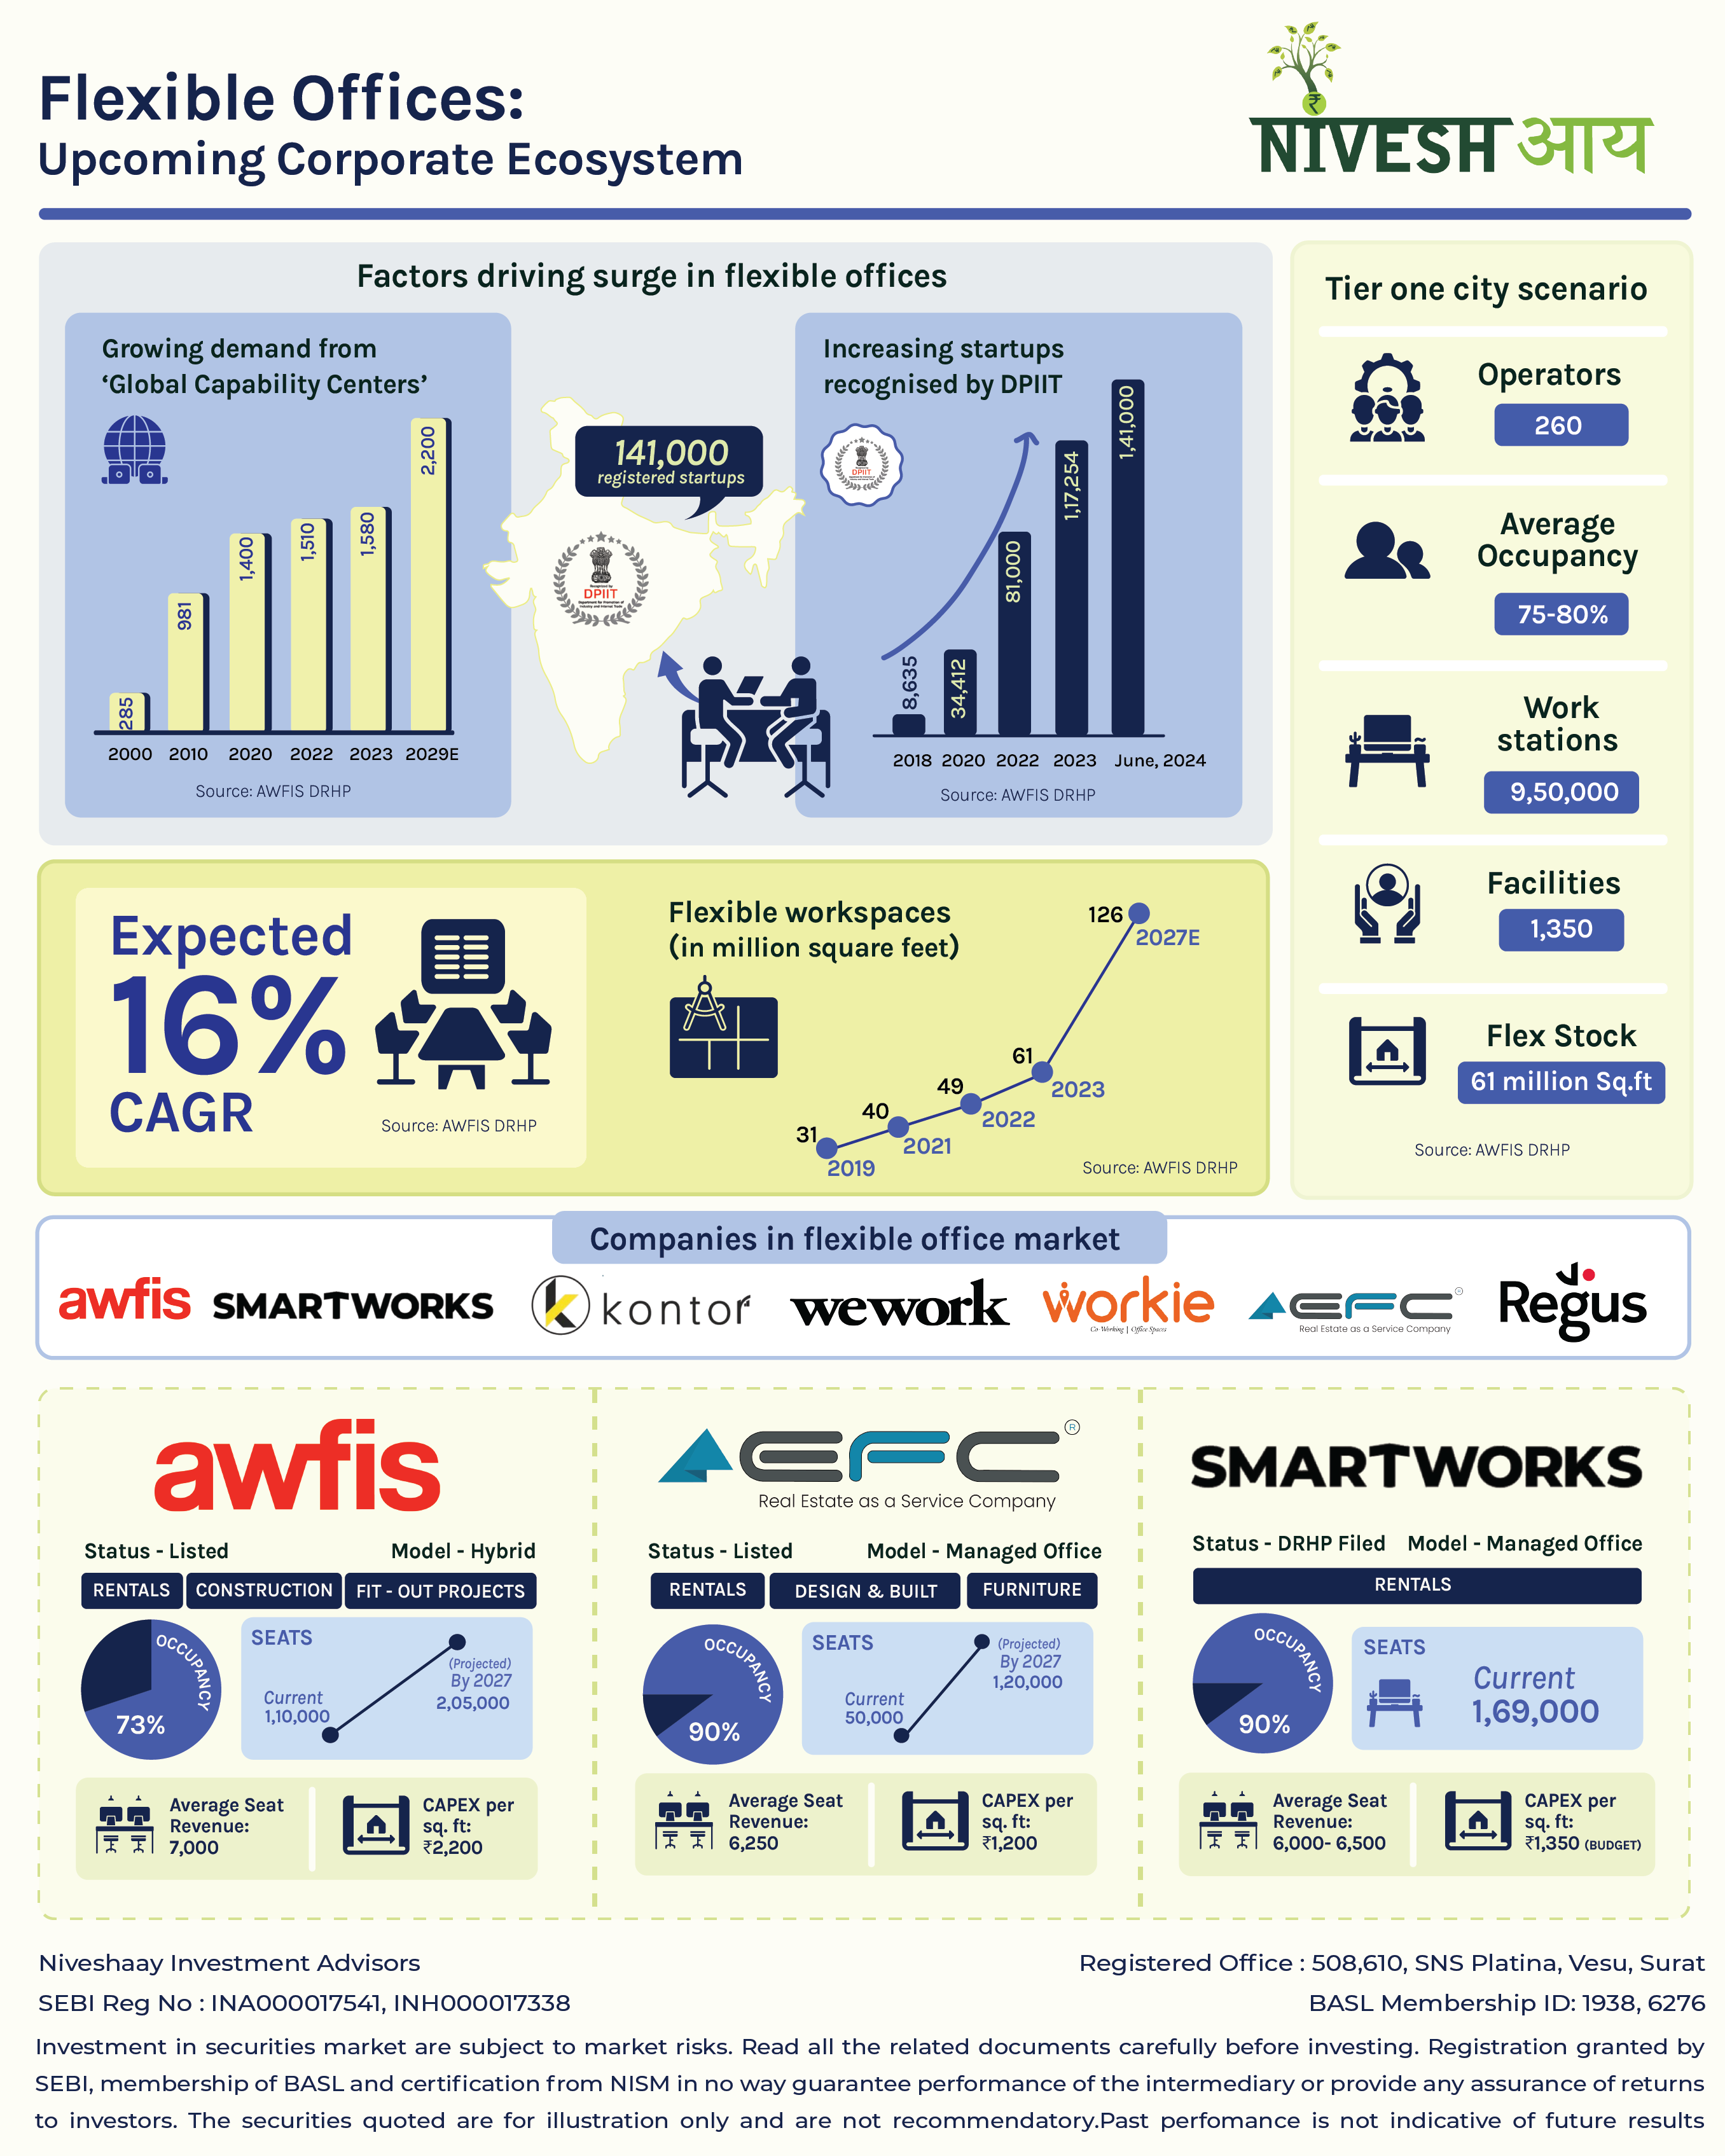
Co-working and flexible spaces are gaining significant momentum in India, largely driven by the increasing number of startups and the growing presence of Global Capability Centers (GCCs). These factors are particularly fueling the demand for more adaptable and cost-effective office solutions, with businesses seeking flexibility, cost optimization, and ease of operations. 💼 While major metro
Co-working and flexible spaces are gaining significant momentum in India, largely driven by the increasing number of startups and the growing presence of Global Capability Centers (GCCs). These factors are particularly fueling the demand for more adaptable and cost-effective office solutions, with businesses seeking flexibility, cost optimization, and ease of operations. 💼 While major metro cities have traditionally dominated the coworking space market, there is now a growing demand in tier-2 and tier-3 cities, making the market more diverse and dynamic.🌆📈
Consumer Durables, Services & Consumption
The Power Distribution Landscape: A Comprehensive Overview
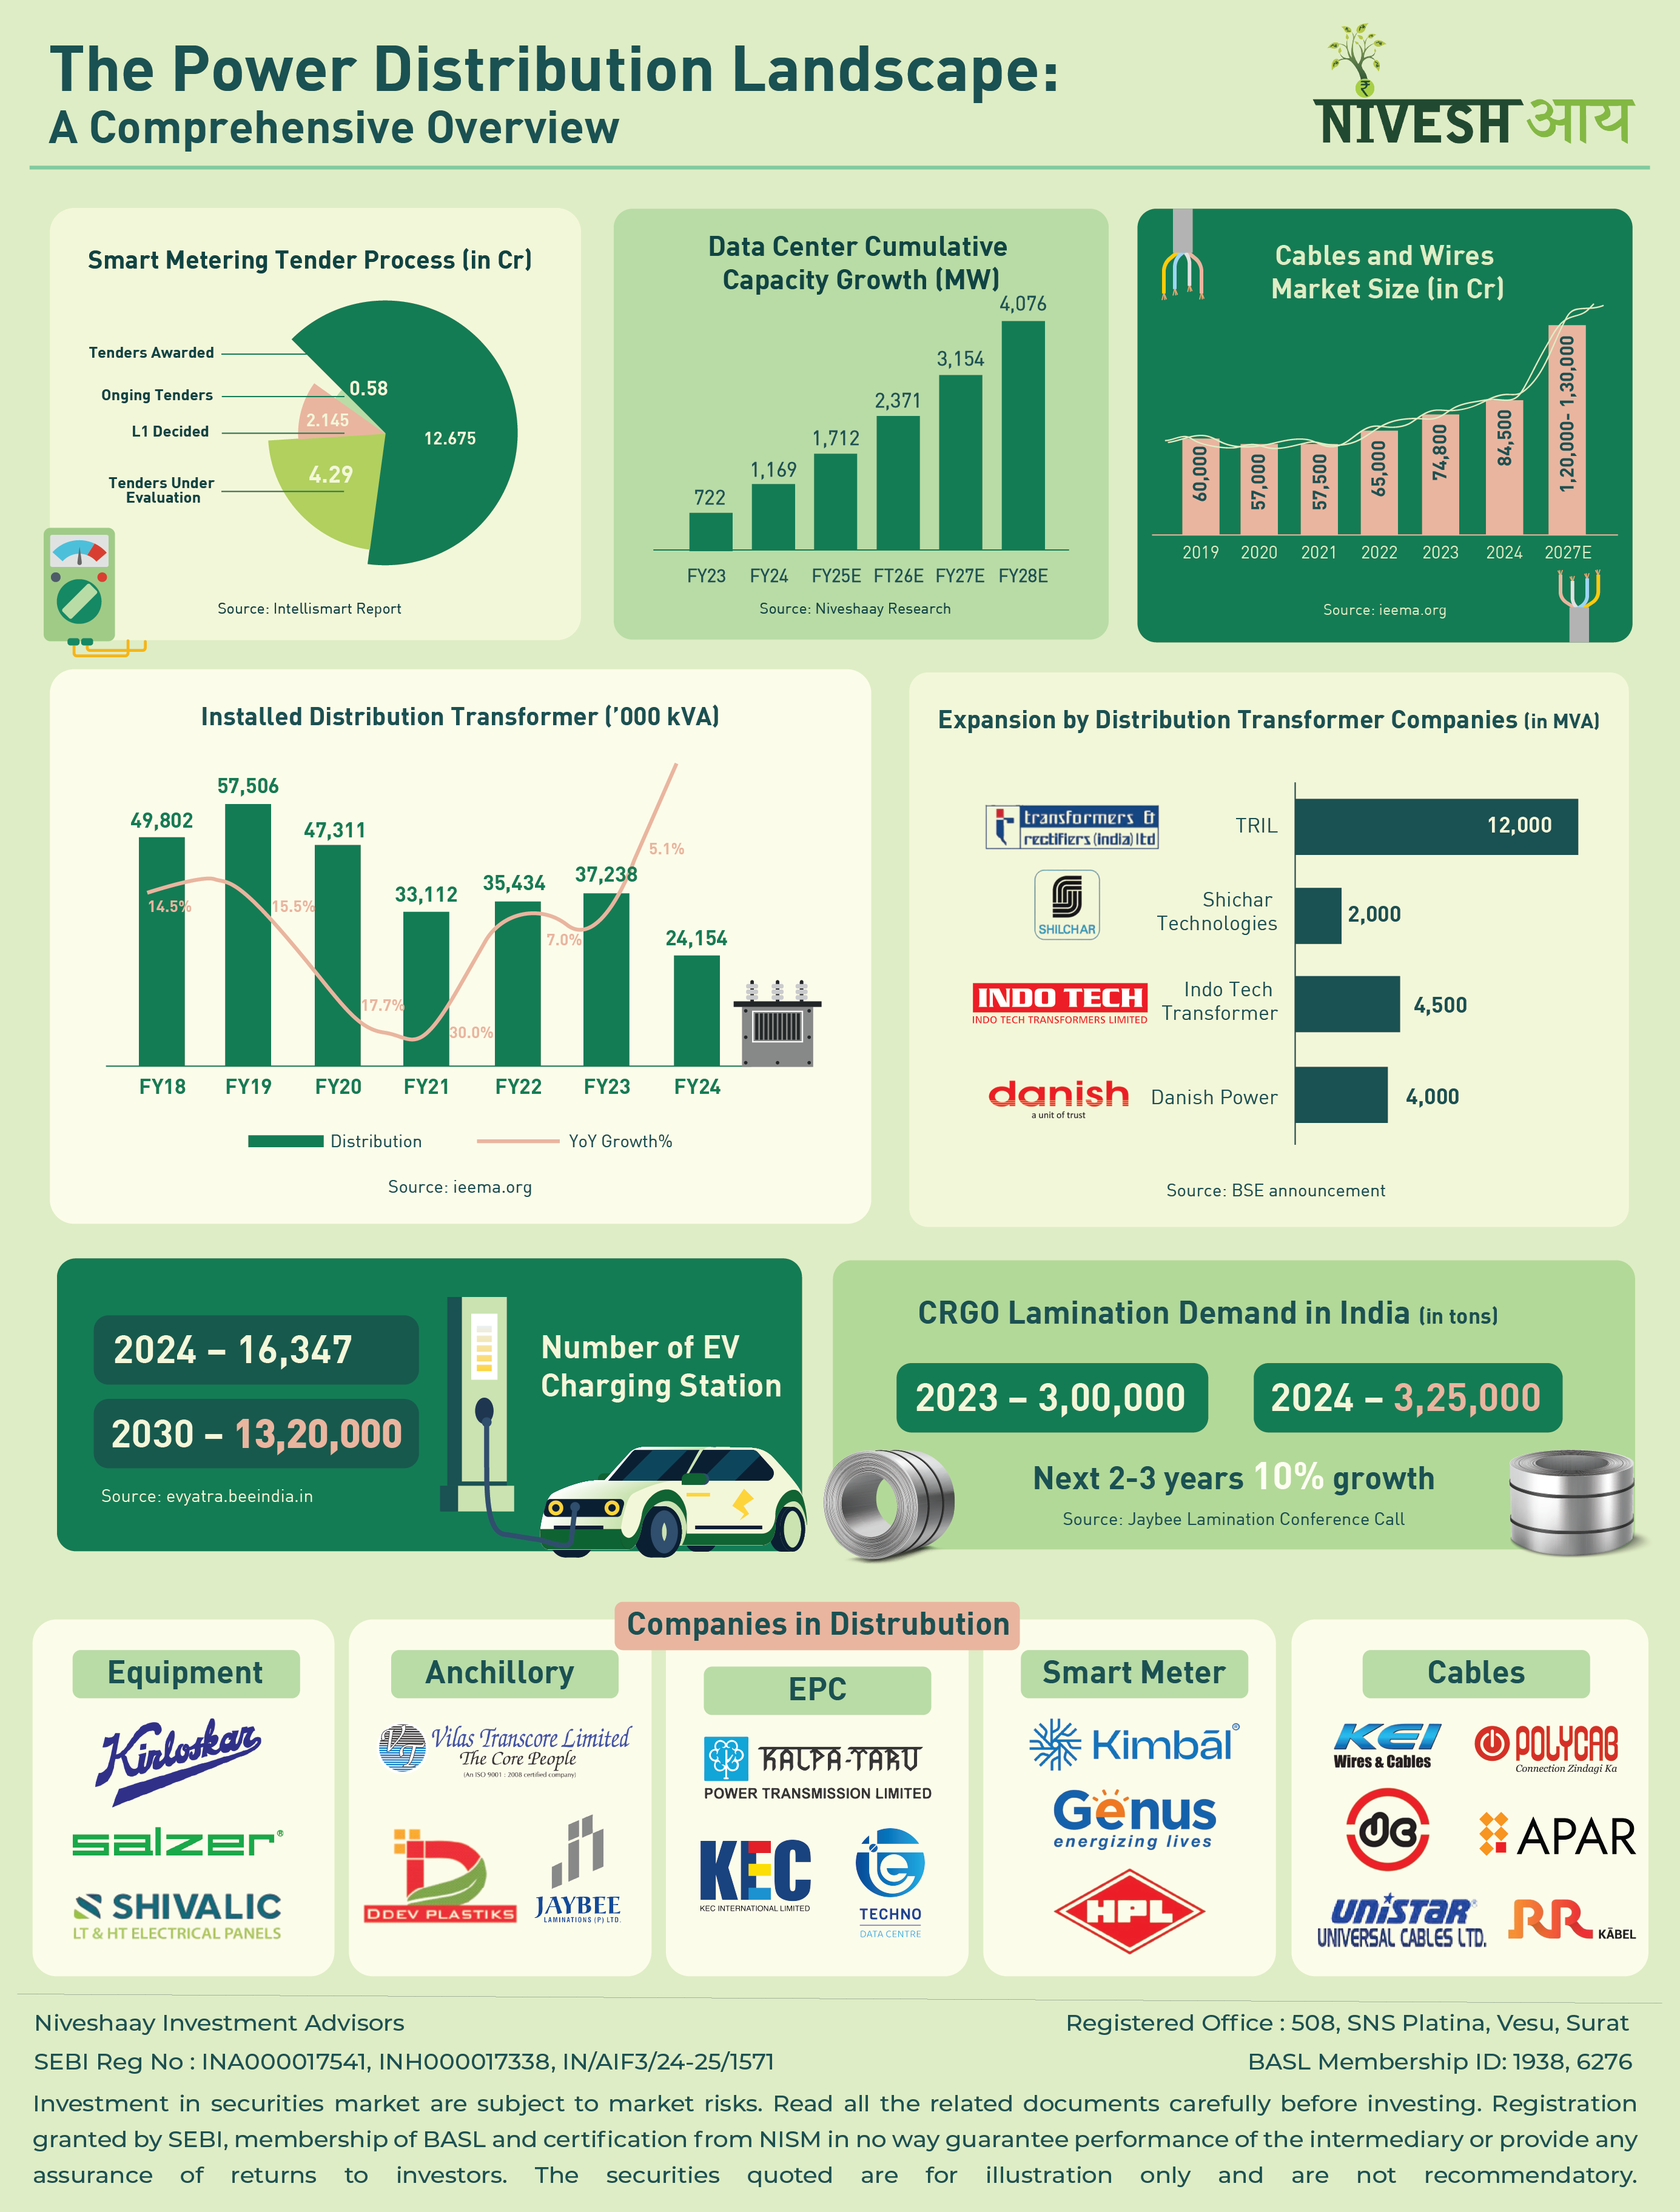
With increasing power generation capacity and significant capex planned on the transmission side, a resilient power distribution network is key to meeting India’s rising electricity demand and ensuring electricity reaches end consumers. As electricity consumption rises, the distribution system must ensure a reliable and uninterrupted supply. ✨ Hence, capex is expected in distribution areas such
With increasing power generation capacity and significant capex planned on the transmission side, a resilient power distribution network is key to meeting India’s rising electricity demand and ensuring electricity reaches end consumers. As electricity consumption rises, the distribution system must ensure a reliable and uninterrupted supply. ✨ Hence, capex is expected in distribution areas such as transformers, switchgear, control panels, and wires, where growth is already visible, paving the way for a more robust and efficient distribution network. 🔌⚡
Power & Renewable Energy
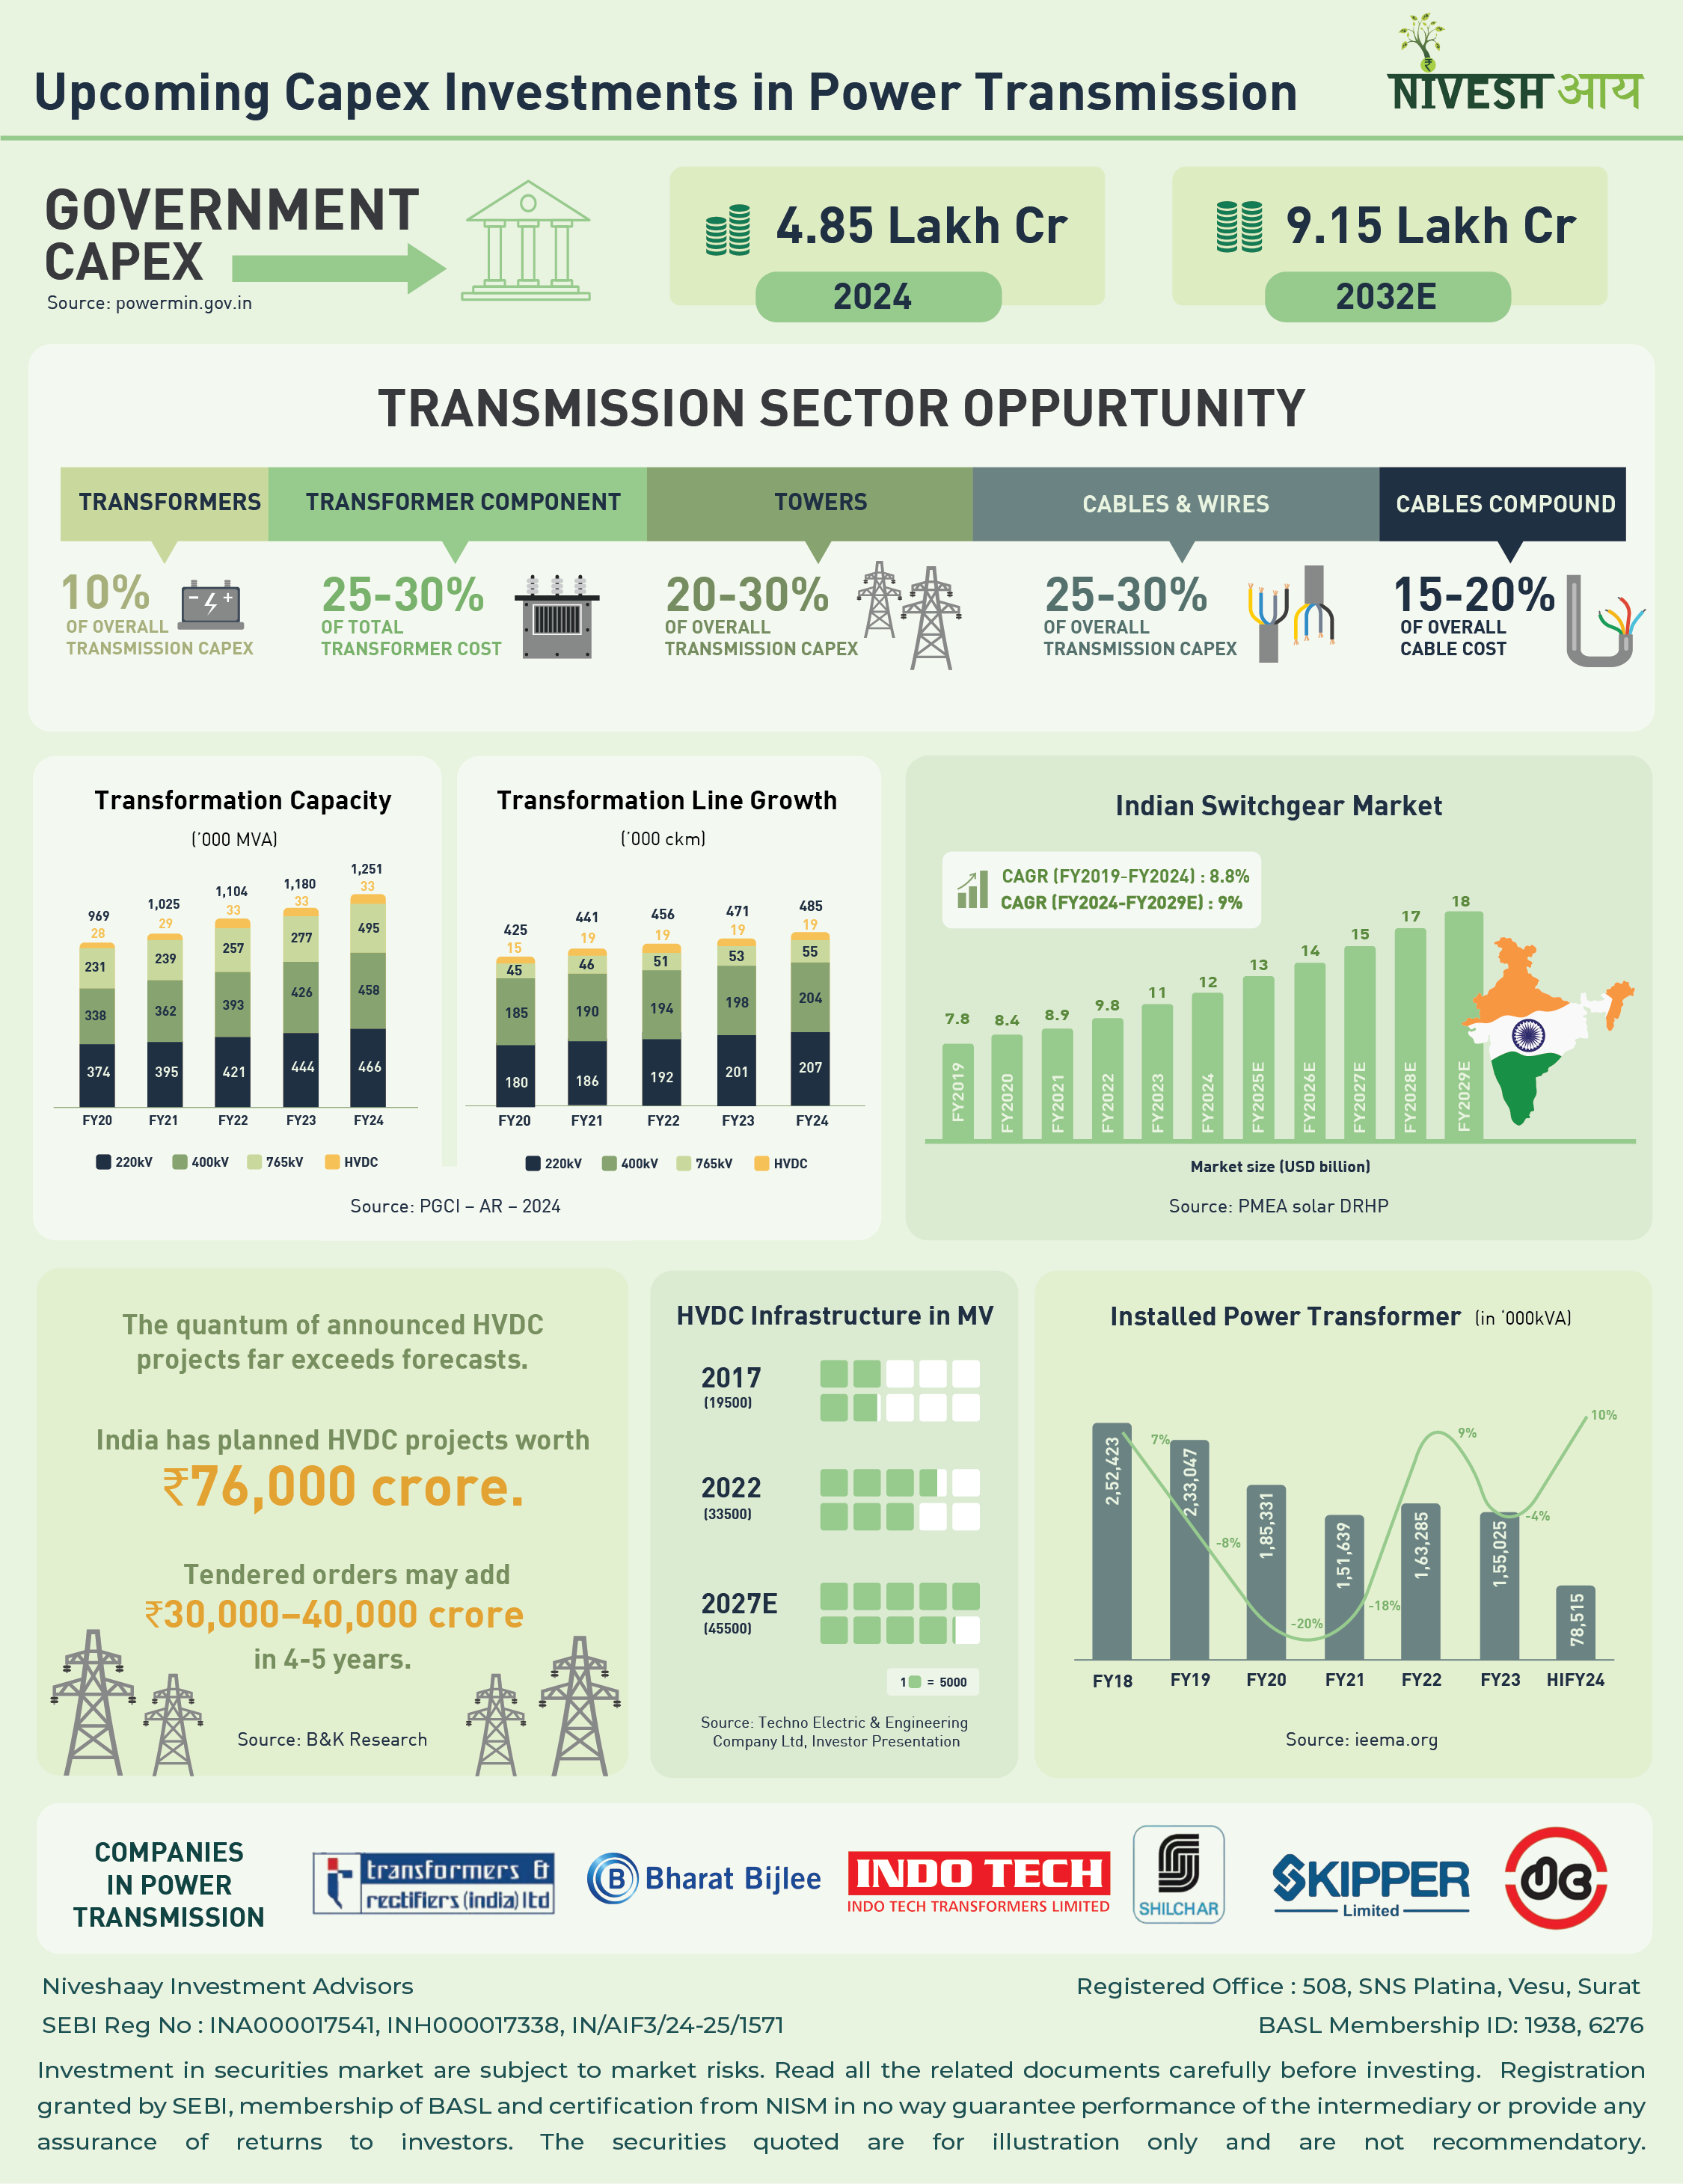
Upcoming Capex in Power Transmission
With increasing installations and generation capacity, India’s grid will need to accommodate these vast additions. ✨ Under the new National Electricity Plan, the transmission network is projected to expand from 485,000 ckt km in 2024 to 650,000 ckt km by 2032, while transformation capacity will rise from 1.25 million MVA to 2.34 million MVA.📈 To
With increasing installations and generation capacity, India’s grid will need to accommodate these vast additions. ✨ Under the new National Electricity Plan, the transmission network is projected to expand from 485,000 ckt km in 2024 to 650,000 ckt km by 2032, while transformation capacity will rise from 1.25 million MVA to 2.34 million MVA.📈 To achieve this, the power transmission sector is set for massive expansion, with an estimated ₹9 lakh crore investment expected by 2032.
Power & Renewable Energy
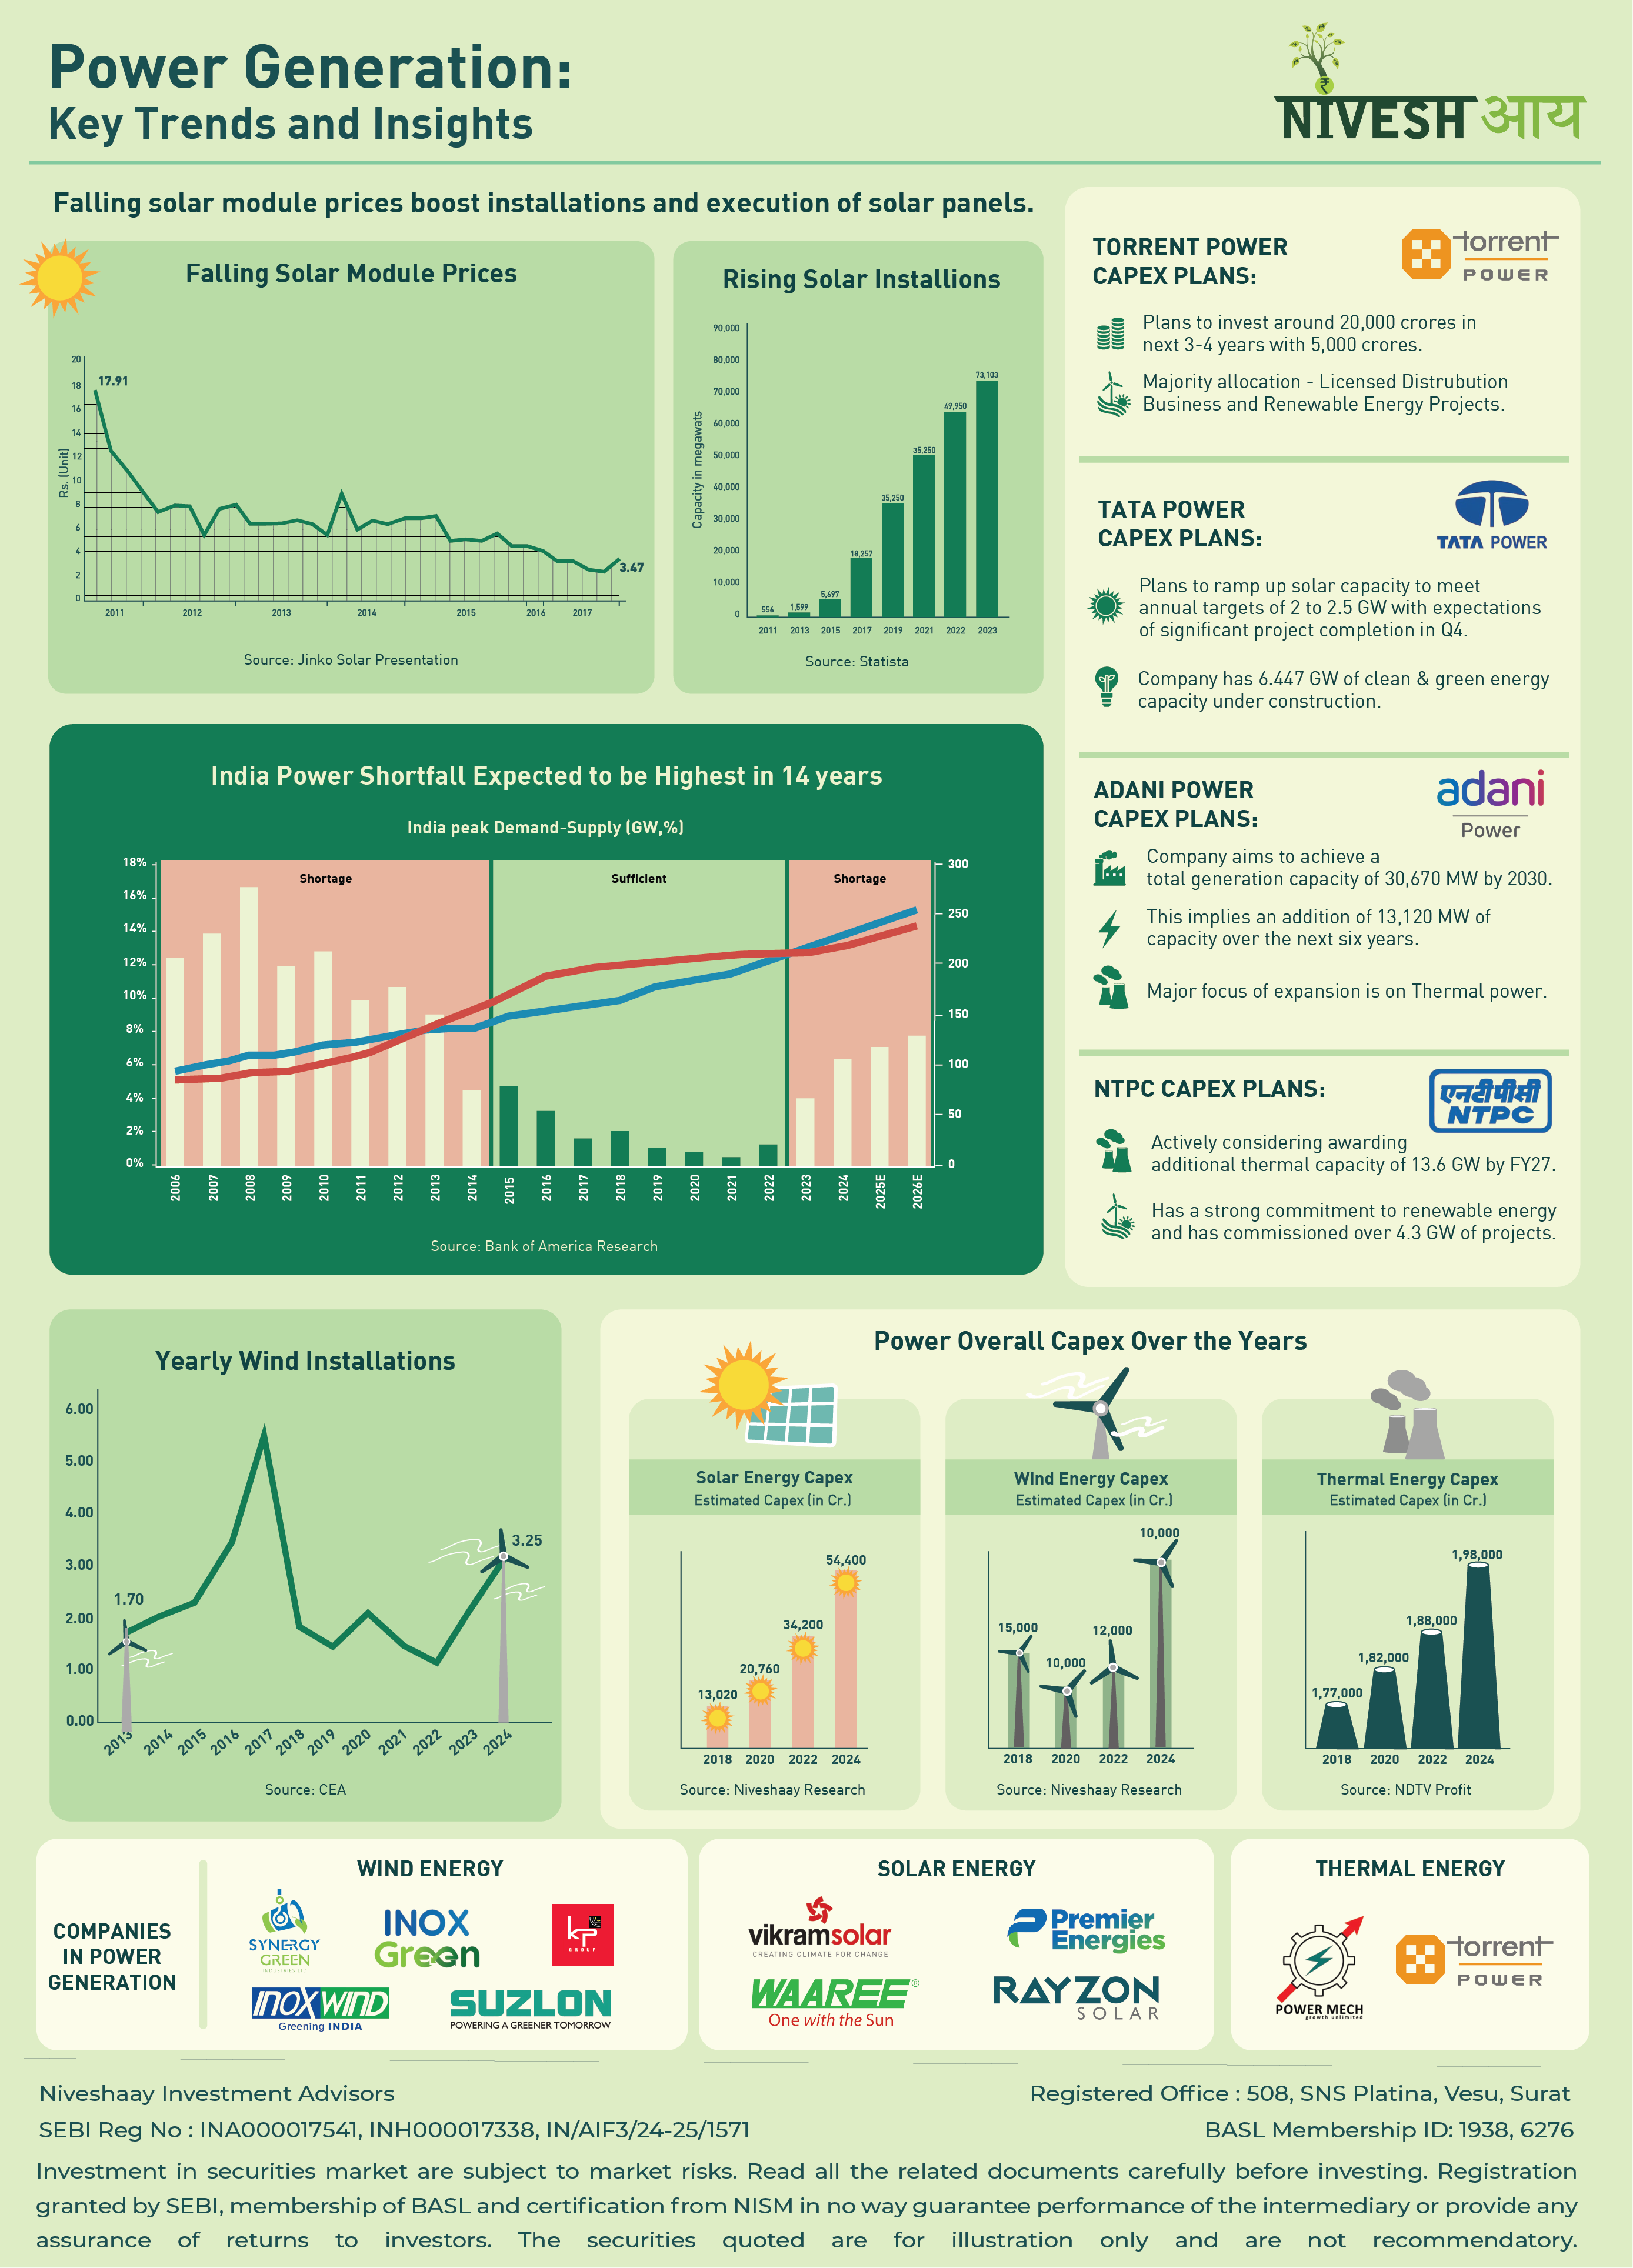
Power Generation: Key Trends and Insights
India's electricity generation capacity has grown by 80% in the past decade, reaching 446.18 GW as of June 2024, making it the third-largest producer and consumer globally.✨ To meet rising demand, major players are scaling up their capacity to increase their generation capacity, a trend clearly reflected in the growing investments across different power generation
India's electricity generation capacity has grown by 80% in the past decade, reaching 446.18 GW as of June 2024, making it the third-largest producer and consumer globally.✨ To meet rising demand, major players are scaling up their capacity to increase their generation capacity, a trend clearly reflected in the growing investments across different power generation sources such as solar, wind, and thermal.📈
Power & Renewable Energy
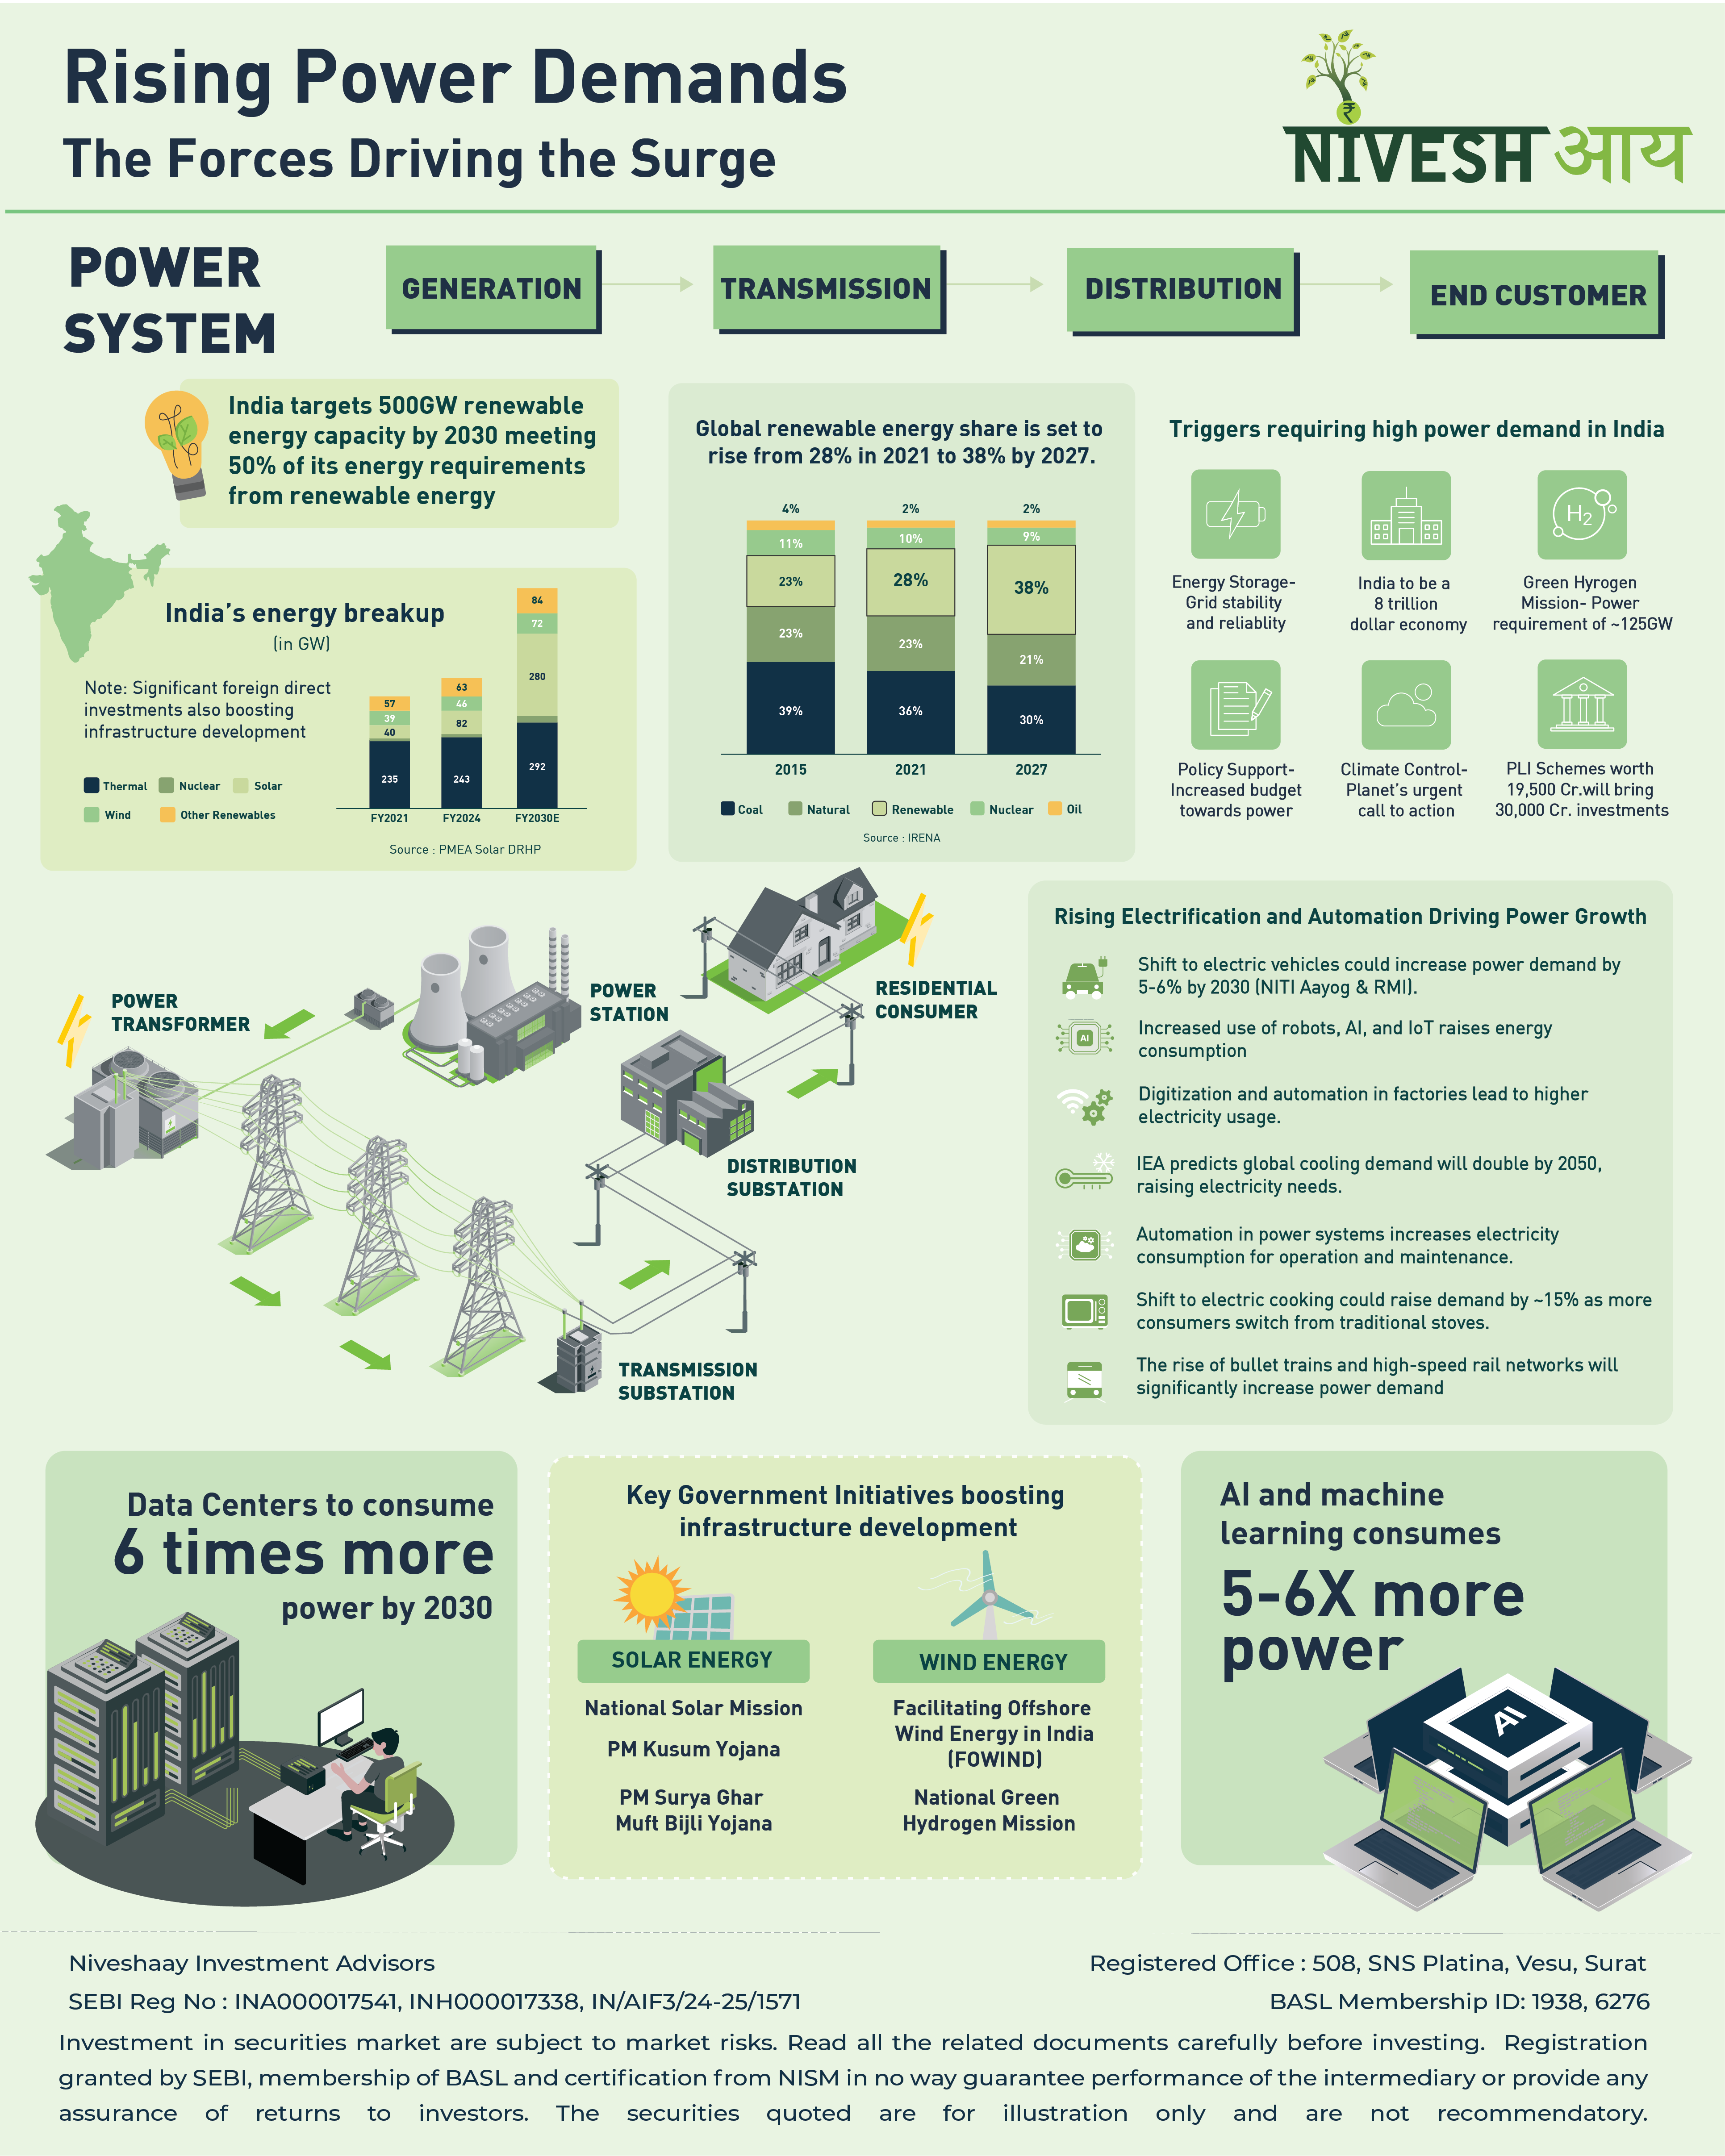
Rising Power Demand
As the demand for energy continues to rise, substantial capital investments are expected across the entire power cycle—from generation to transmission and distribution. 📈 With India’s energy demand projected to grow at 5.5% in FY25, various factors are fueling this surge, from industrial expansion to the rise in electric mobility and digitalization. Alongside this power
As the demand for energy continues to rise, substantial capital investments are expected across the entire power cycle—from generation to transmission and distribution. 📈 With India’s energy demand projected to grow at 5.5% in FY25, various factors are fueling this surge, from industrial expansion to the rise in electric mobility and digitalization. Alongside this power demand surge, the share of renewable energy is also set to grow, driving towards a more sustainable energy future. 📈

Electronic Manufacturing Services
India’s Private Equity Boom: Minting Gold in the Goldilocks Phase
“The rich get richer, not by hoarding their wealth, but by investing in opportunities that create more wealth.”~ A Smart Investor India’s economy has witnessed a robust recovery from the Covid hit and we continue to grow at a favourably stout growth rate. This stout pace of growth has landed India into a unique phase,
“The rich get richer, not by hoarding their wealth, but by investing in opportunities that create more wealth.”~ A Smart Investor
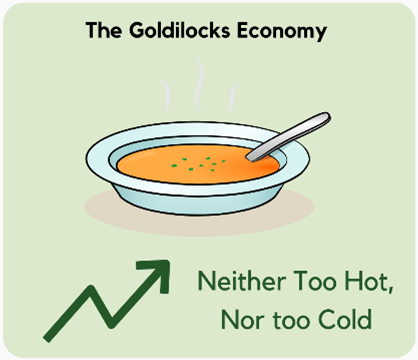
India’s economy has witnessed a robust recovery from the Covid hit and we continue to grow at a favourably stout growth rate. This stout pace of growth has landed India into a unique phase, which many renowned economists globally have been naming “The Goldilocks phase.”
What is the Goldilocks phase? It refers to a phase of sustained growth with favorable economic performance during which enormous wealth creation opportunities emerge in an economy. Every developed country has witnessed the Goldilocks phase during their development years, for instance – in the US during the 1990s – the economy grew by over 50% in the Goldilocks decade, China from 2006 to early 2017 the economy more than quadrupled during this period, etc.
Many amongst the smart population seem to have identified this occasion way ahead of most economists, and their actions suggest that they have already started minting wealth from this emerging golden scenario.
In this economic backdrop, one such popular asset class that offers strong wealth-creation opportunities is the Private Equity Market. Private markets in India have been growing and this growth is being led by higher inflows from the wealthy population.
In this blog, we will be highlighting the key factors driving the Indian private equity markets and why is it being preferred over traditional asset classes –
Firstly, what are Private Equity (PE) investments?
Private Equity (PE) is a form of investment where funds are directly invested into private companies. This type of investment is usually conducted by private equity firms, venture capital firms, or angel investors.
Certain key Characteristics of Private Equity investments are:
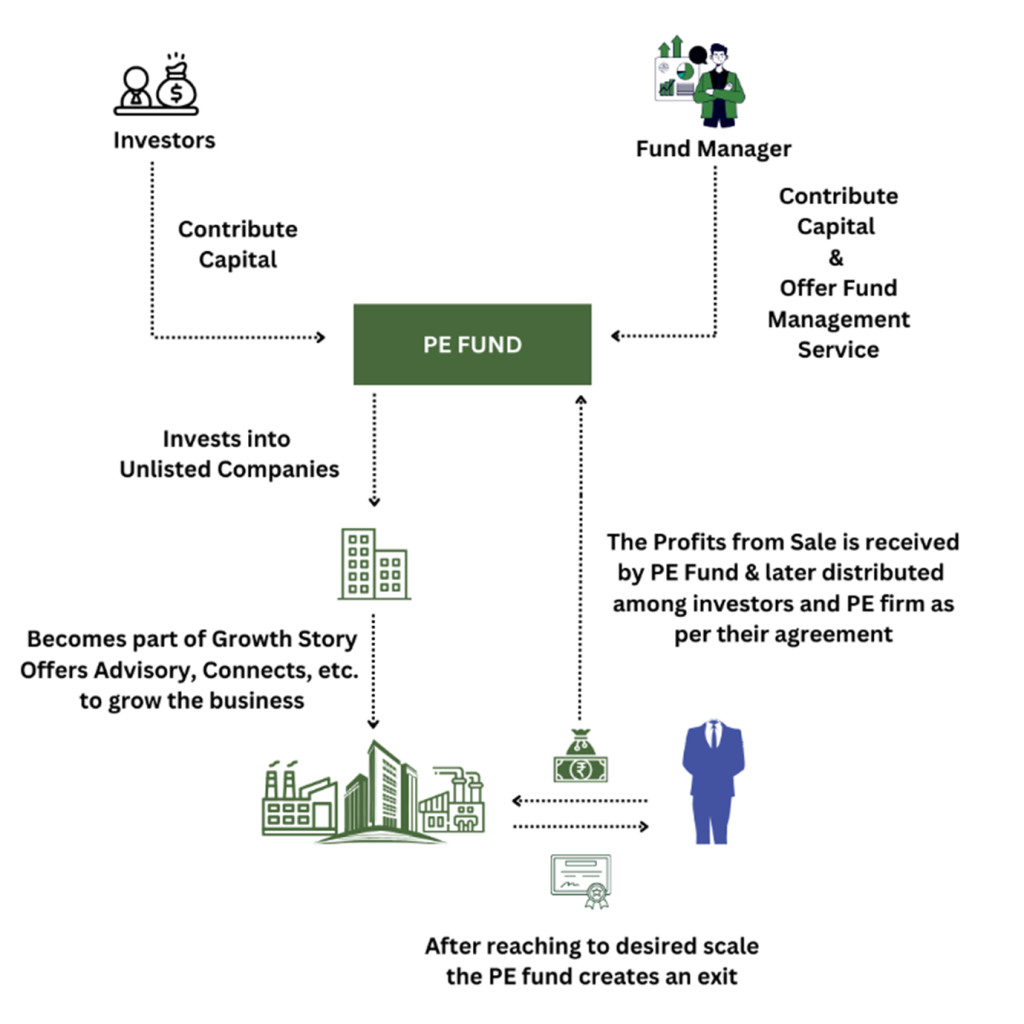
How Private Equity Works?
Benefits and Risks
Benefits:
Risks:
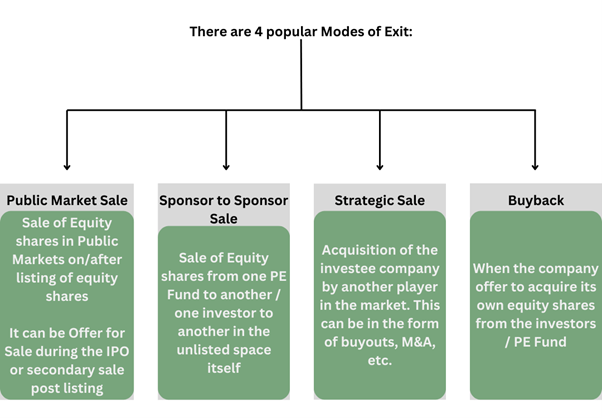
Why exit is so important & Why do need a fund manager for exit?
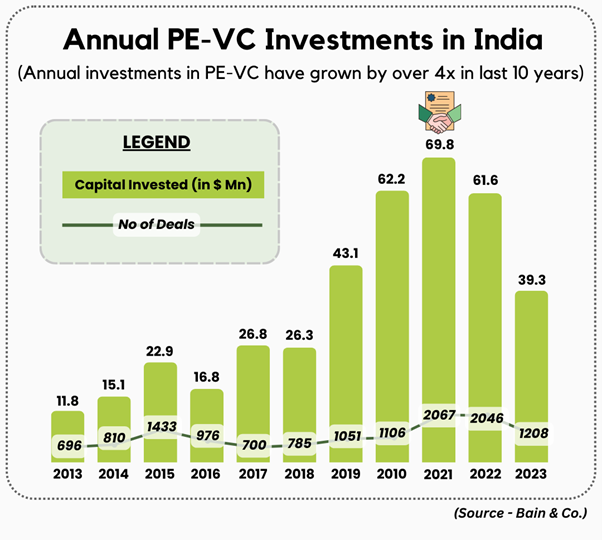
What’s Driving PE in India?
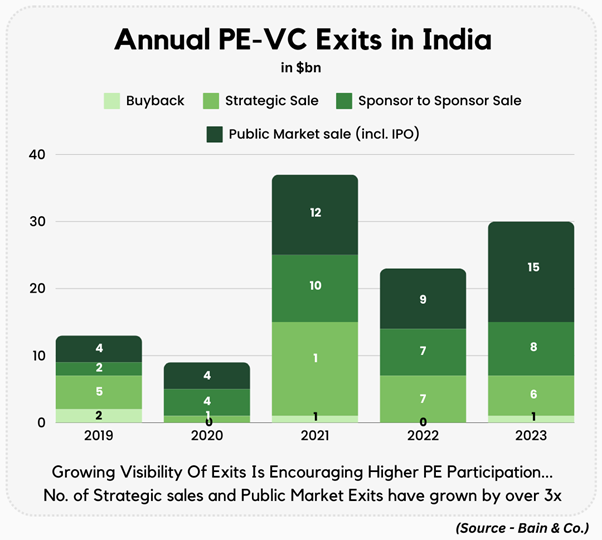
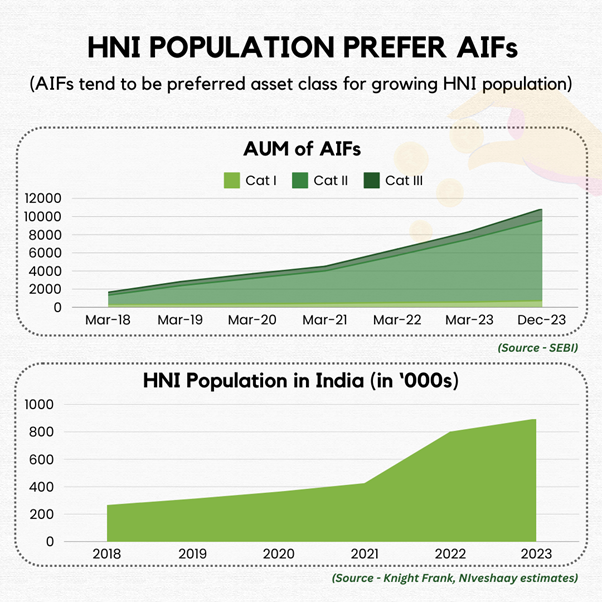
Some Key factors driving the growth of PE market in India are:
How can Niveshaay help you in planning your PE investments?
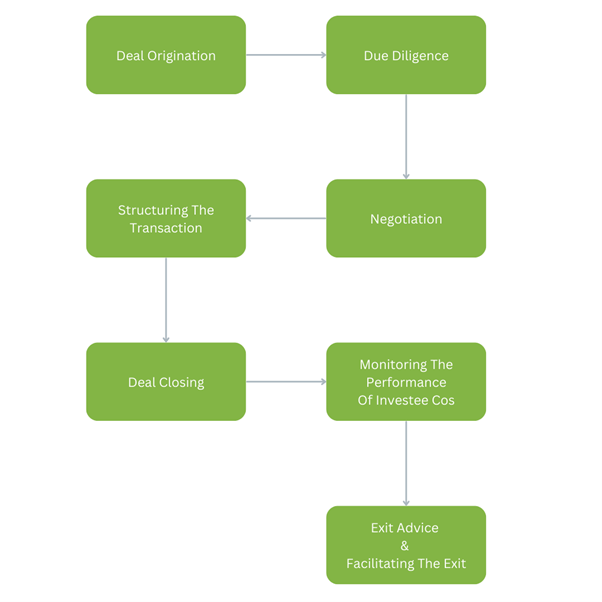
Niveshaay offers end-to-end fund management solutions in the PE space – right from deal origination to curating lucrative exits for our investors. We help our clients in their wealth creation journey by structuring the right mix of listed and unlisted opportunities.
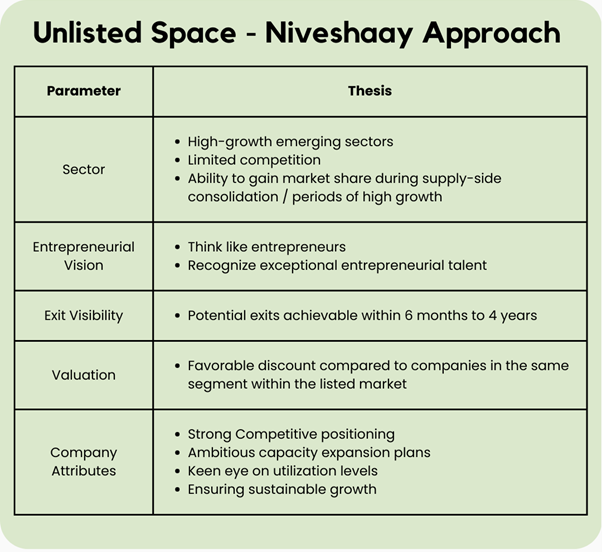
Our key strength lies in our approach in the unlisted markets. Our approach allows us to identify strong entrepreneurs in industries that are witnessing healthy tailwinds.
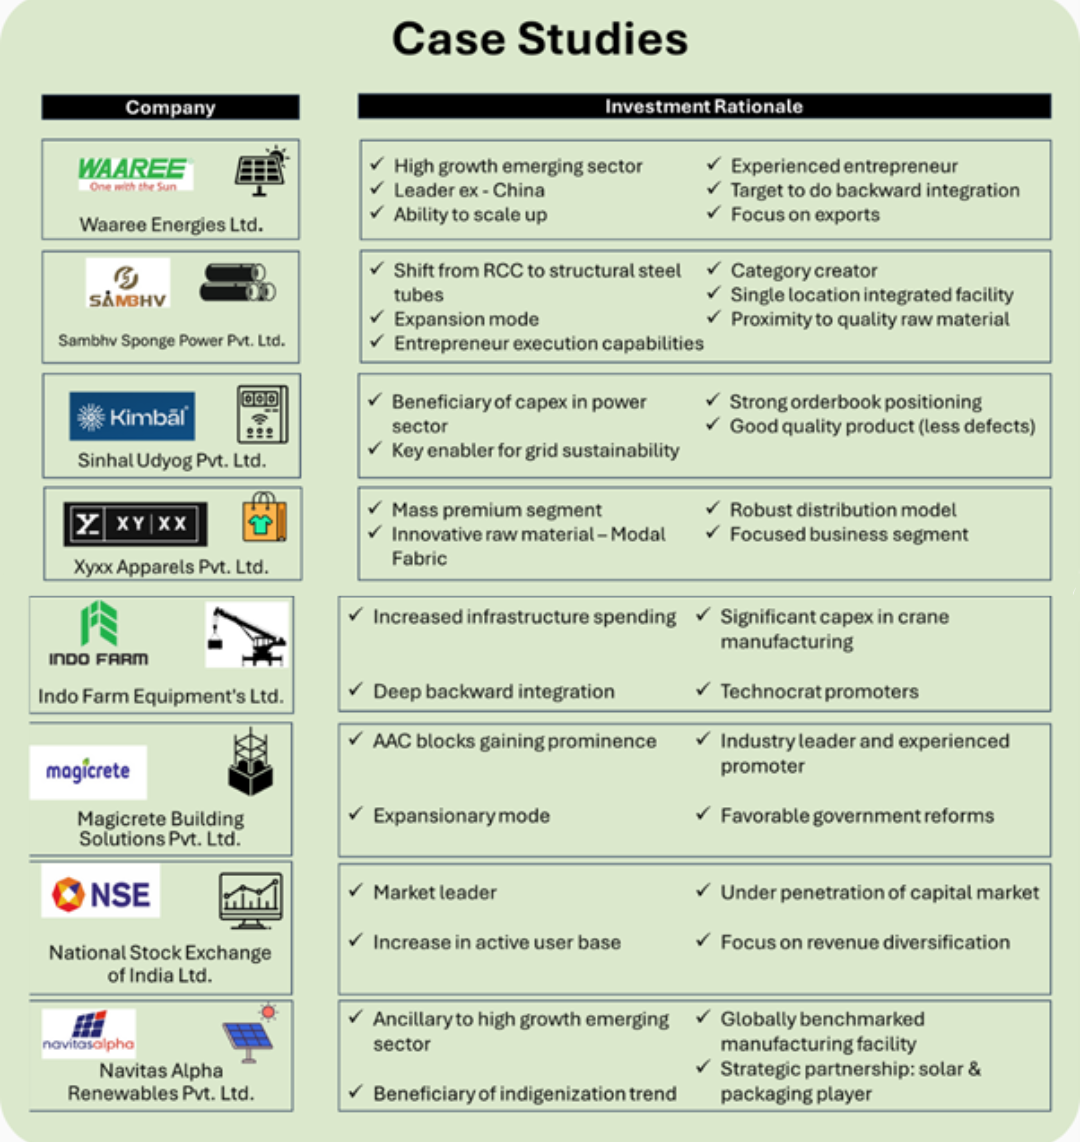
Over the years, we have successfully structured multiple deals with industry leaders such as Waaree Energies Ltd, Sambhav Steel Pipes Ltd, Sinhal Udyog Pvt Ltd (Kimbal), XYXX Apparels Pvt Ltd, Magicrete etc.
We have recently introduced our two AIFs (Alternative Investment Funds)
In conclusion, India's private equity market is booming, driven by growing AIF investments, an increasing population of HNWIs and UHNWIs, and attractive opportunities beyond the overheated public markets. The improved visibility of exits and rising investments in traditional sectors further enhance its appeal. This unique phase positions private equity as a significant avenue for wealth creation in India's growing economy.
Hope you enjoyed this blog! Get in touch with our team for more information on our unlisted space opportunities. Contact details are provided in the Contact Us section on our website – www.niveshaay.com.
Happy Investing!
Disclaimers and Disclosures
SEBI Registration No. :INH000017338, IN/AIF3/24-25/1571, IN/AIF2/24-25/1607 | BASL Membership ID: 6276
Investment in Securities Market are subject to market risks. Read all related documents carefully before investing. The securities quoted are for illustration only and are not recommendatory. Registration granted by SEBI, membership of a SEBI recognized supervisory body (if any) and certification from NISM in no way guarantee performance of the intermediary or provide any assurance of returns to investors.
Specialty Chemicals
Sprouting Profits : The Boom in India’s Agrochemical Sector
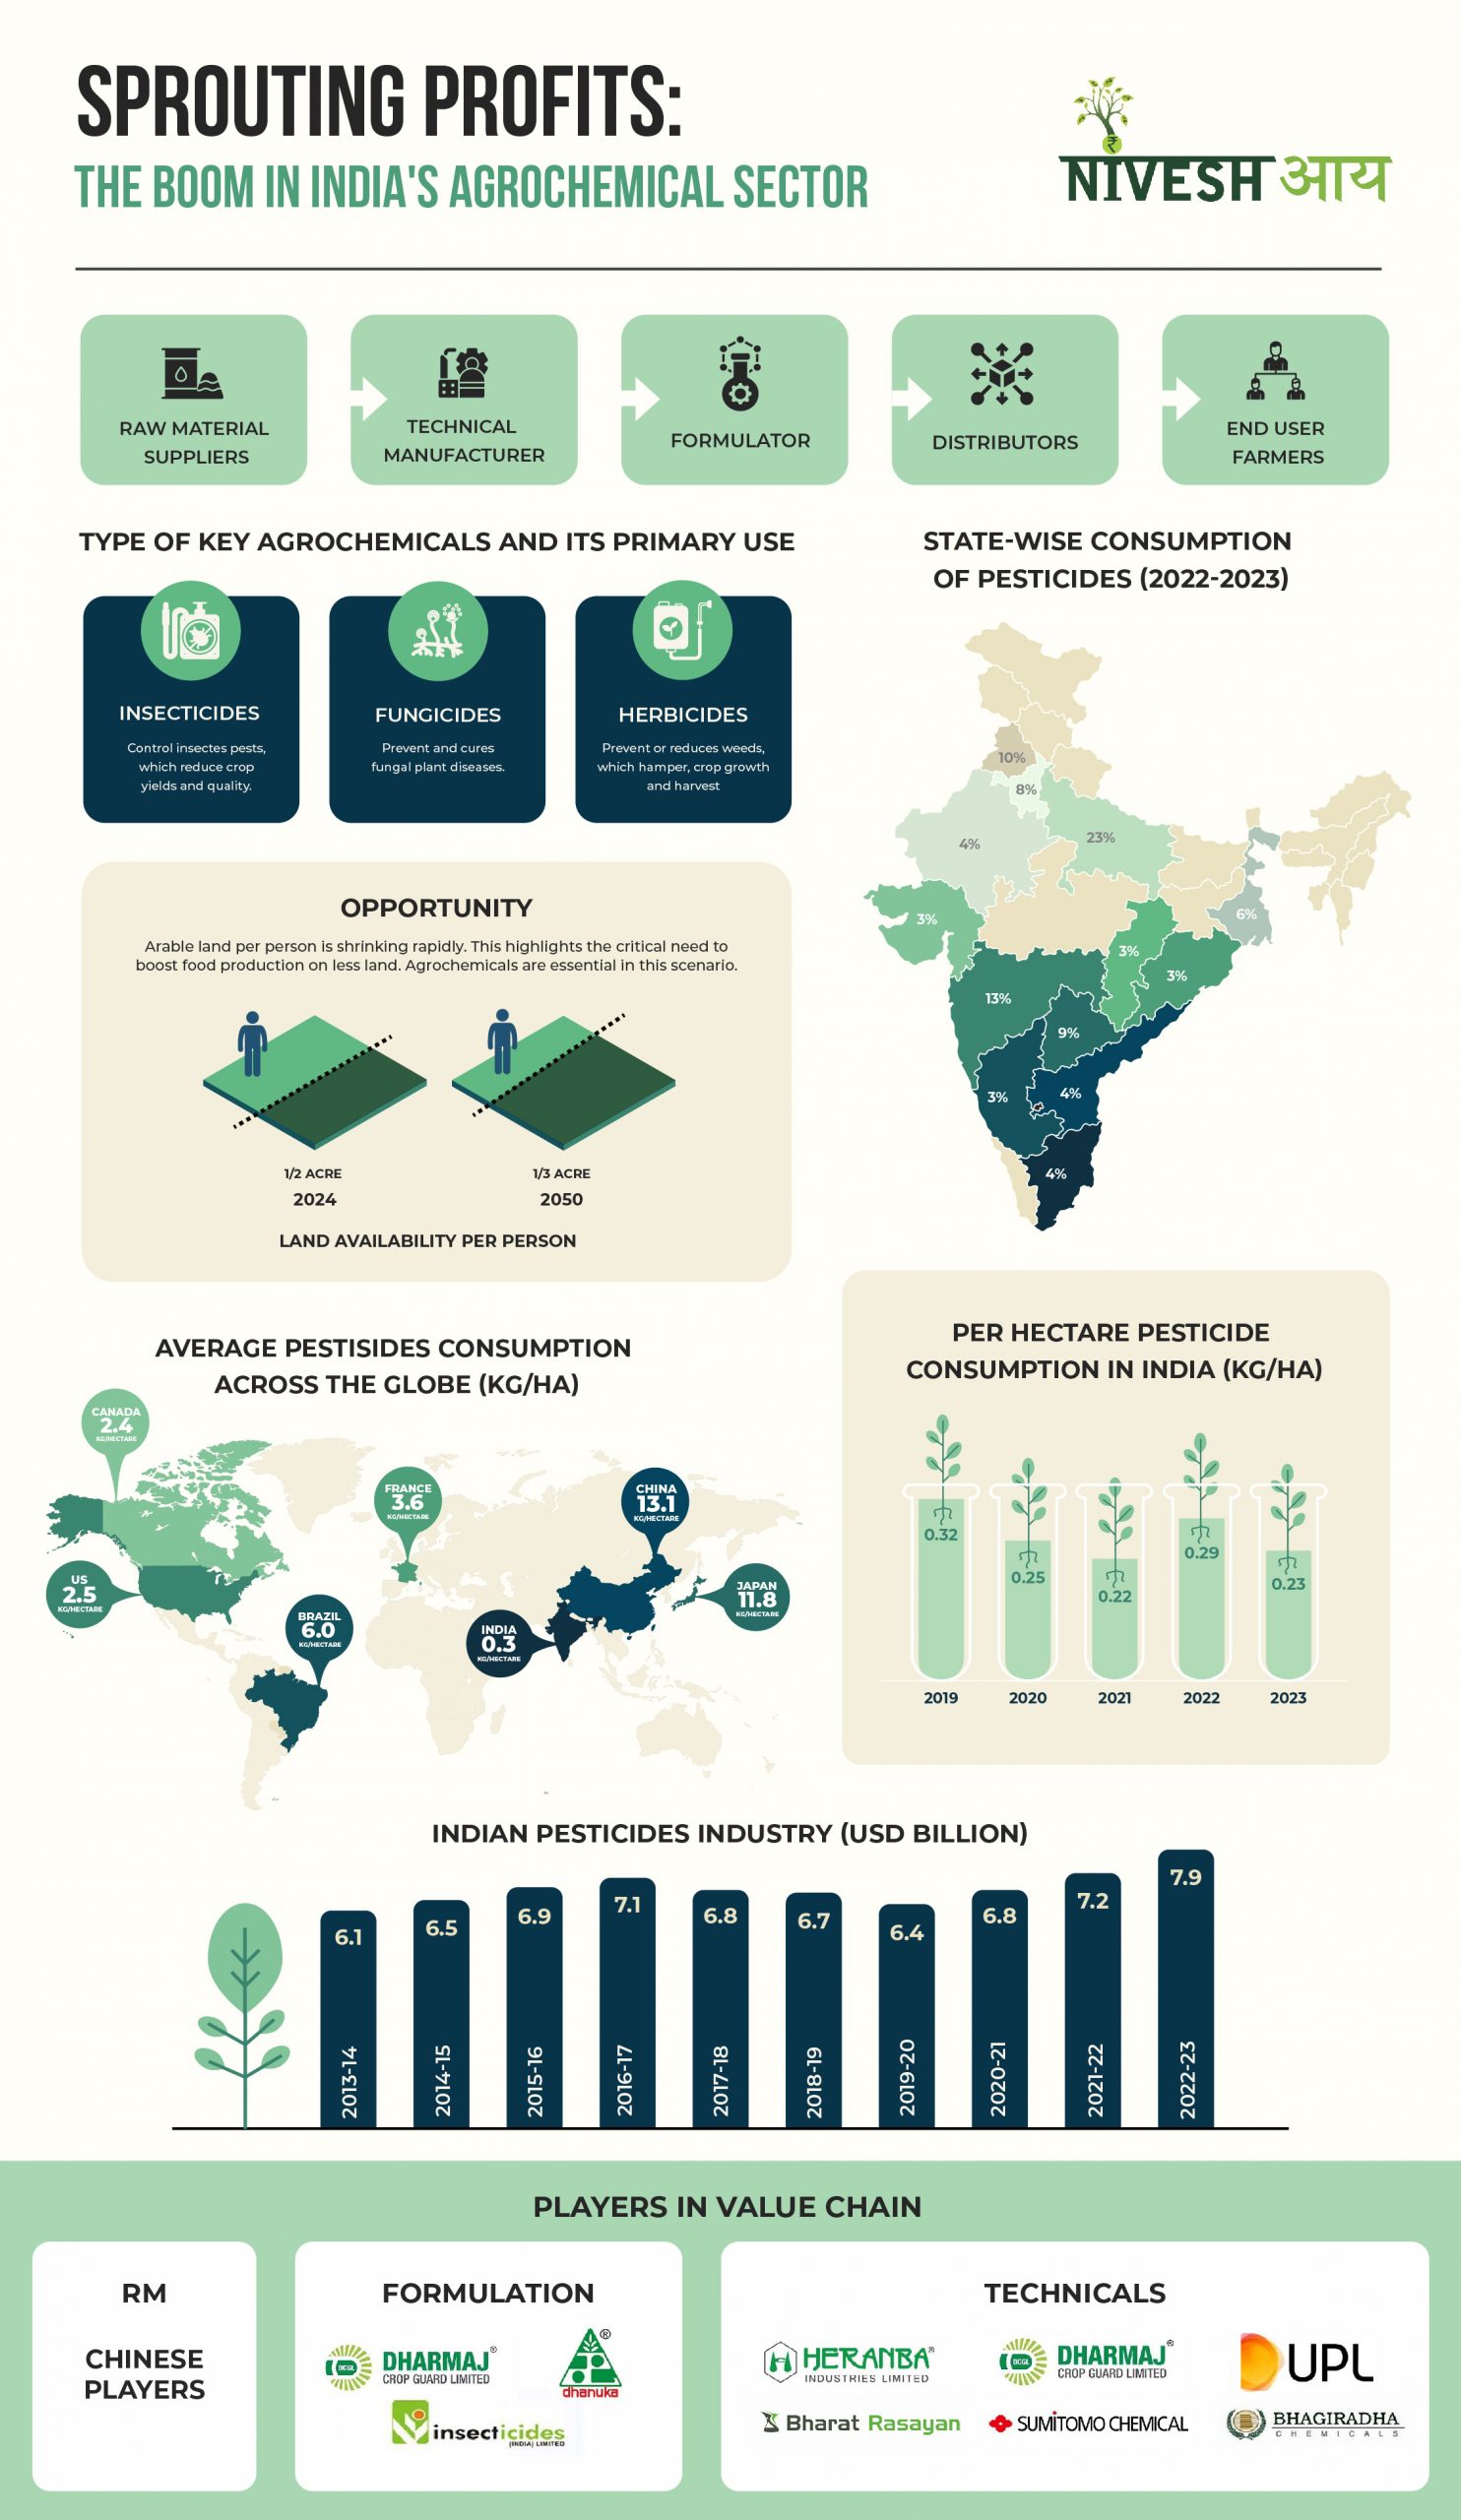
India's agrochemical industry, one of the largest globally, is projected to grow at an 8-10% CAGR in the coming years. As the global population rises and arable land declines, agrochemicals play a crucial role in boosting crop yields and addressing food insecurity, which currently impacts nearly 10% of the world's population. 🌱
India's agrochemical industry, one of the largest globally, is projected to grow at an 8-10% CAGR in the coming years. As the global population rises and arable land declines, agrochemicals play a crucial role in boosting crop yields and addressing food insecurity, which currently impacts nearly 10% of the world's population. 🌱

Pharmaceuticals
Sprouting Profits: Why India’s Agrochemical Industry is Ready to Bloom
"Agrochemicals are not just products; they are catalysts for change in agriculture. They help farmers overcome challenges and contribute to our nation's self-sufficiency and prosperity." – Uday Kotak, Founder & CEO, Kotak Mahindra Bank Agriculture: The Heartbeat of India’s Economy Agriculture is not just a sector; it's the lifeblood of India providing livelihoods for over half
"Agrochemicals are not just products; they are catalysts for change in agriculture. They help farmers overcome challenges and contribute to our nation's self-sufficiency and prosperity." – Uday Kotak, Founder & CEO, Kotak Mahindra Bank
Agriculture: The Heartbeat of India’s Economy
Agriculture is not just a sector; it's the lifeblood of India providing livelihoods for over half the population and contributes about 18% to the nation's GDP. From the staples like rice and wheat to high-value crops like spices, fruits, and vegetables, India has not only become self-sufficient in food grains but also carved a niche for itself in the global export market.
India’s agricultural exports make a substantial impact on global food security.
All these highlight India's critical role in the global food supply chain, impacting a significant portion of the world's population.
Shrinking Farmland and the Crucial Role of Agrochemicals
With the global population at around 8 billion, set to grow by 1.2 billion by 2030 and an additional 2 billion by 2050, which means more demand for food and protein. Despite this, food insecurity is a growing concern. Currently, about 10% of the global population, face food insecurity. If trends continue, this number could rise to between 800 million and 1 billion by 2030.
Tackling these issues will require boosting agricultural productivity, improving food distribution, and enhancing resilience to environmental challenges. However, arable land is shrinking significantly—from around half an acre per person today to less than a third by 2050. This sharp decline in available farmland underscores the urgent need to increase food production on less land. Agrochemicals become vital in this context, playing a crucial role in enhancing crop yields and ensuring global food security.
India’s Agrochemical Revolution: A Harvest of Opportunities
The Indian agrochemical industry is valued at around $7.5 billion and is projected to grow at a compound annual growth rate (CAGR) of 8-10% over the next few years. This makes it one of the largest agrochemical markets globally.
India is on the cusp of an agrochemical revolution, and there's plenty to be excited about! As the 2nd largest exporter of agrochemicals in the world and a top player in crop protection production, India's agrochemical sector is set for remarkable growth. With domestic innovation picking up pace and a strong focus on manufacturing competitive post-patent products, the market is expected to expand at a healthy rate, yielding a bountiful harvest of opportunities in the agrochemical sector.
Agrochemicals might sound like a complicated term, but it's really all about two main things: fertilizers and pesticides.
Fertilizers vs. Pesticides: What’s the Difference?
Think of fertilizers as the vitamins for plants—they give crops the nutrients they need to grow big and strong. Pesticides, on the other hand, are like the medicine—they protect crops from the bad guys like pests and diseases.
Fertilizers often rely heavily on government subsidies and face challenges with pricing power and differentiation, leading to lower margins. On the flip side, pesticide companies operate with more flexibility, often enjoying higher margins due to the unique formulations they offer.
Pesticides: The Unsung Heroes of Indian Agriculture
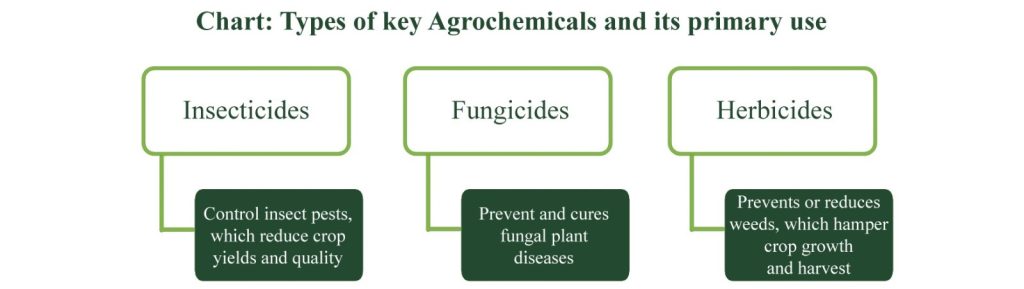
In India, pesticides play a vital role and come in various types based on what they target:
Paddy is the biggest consumer of agrochemicals in India, accounting for 26-28% of use, followed by cotton. Eight states—Andhra Pradesh, Maharashtra, Punjab, Madhya Pradesh, Chhattisgarh, Gujarat, Tamil Nadu, and Haryana—dominate the market, using over 70% of India’s agrochemicals, with Andhra Pradesh leading the pack.
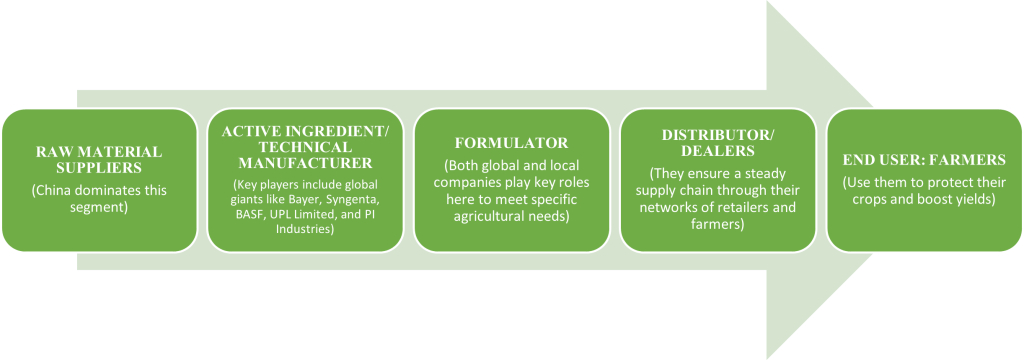
The Pesticides Market Value Chain: From Factory to Field
The journey of a pesticide from raw material to the farmer’s field involves a complex value chain:
Why Invest in India's Agrochemical Industry?
So, why should investors keep an eye on India’s agrochemical industry? Here’s the scoop:
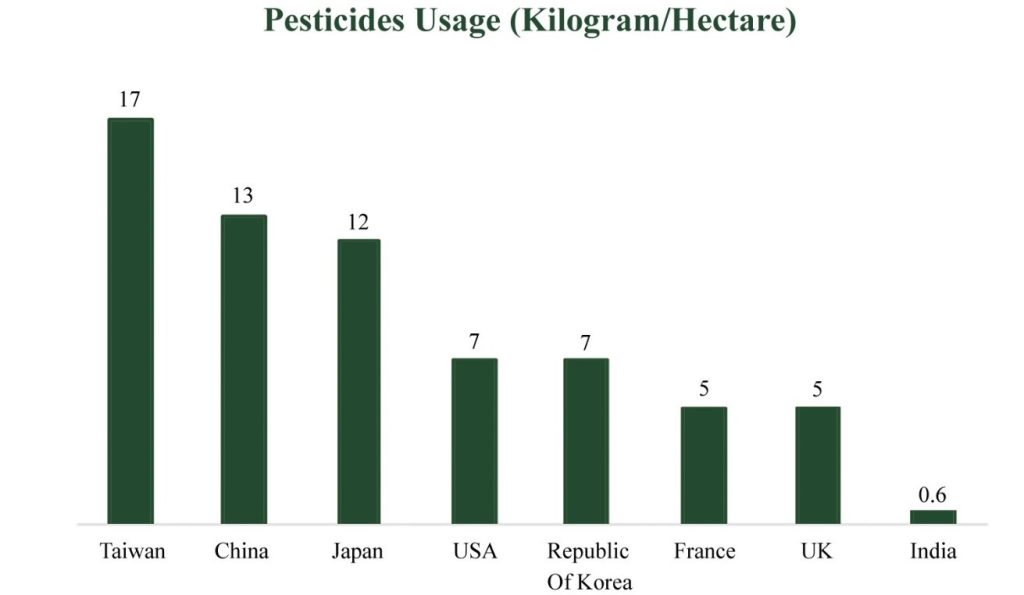
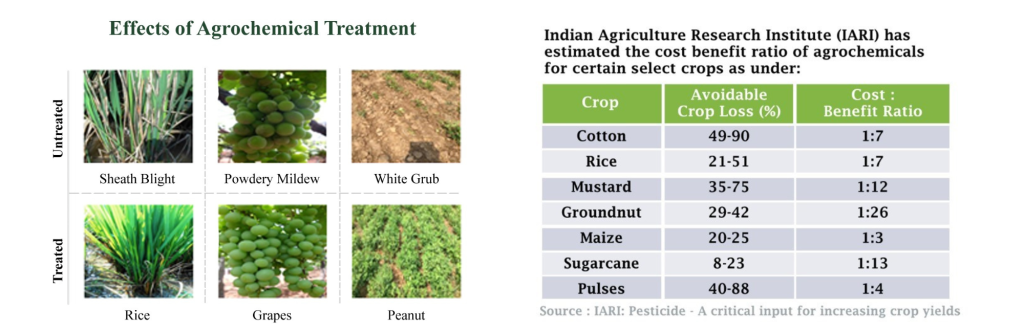
With a rising population and increasing focus on nutrition, expanding agrochemical use is crucial. The reduction in arable land further amplifies the importance of agrochemicals in optimizing crop yields. In India, where agriculture is the backbone of the economy, this dynamic ensures a sustained and escalating demand for agrochemical solutions. India's per hectare agrochemical consumption stands at just 0.65 kg, compared to 7 to 10 kg in countries like USA and China. This disparity stems from India’s fragmented agriculture, with many small farmers having limited access to agrochemicals, which hampers productivity. Additionally, about 20-25% of India’s food production is lost to pests and diseases.
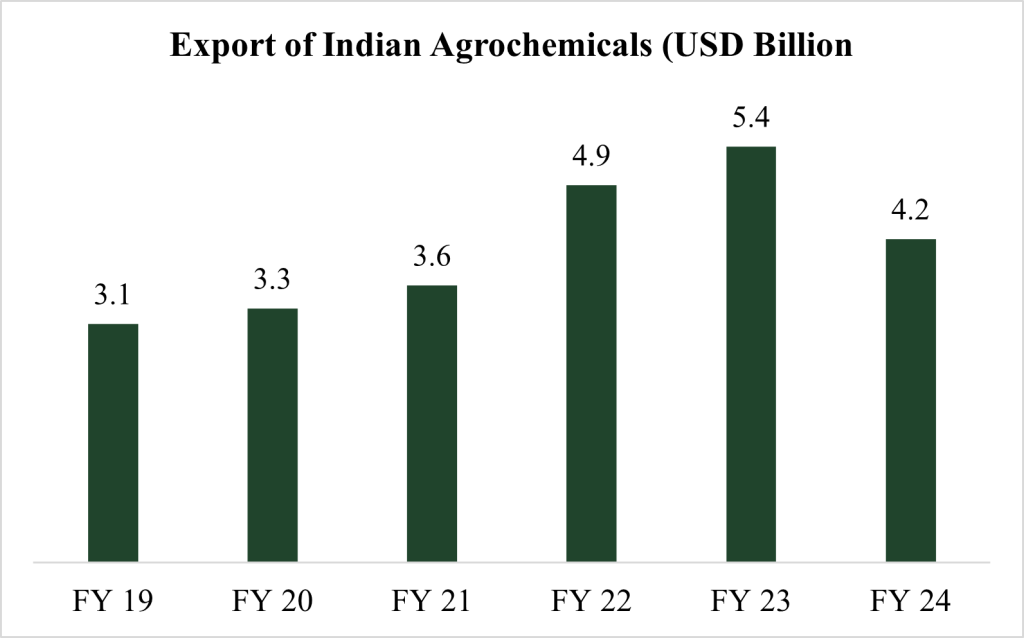
India’s competitive edge in low-cost manufacturing and a growing focus on innovation position it well on the global stage. The agrochemical exports have shown remarkable growth recently and could exceed Rs 80,000 crore in the next four years – Agro Chem Federation of India
Challenges on the Horizon
However, the road ahead isn’t without bumps. The industry faces challenges such as:
Looking Ahead
Despite these hurdles, there’s optimism on the horizon as raw material costs stabilize and global inventory levels adjust. In the years to come, companies that succeed will be those that strategically invest in their capabilities, especially in backward integration. Speed to market, efficient payment cycles, and strong branding will be key differentiators in this rapidly evolving landscape.
The future of India’s agrochemical industry is bright, with opportunities sprouting at every turn. As the sector continues to bloom, it’s not just about feeding India—it’s about feeding the world.
"With innovation in agrochemicals, we are not just improving crop yields but also securing the future of Indian agriculture. These advancements are crucial for feeding our growing population." – N. R. Narayana Murthy, Co-founder, Infosys
Disclaimers and Disclosures
SEBI Registration No. :INH000017338, IN/AIF3/24-25/1571, IN/AIF2/24-25/1607 | BASL Membership ID: 6276
Investment in Securities Market are subject to market risks. Read all related documents carefully before investing. The securities quoted are for illustration only and are not recommendatory. Registration granted by SEBI, membership of a SEBI recognized supervisory body (if any) and certification from NISM in no way guarantee performance of the intermediary or provide any assurance of returns to investors.
AI & Data Center
Why is there a growing demand for Data Centers ?
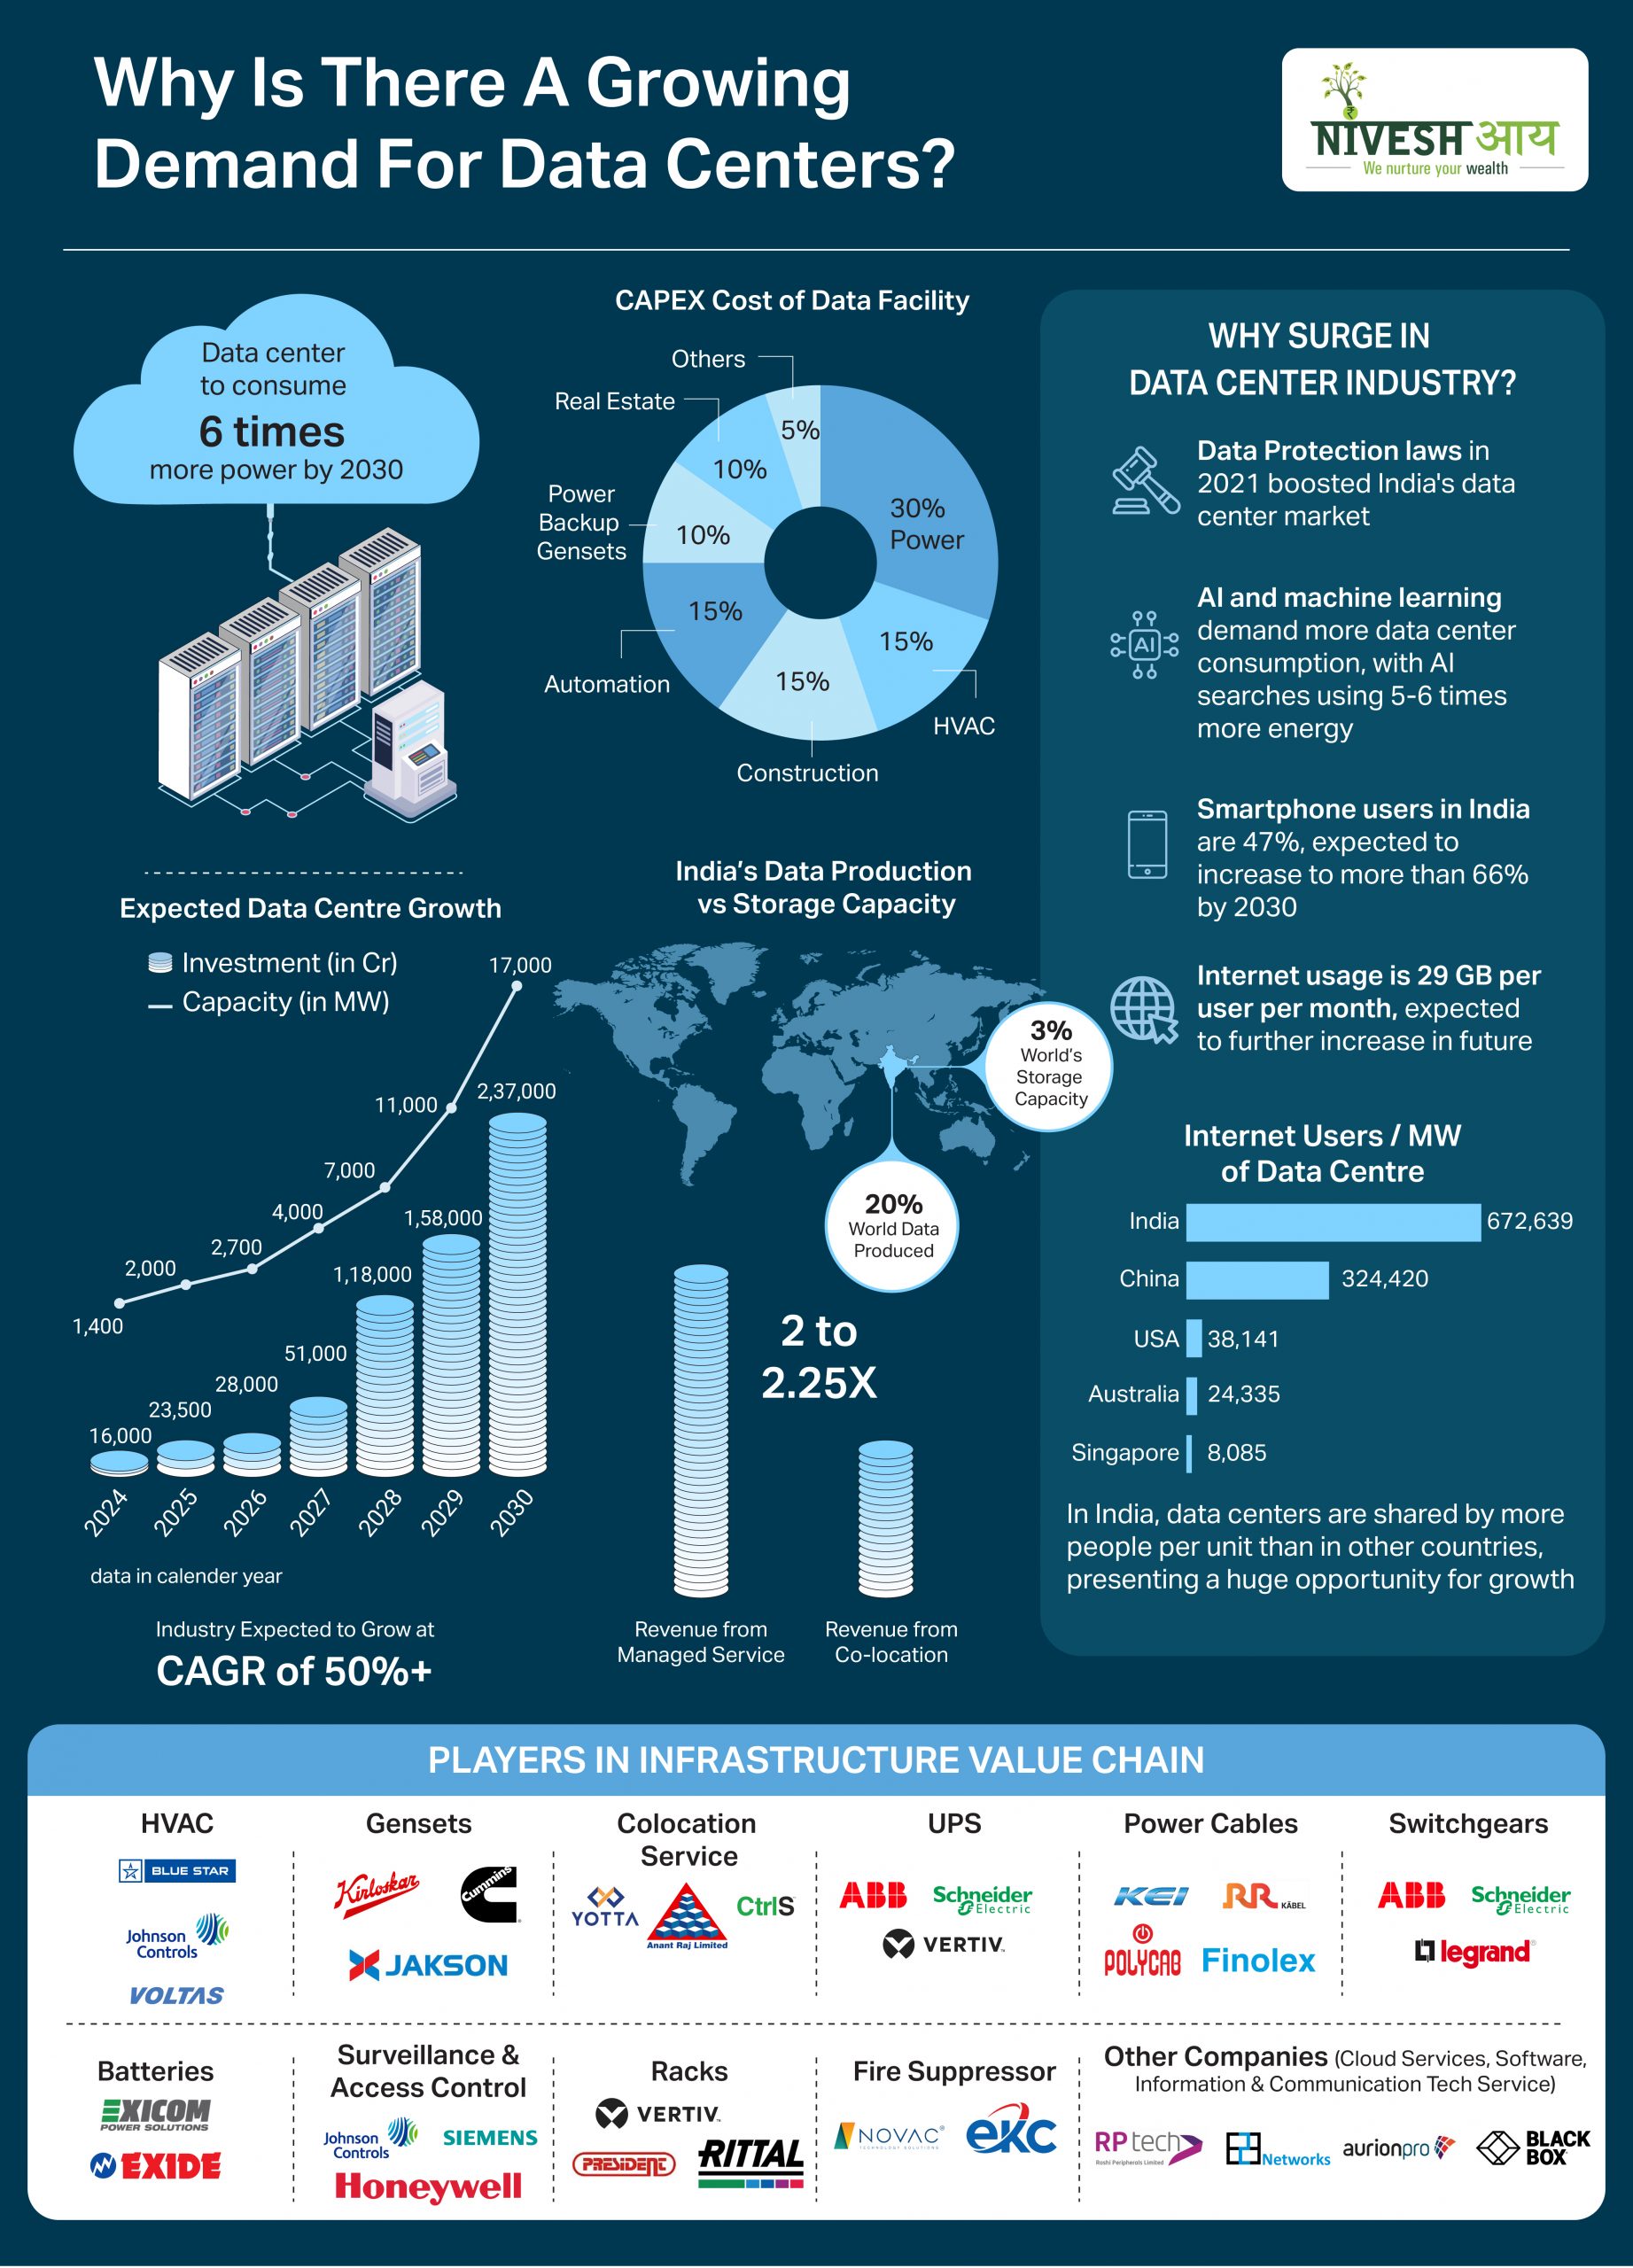
With more people using smartphones, the internet, and social media, India’s data usage is set to explode. Technologies like 5G, AI, and IoT will generate even more data. To handle this surge, data centers are essential, and India’s data center industry is expected to grow rapidly by 50% each year, becoming the backbone of our
With more people using smartphones, the internet, and social media, India’s data usage is set to explode. Technologies like 5G, AI, and IoT will generate even more data. To handle this surge, data centers are essential, and India’s data center industry is expected to grow rapidly by 50% each year, becoming the backbone of our digital economy! 📱
Power & Renewable Energy
How Are Smart Meters Revolutionizing Power Sector?
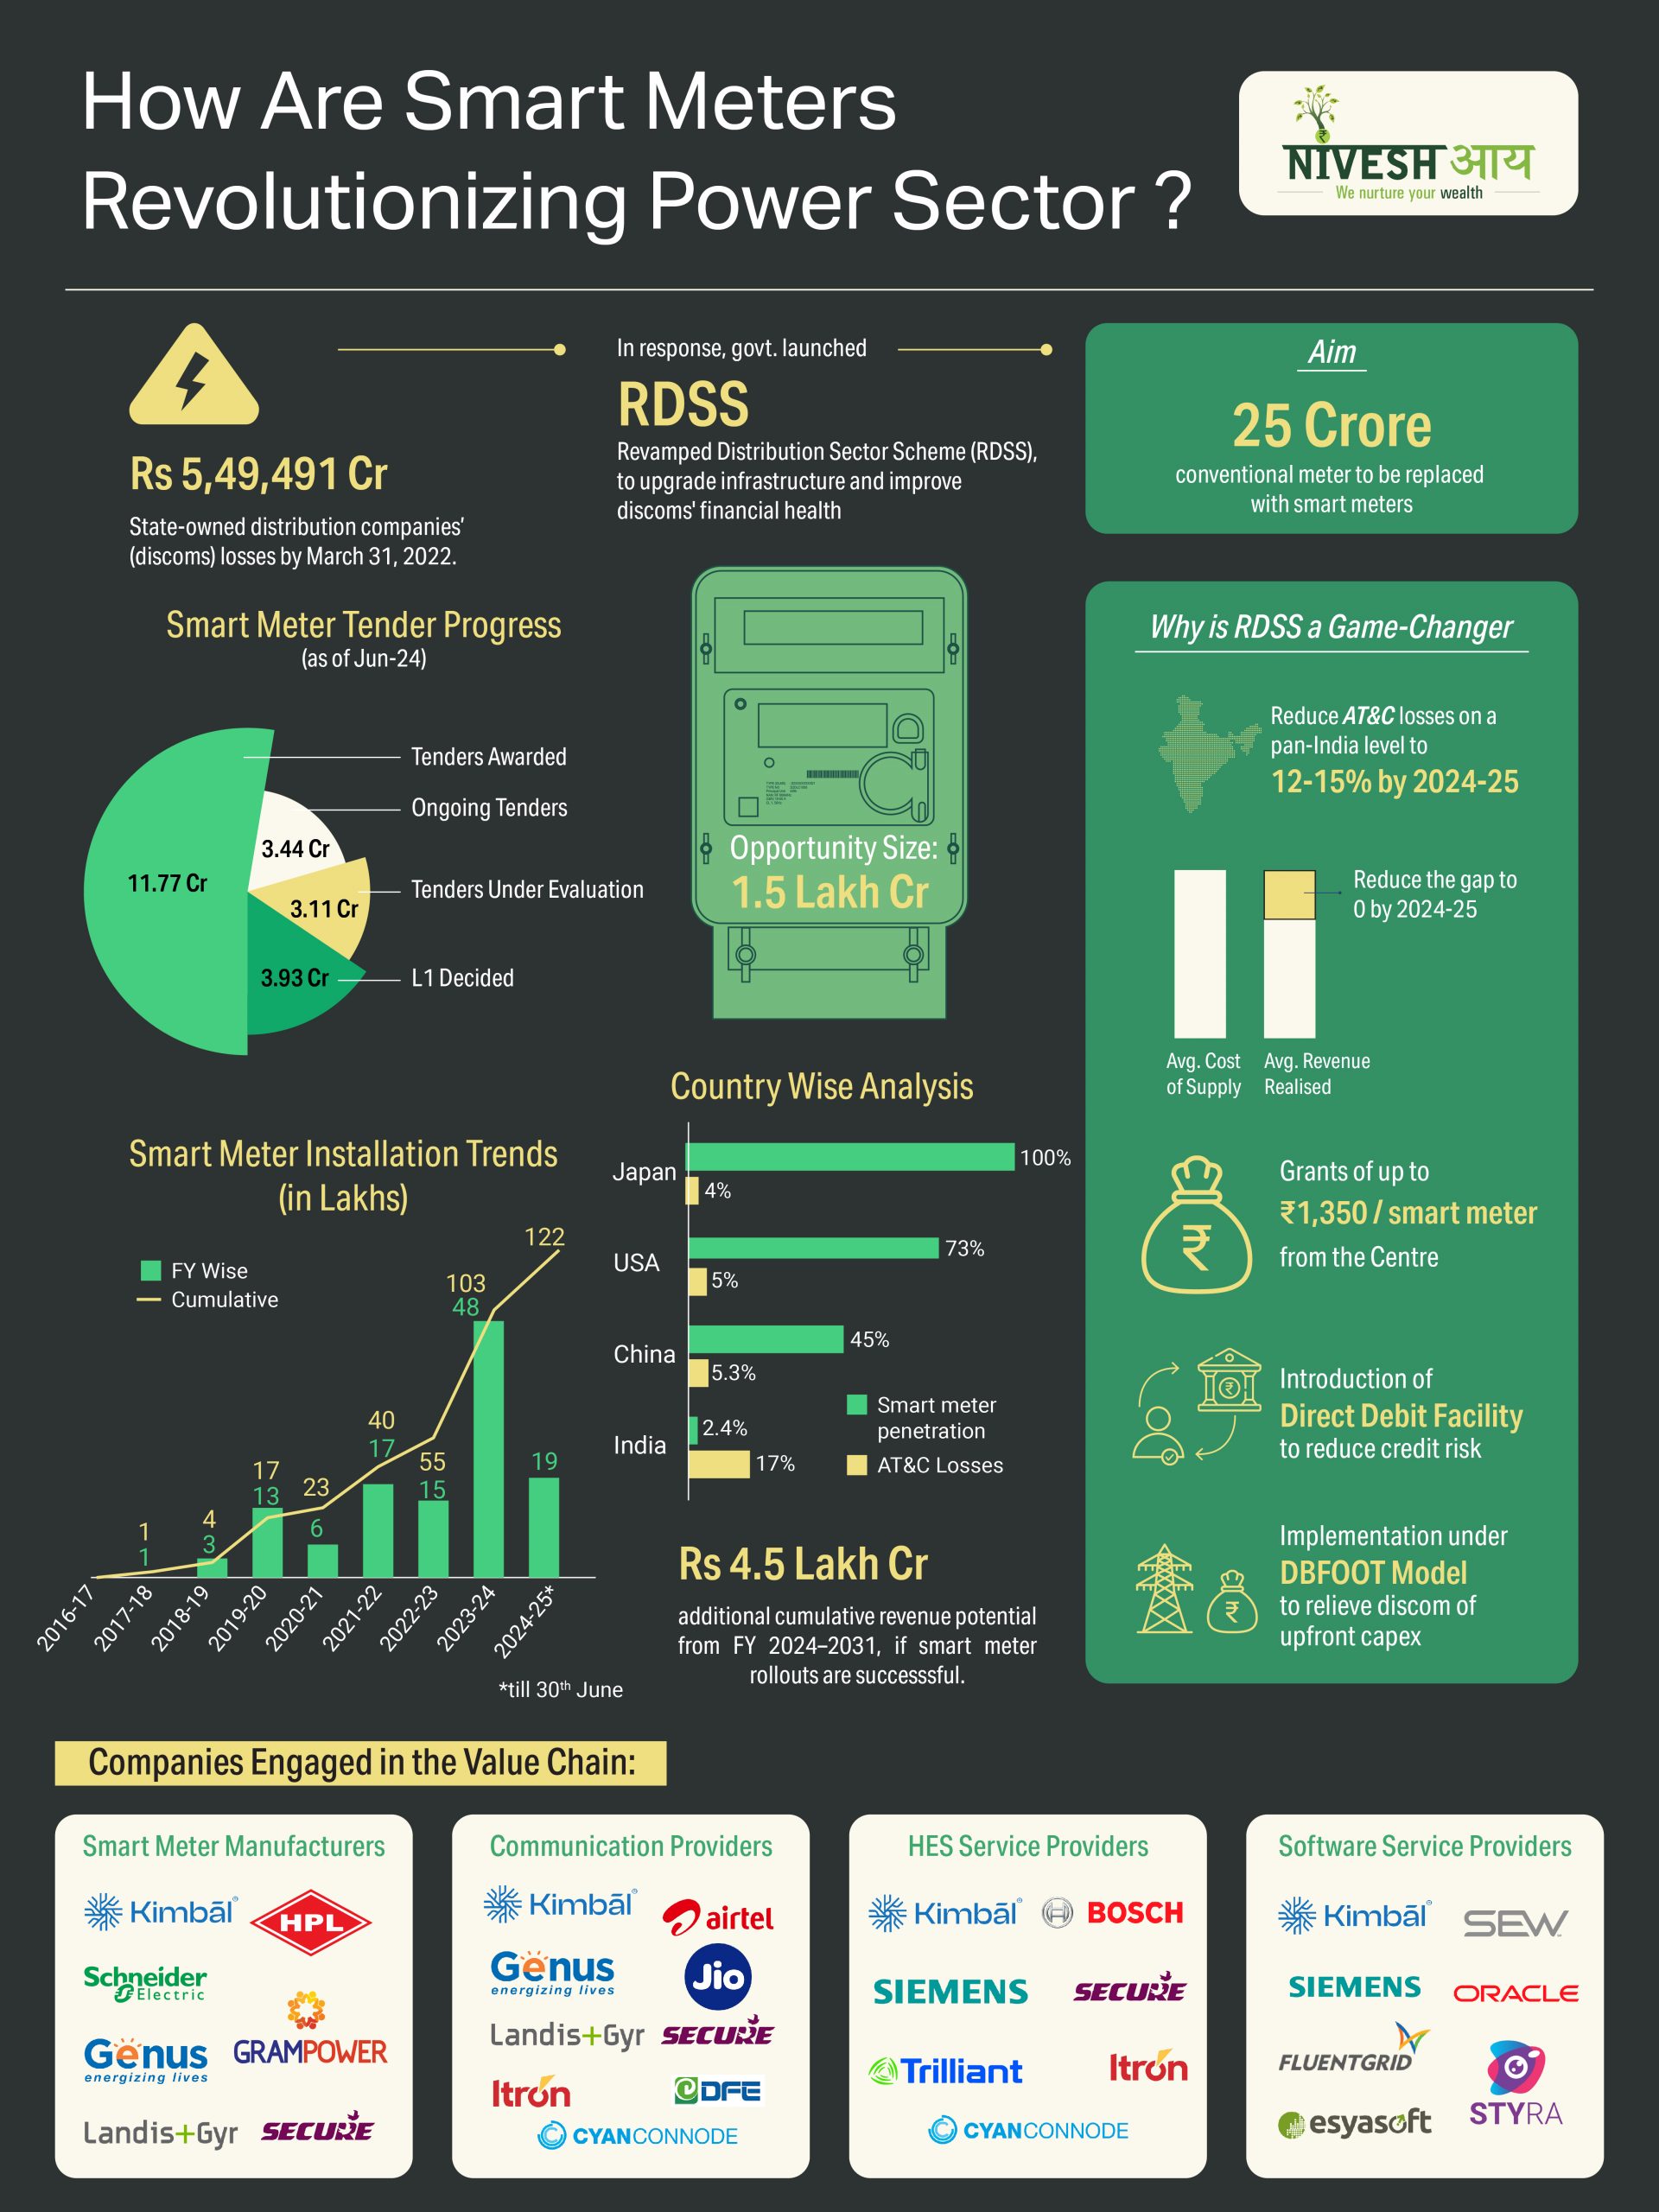
India’s Smart National Program, under the RDSS scheme, seeks to replace 25 crore traditional electricity meters with smart meters.⚡️CRISIL Ratings indicates that this initiative will greatly enhance the operational and financial efficiency of distribution companies (discoms). 📈 The smart metering market in India offers a significant opportunity to transform the power sector by improving operational
India’s Smart National Program, under the RDSS scheme, seeks to replace 25 crore traditional electricity meters with smart meters.⚡️CRISIL Ratings indicates that this initiative will greatly enhance the operational and financial efficiency of distribution companies (discoms). 📈 The smart metering market in India offers a significant opportunity to transform the power sector by improving operational performance of distribution companies (discoms) and consumer experience. Supported by government initiatives and reliable payment mechanisms, these projects are poised to drive sustainable growth, modernize power distribution, and support India’s goal of achieving 500 GW of renewable energy installed capacity by 2030. 💯🎯
Power & Renewable Energy
Is the Wind really blowing in favour of Wind Industry ?
What do you think when you hear the word 'renewable energy'? Solar, right? However, when we say renewable energy, it is not just solar; there are other renewable energy sources that are included, like wind energy, hydro energy, bioenergy, etc. Solar is the most popular form of renewable energy because, lately, we have seen a
What do you think when you hear the word 'renewable energy'? Solar, right? However, when we say renewable energy, it is not just solar; there are other renewable energy sources that are included, like wind energy, hydro energy, bioenergy, etc. Solar is the most popular form of renewable energy because, lately, we have seen a lot of rooftop solar installations at homes and industries.
Now, the bigger question - Will we see good wind installations in the coming years nationwide? The simple answer to that question is yes. Solar produces electricity only during the day, whereas when we talk about wind, the wind can produce electricity both during the day and at night. However, wind energy generation is higher at night as compared to day time because the speed of wind at night is much higher. Thus, we can say that it is never going to be wind vs solar, it will always be wind with solar. A combination of these two is called a hybrid power plant. The net realization of hybrid power plants is higher than that of vanilla wind or vanilla solar power plants, which in turn increases profitability for the power producer.
Cost and Profitability Analysis
We usually have the perception that producing electricity through solar is a cheaper source than producing electricity through wind. Let’s dive deep into the matter and check by some statistics.
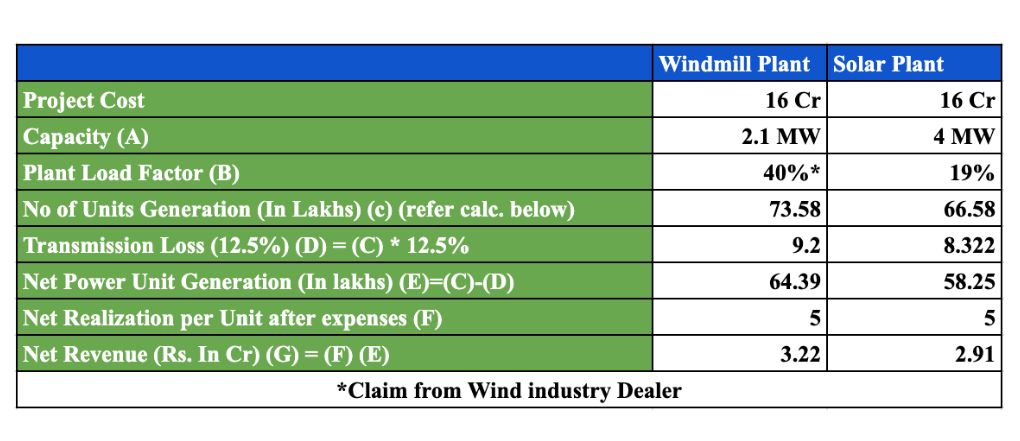
The prices in the table are indicative of the average prices that are prevalent in the market as there is a lot of volatility in solar module prices. We have assumed Rs. 5 per unit as a constant tariff which a power producer can get by selling per unit of electricity generated.
No. of units generated = Rated Capacity(A) * 1,000 (converting it to kilowatts) * 24 (No. of hours in a day) * 365 (no. of days in a year) * Plant load factor of a plant(B).
As we can see from the table, even when you invest an equal amount of money in both solar and wind, the total plant capacity of solar is higher than wind plant. However, the net units generated are higher in wind. This is because of the difference in PLF (Plant Load Factor). PLF is a measure of the average capacity at which it can generate electricity. Taking into consideration all the factors above, we can see, wind as a renewable resource is as profitable as solar.
Apart from the quantitative factors, there are also qualitative factors which would affect wind installations in the country. Currently, solar installations in the country are more than wind installations. But, the country cannot just have solar on the grid. Solar produces electricity only during the day and thus creates a lot of pressure on the grid to transmit electricity. The electricity produced in the day cannot be used in the night, unless we store the electricity, again posing a lot of challenges and thus, we need to have an alternative source of electricity generation. Here, wind comes to our rescue. Wind is very efficient in producing electricity in non-solar hours, thus making it a good source of energy generation.
Now let's see if India as a country is capable of installing wind-powered plants at the capacity that it is actually targeting.
India’s strategic geographical location
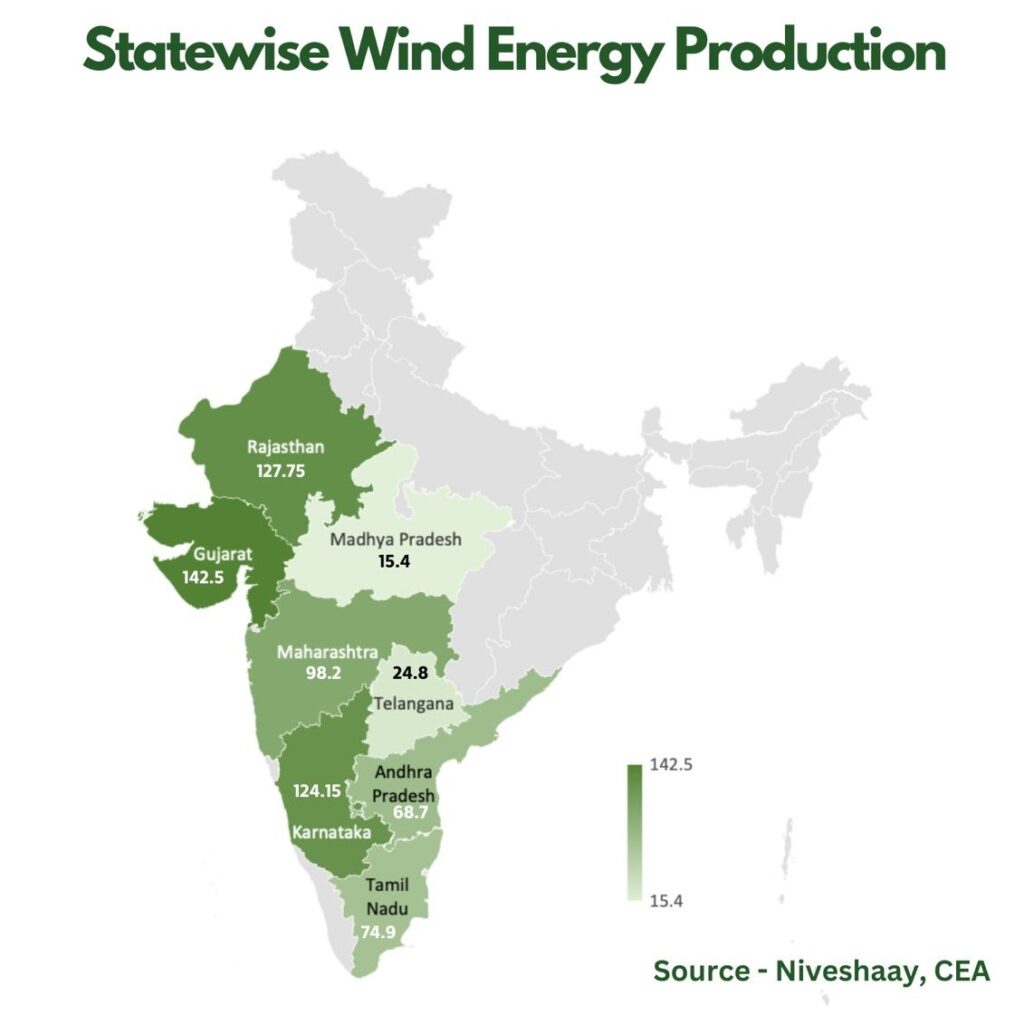
India has a coastline of around 7,517 km and wind energy works really well on the coast because the wind blows faster there. It's like having a supercharged breeze that helps generate more electricity.
There are 8 windy states in the country where the majority of wind energy is produced and have a potential cumulative capacity of generating 695 GW of wind electricity. Majority of the windy states lie in the coastal region.
We can now say that India has the availability of wind resources. But does India really focus on wind installation to shift its reliance from thermal to renewable energy? Let’s see what the case is.
Wind Capacity in the country (New Installations and Cumulative capacity)
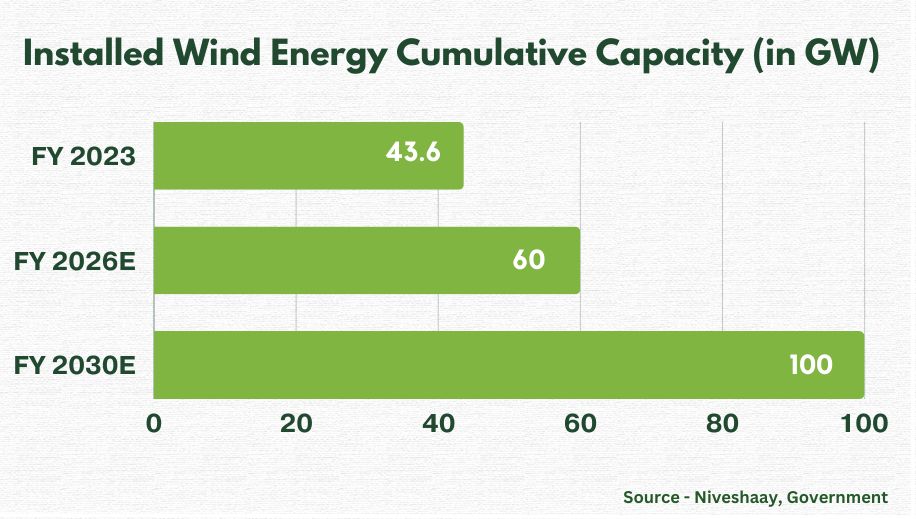
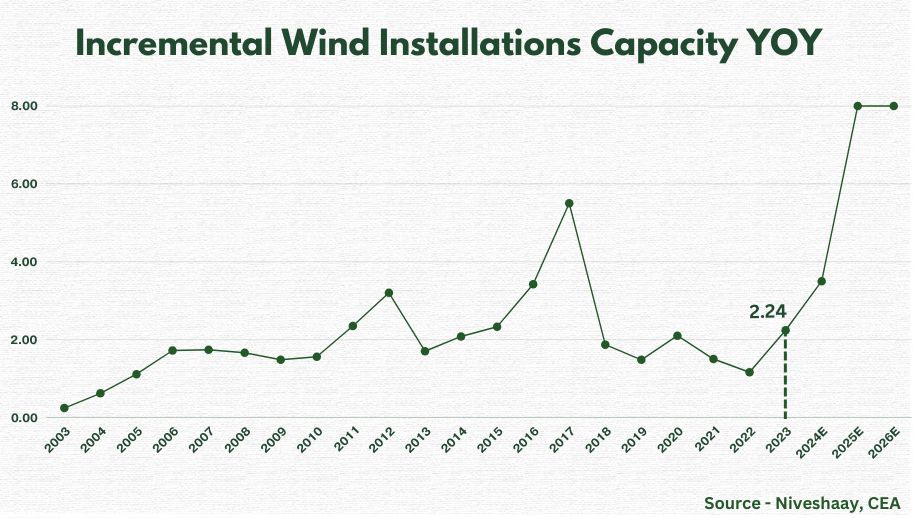
In January 2024, India's wind power capacity reached around 44.97 GW (43.6 GW as on March 2023), a monumental leap from a mere 1.2 GW in 2000 and the government has targeted to increase the cumulative installed capacity to 60GW by FY26 and to further increase to 100GW by FY30. India ranks fourth globally in terms of installed wind capacity. As we can see from Exhibit 2, though India installed just 2.24 GW of wind energy in FY23, it installed 1.55 GW in H1FY24 alone. It is expected to install around 3.5 GW in FY24, which is around 56.25% higher installations as compared to FY23. The government also targets installing 8 GW of wind energy in FY25 and FY26 each.
The long-term prospects for the wind industry in India remain robust, as the country transitions to competitive, low-carbon technologies, fostering sustainable growth and a cleaner, greener future.
We have already seen a lot of reasons why the Indian wind industry is expected to do well, but let's list down some more for you.
Why We expect the Indian Wind Industry to do well?
1) Aggressive targets of PSUs
Four PSUs, namely NTPC, NHPC, SECI and SJVN, have committed to bid for 10 GW of wind energy in FY24 across various quarters; this was just 2.5 GW on an average on a yearly basis till now. This will increase the number of wind farm projects developed in the country.
2) Repowering of Wind Farms
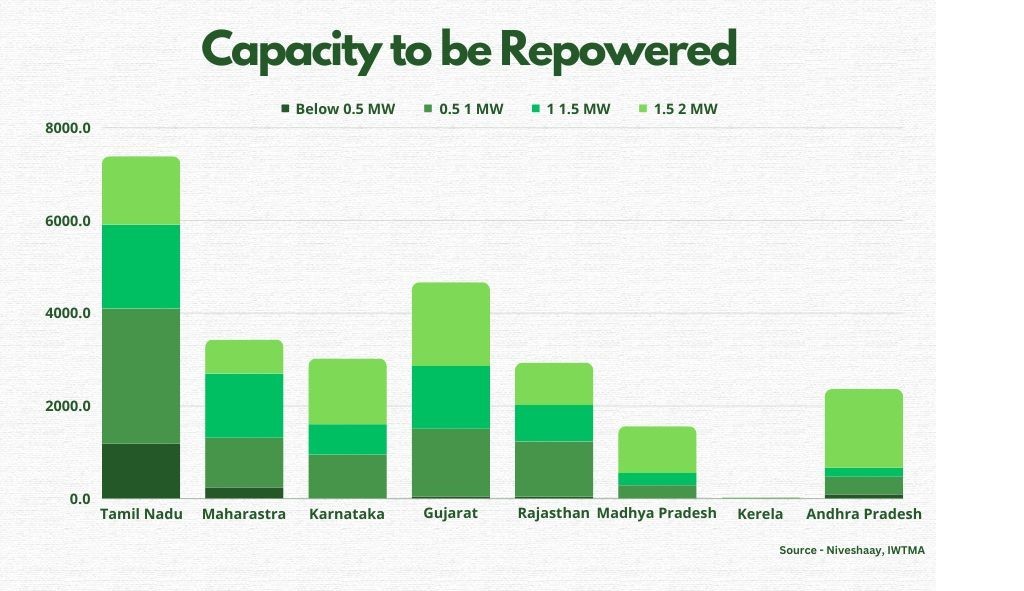
Older plants, like the ones that were set up around the end of the first decade of this century or even before, use obsolete technology; their capacity is only 664 KW and thus proves to be inefficient and more expensive at the project level. New turbines are usually of the capacity of 2 or 3 MW, which makes them a better option. There are government initiatives and the willingness of wind energy players to repower old wind farms. It is expected to give an additional benefit of around 25 GW in the next 5 years (taking into consideration, turbines with a capacity less than 2 MW). This will make wind generation more affordable for the existing plants as well as generate demand for the new turbines.
3) Abolition of Reverse Bidding
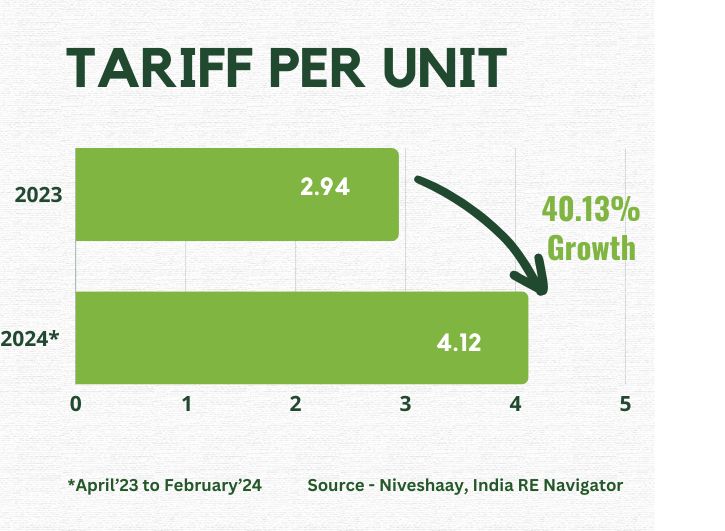
There is a revision in the policy which was being followed earlier, and this new policy will lead to better returns generated for power producers. Earlier, we used to follow reverse bidding, where the bidder could revise his bid based on the bids provided by other bidders, whereas now, under competitive bidding, the bidder would not be allowed to revise his bid once submitted, and the bids would be disclosed only at the time of the result declaration.
Under reverse bidding, bidder would keep on lowering their bids to win the tender and this would lead to unsustainable level of IRR. But now, with competitive bidding, there is an increase in tariffs (bid price).
The tariffs went as low as Rs. 2.34/ Unit in 2019, which came to be around Rs. 2.94/ Unit in 2023. This trend can also be confirmed by the fact that of all the auctions generated till now in FY24, on a weighted average basis, the tariff offered is much higher at around Rs. 4.12/unit. This policy change will lead to better rates being offered to the power producers, thus increasing their IRR , which will further motivate them to install wind energy generation capacity.
Challenges in the industry
We have already talked about everything that can go right for the industry, but there is always something that can go wrong, right? So, let’s talk about the things that are not going in favour of the sector.
(1) Delay in execution because of government regulations
Currently, the entire wind sector is operating effectively, but what hinders its progress are government regulations. There is a lot of red tape in the sector and hence the industry is not able to perform in its full swing. Players are not able to get the required land approvals and the bidding process has slowed down. These regulatory issues have been an issue for a very long time and as long as these issues are resolved, we won't be able to see the sector perform at its full potential.
(2) Cost Competitiveness with Solar
Though till now we have been talking about why it should be wind with solar, we can also not ignore the fact that because of the recent decline in solar module prices, the cost of setting up a solar power plant can decrease which will lead to reduced cost of electricity generated from solar. It can motivate the smaller captive and industrial consumers to move towards solar power plants.
However, large scale IPPs or industrialists would have many regulations to follow which would not allow them to install vanilla solar of such a high capacity and thus they would have to install other sources of energy. Also, because of continuing strain on the power grid during the day, it is expected to have a good growth uptick in wind installations too.
In conclusion, the wind industry has a bright future with a growing focus on sustainability by major PSUs and promising returns it offers. While challenges like regulatory uncertainties exist, we're optimistic about its growth story. It's a wait-and-watch moment for all of us. Let's see how it unfolds.
Sayonara for now! Until our next update.
Disclaimer:
Investment in securities market are subject to market risks. Read all the related documents carefully before investing. The content in these posts/articles is for informational and educational purposes only and should not be construed as professional financial advice and nor to be construed as an offer to buy /sell or the solicitation of an offer to buy / sell any security or financial products.
Registration granted by SEBI, membership of BASL and certification from NISM in no way guarantee performance of the intermediary or provide any assurance of returns to investors.
The securities quoted are for illustration only and are not recommendatory.
Disclaimers and Disclosures
SEBI Registration No. :INH000017338, IN/AIF3/24-25/1571, IN/AIF2/24-25/1607 | BASL Membership ID: 6276
Investment in Securities Market are subject to market risks. Read all related documents carefully before investing. The securities quoted are for illustration only and are not recommendatory. Registration granted by SEBI, membership of a SEBI recognized supervisory body (if any) and certification from NISM in no way guarantee performance of the intermediary or provide any assurance of returns to investors.
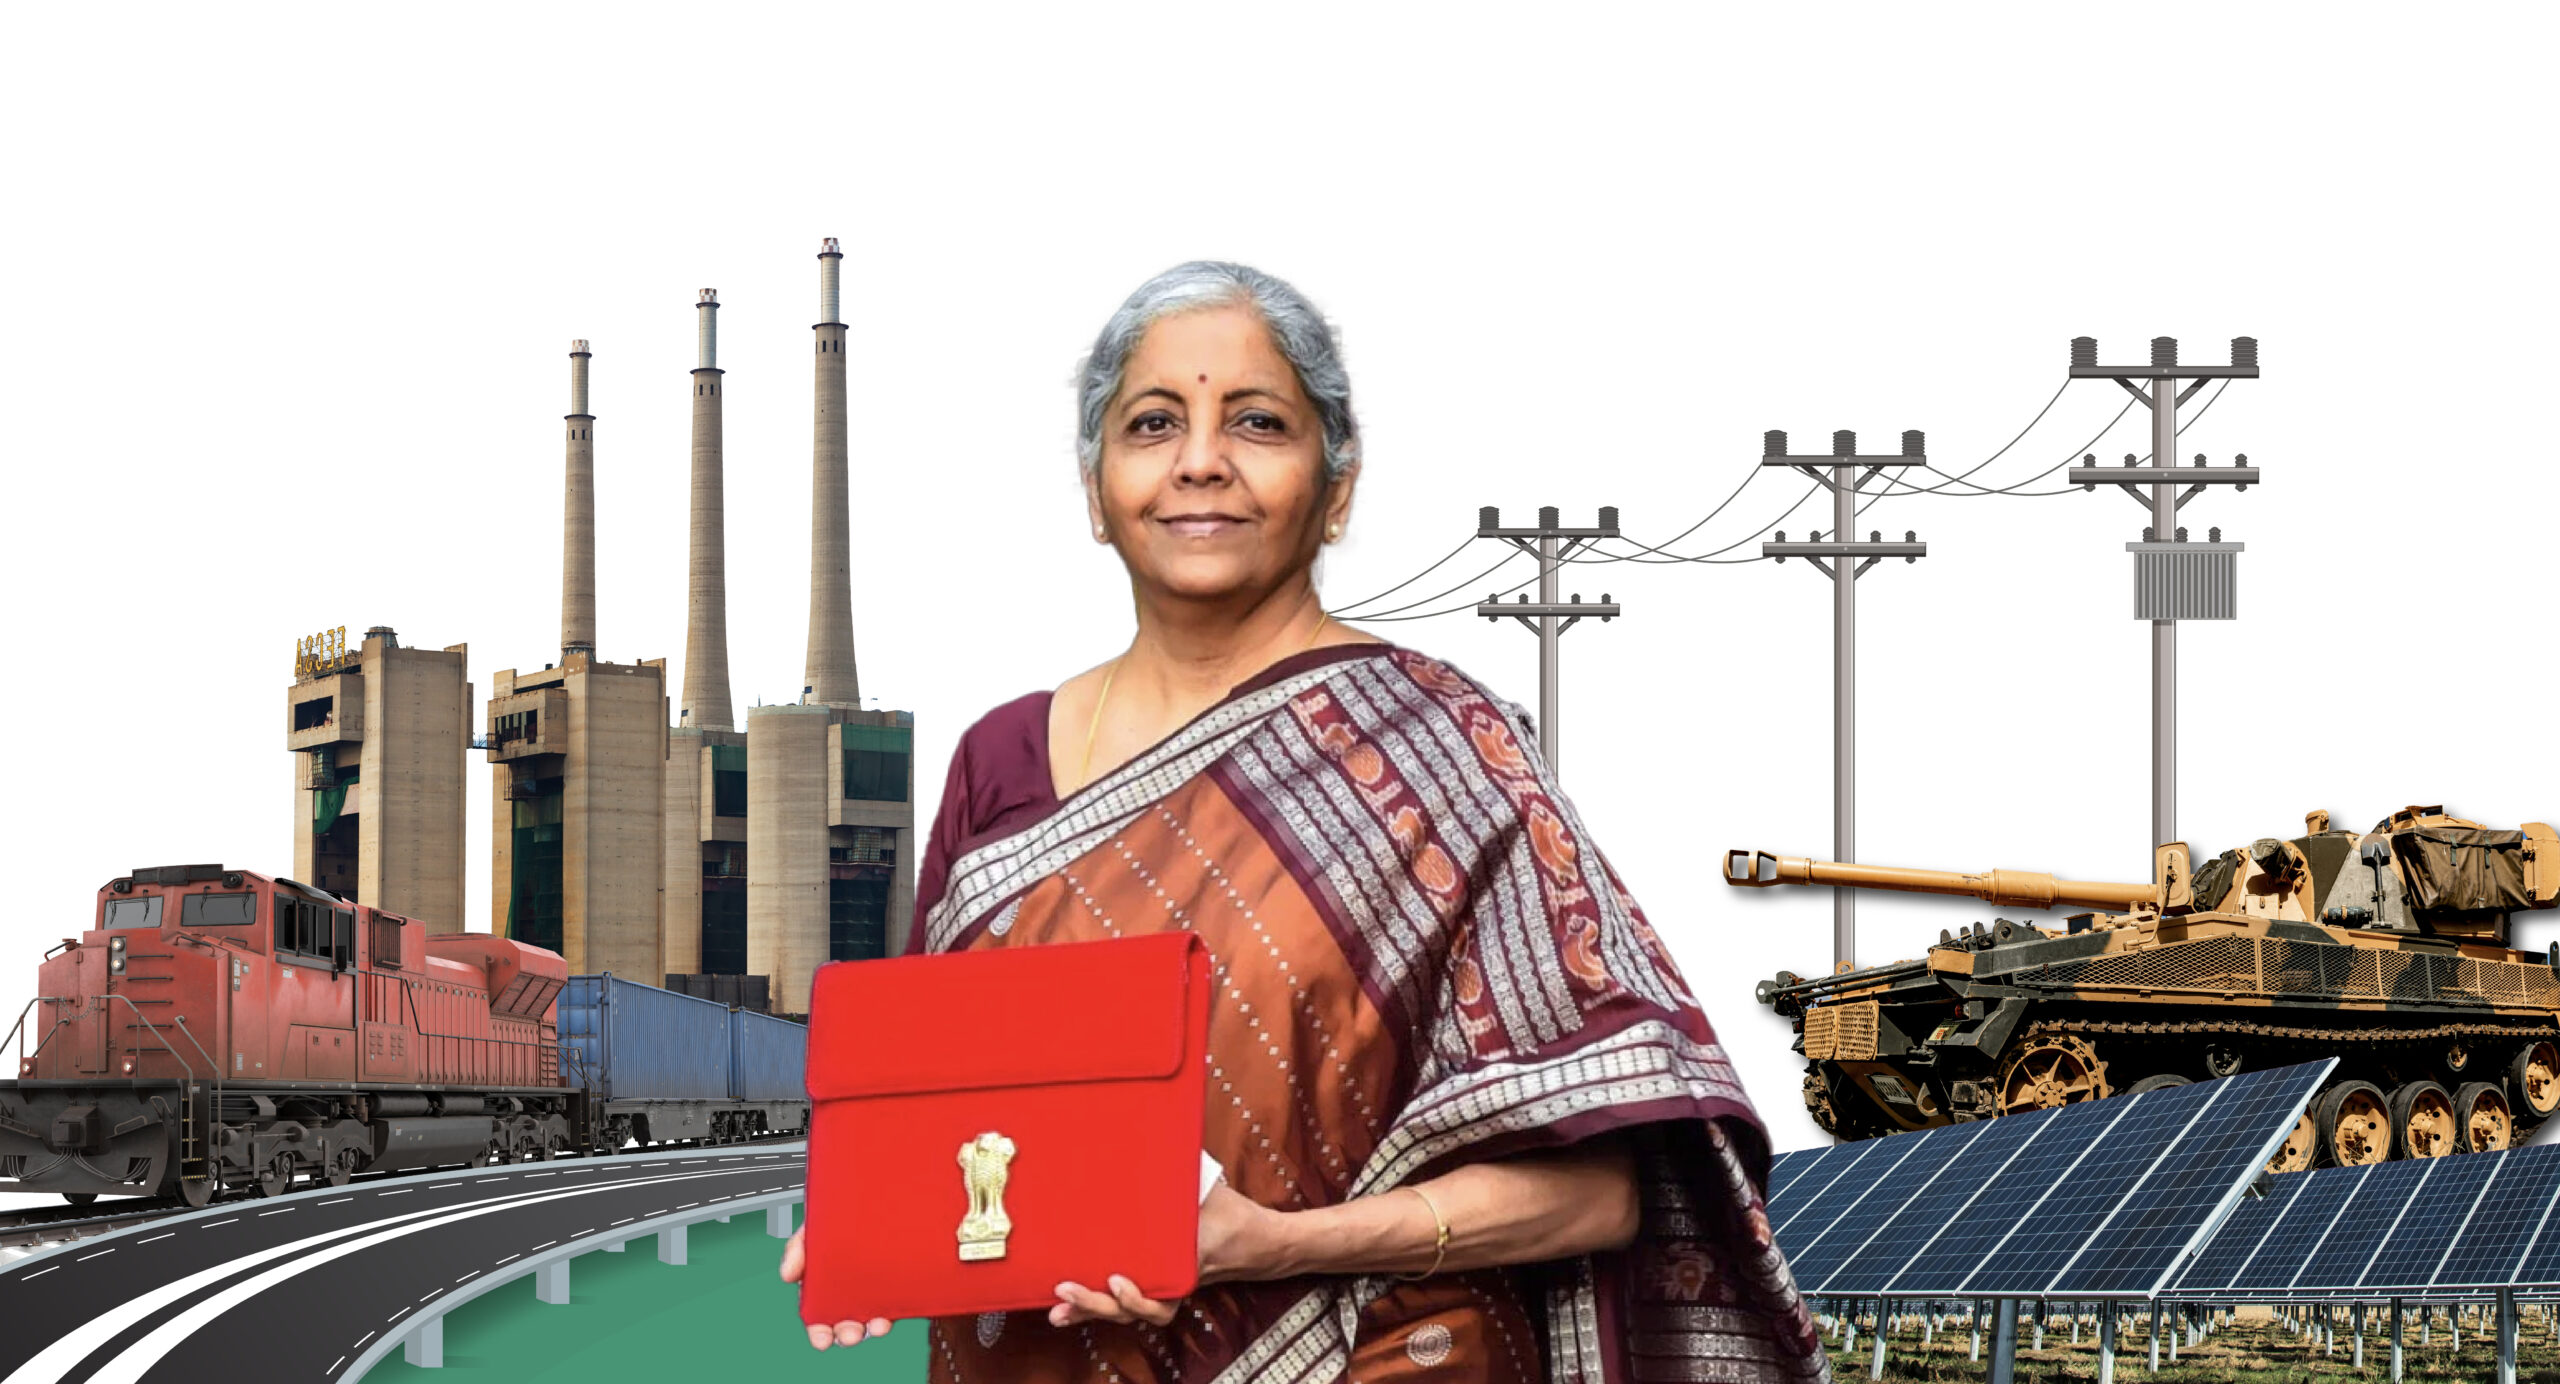
Metals & Mining
Niveshaay’s View on the Union Budget 2024
The Union Budget 2024 is themed around the roadmap for the pursuit of ‘Viksit Bharat,’ aiming to generate employment, enhance financial stability, improve credit access, and foster overall economic growth, making it a unique model of self-propelling growth strategy. While tax adjustments are part of the new policies, the focus remains on supporting sustainable corporate
The Union Budget 2024 is themed around the roadmap for the pursuit of ‘Viksit Bharat,’ aiming to generate employment, enhance financial stability, improve credit access, and foster overall economic growth, making it a unique model of self-propelling growth strategy. While tax adjustments are part of the new policies, the focus remains on supporting sustainable corporate growth and economic stability. The government's continued emphasis on enhancing the company’s earning potential reflects a commitment to ensure long-term success and resilience.
Moreover, the budget’s initiatives to stimulate consumption through generating employment in the economy signal a proactive approach to economic health and welfare. To reduce the gap between receipts and expenditure, the government needs to do a balancing act. India’s fiscal deficit for FY24 was ~5.63% of the GDP which the government aims to bring down to 4.9% of the GDP for FY25 and below 4.5% of the GDP by FY26.
The budget announcement has introduced several policies and measures aimed at different segments of society and the economy. While the comprehensive budget addresses various sectors and stakeholders, our focus will be on examining the specific policies and initiatives that directly impact our investment strategies and allocations. Our analysis will assess the budgetary decisions, offering insights into how such changes will guide our approach.
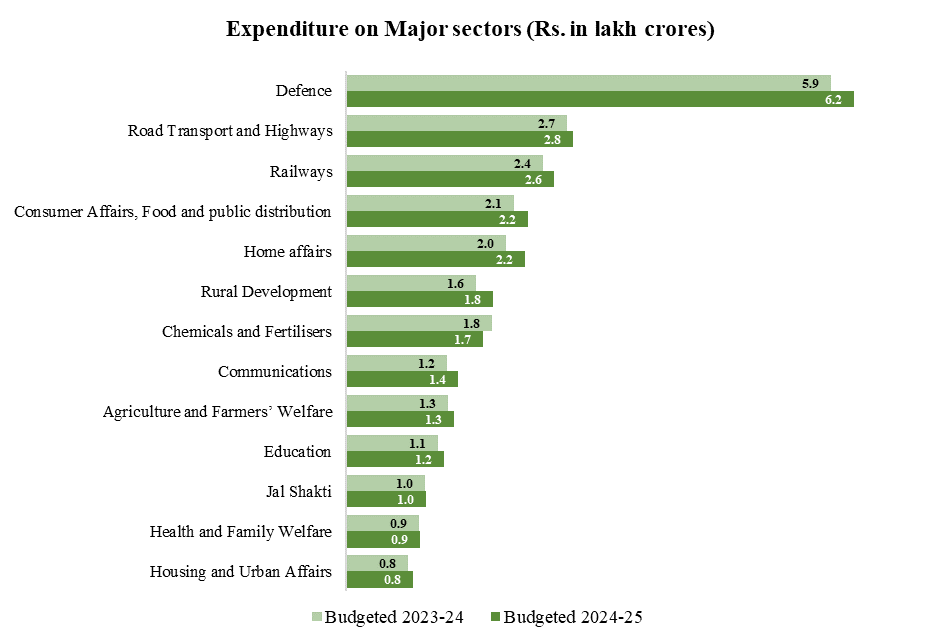
PART A
1.Push for Energy Transition to continue
The government has continuously prioritized sustainable energy over the last two tenures and the current budget also maintains its focus on initiatives for energy storage, solar rooftops, nuclear energy, and aiding small industries in cleaner energy transitions.
Energy storage: This year's budget emphasizes energy solutions, including pumped storage, to tackle the variability and intermittent issues of renewable energy. Multiple tenders are anticipated, boosting opportunities for pumped storage manufacturers, project financiers, and EPC contractors involved in these projects.
Solar: Solar energy is thriving with strong government support, targeting 280 GW by 2030. Currently, ~85 GW has been installed, and we anticipate continued momentum as execution remains a focus. The 'PM Surya Ghar Muft Bijli Yojna' aims to install rooftop solar in 1 crore households, providing 300 free units of electricity monthly, already attracting 1.28 crore registrations and 14 lakh applications. This is expected to boost domestic solar component manufacturers and EPC players, aided by budget measures like a 10% Customs Duty on solar glass (w.e.f October 2024).
Nuclear reactors: The future energy mix will prominently feature cleaner sources like nuclear energy. The government, in collaboration with the private sector, will focus on establishing and advancing nuclear projects, including the R&D of Bharat Small Reactors. Funding for R&D, as announced in the interim budget, will support these initiatives.
Advanced Ultra Super Critical Thermal Power Plants: The development of Advanced Ultra Super Critical (AUSC) thermal power plant technology, which offers higher efficiency, has been completed. A joint venture between NTPC and BHEL will build an 800 MW commercial plant using AUSC technology, with government fiscal support. This is expected to foster indigenous production of high-grade steel and advanced materials, benefiting the economy.
2.Major Infrastructure Developments on the Horizon
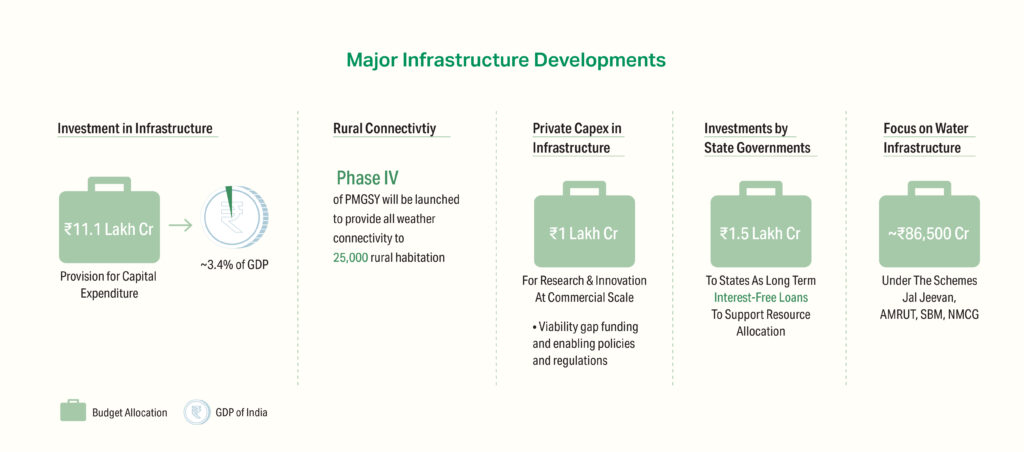
The budget emphasized a comprehensive development initiative called 'Purvodaya', targeting the overall growth of Bihar, Jharkhand, West Bengal, Odisha, and Andhra Pradesh.
Despite previous delays, the government remains steadfast in fulfilling the Andhra Pradesh Reorganization Act's promises, including developing Amaravati as the state capital and completing the Polavaram Irrigation Project. The government's focus and significant expenditure in this sector highlight the potential for local and regional companies involved in infrastructure, particularly those in cement manufacturing and EPC services, to be well-positioned to be major beneficiaries of this development.
Additionally, the government is transforming Bihar with new airports, medical colleges, sports facilities, and the ambitious Patna-Purnea Expressway. These projects, costing ₹ 26,000 crore, aim to reshape the state's transportation landscape.
To further boost infrastructure development in India, the government has decided to partner with State Governments and Multilateral Development Banks to promote water supply, sewage treatment, and solid waste management projects in 100 large cities.
The removal of Basic Customs Duty (BCD) on ferro nickel and blister copper, along with the continuation of a nil BCD on ferrous scrap and nickel cathode for another 2 years, aims to reduce the stainless-steel production cost and is also positive for domestic cell manufacturing.
The government has earmarked ₹11.1 lakh crore, a ~10% increase from the previous year’s allocation, to enhance India’s infrastructure, with a significant focus on rural development, including ₹2.66 lakh crore specifically for rural infrastructure.
With the government’s focus on robust fiscal support for infrastructure,we remain optimistic about sectors like capital goods, equipment manufacturers, EPC contractors, cement companies, metal companies, and other infrastructure-related industries.
3.Manufacturing and services
Railways
The recent budget has unveiled a historic capital expenditure allocation of ₹ 2,52,000 crores, marking a 5% increase compared to the previous year. This strategic investment is aimed at modernizing the infrastructure and enhancing service capabilities like the addition of new lines, Broad-gauge (BG) conversion, High-Speed Rail Corridor, etc. The increased allocation reduces reliance on external sources and borrowing, fostering greater self-sufficiency within the sector. This is expected to significantly benefit companies involved in manufacturing railway components, as well as strengthen the overall safety and efficiency of railway operations.
Defense
The Defense budget has received an allocation of ~₹ 6.22 lakh crore, a tad higher than last year. The ministry is targeting to spend on acquiring new weapon systems for the armed forces, including fighter aircraft, ships, submarines, drones, and specialist vehicles. This increased budget is expected to propel the growth of the Defence companies which may also create a positive ripple effect to companies who provide its products to such defence companies.
Electronics
India had exported just ₹ 12,800 crores of mobile phones in FY2019, which increased 19 times to ₹ 2,40,000 crores in FY2024. With a government outlay of ₹ 6,200 crores PLI scheme for electronics manufacturing and reduced custom duty from 20% to 15% on mobile phones, Printed Circuit Board Assembly (PCBA) of mobile phones, and components such as chargers/adaptors, will strengthen India’s competitiveness globally. This is expected to benefit mobile phone assemblers and electric component manufacturers by giving competitive manufacturing prices.
Textiles
The Budget allocates ₹4,417.09 crore to the textiles sector, up from ₹3,443 crore last year. This includes customs duty cuts and other incentives to drive growth. With current exports of technical textiles at $2.5 billion, India aims to reach $10 billion in five years. Additionally, duties on accessories for manufacturing textile and leather products for export will also be removed which are expected to lower production costs and enhance the competitiveness.
Telecom
The Indian government is actively promoting domestic manufacturing in the telecom sector with an outlay of ₹ 1910.80 crore in the PLI. To further support this, import duties on telecom equipment components (PCBAs) have been increased from 15% to 20%. These changes are designed to incentivize domestic manufacturing and support the cable, tower, and telecom equipment industries, and enhance India's self-reliance in the telecommunications sector.
Pharma
The government's commitment to strengthen the pharmaceutical sector is evident with the increased PLI scheme outlay to ₹ 2,143 crores from the previous outlay of ₹ 1200 crore. This substantial outlay, coupled with committed investments of ₹ 5,000 crores from the industry, will not only support India's drug supply chain but also create new job opportunities and foster innovation in the sector.
Medical Equipment and Medicines
The government has fully exempted three cancer medications from duty and reduced the duty on medical equipment, such as X-ray tubes and flat panel detectors from 15% to 5%. Additionally, all types of polyethylene used in the manufacture of orthopaedic implants are now free from customs duty. These measures will benefit the patients and depict the government’s commitment to social reforms.
4.Agriculture and Allied Industries to benefit
The government prioritizes productivity and resilience in agriculture under Vikshit Bharat, planning to enhance productivity and develop climate-resilient crops through revamped research and competitive funding, including private entities.
Key initiatives include releasing 109 high-yielding crop varieties, promoting natural farming for one crore farmers, achieving self-sufficiency in pulses and oilseeds, developing vegetable production clusters, and establishing a digital infrastructure for agriculture. Financial support for shrimp production and a new National Cooperation Policy are also planned.
Additionally, the fertilizer subsidy has been reduced by 13.2% from the FY24 revised estimates, including both Urea and Nutrient Subsidies. This reduction may slightly negatively impact the fertilizer industry.
Overall, the budget allocation of ₹ 1.52 lakh crore allocated for agriculture and allied sectors is expected boost productivity, promote sustainable farming, enhance market access, and stimulate rural economic growth, ultimately leading to increased food security, better farmer incomes, and a more resilient agricultural sector.
5.Employment as a catalyst for holistic growth
The budget's allocation of ₹ 2 lakh crores over five years aims to empower 4.1 crore youth through employment and skilling initiatives.
These measures are expected to significantly reduce youth unemployment, enhance economic growth, and improve India's global competitiveness by bridging the skills gap through a comprehensive internship program in top companies.
This is expected to positively impact rural consumption and boost overall economic activity. Such initiatives are also anticipated to strengthen non-discretionary consumption, further supporting economic growth.
6.Commodities
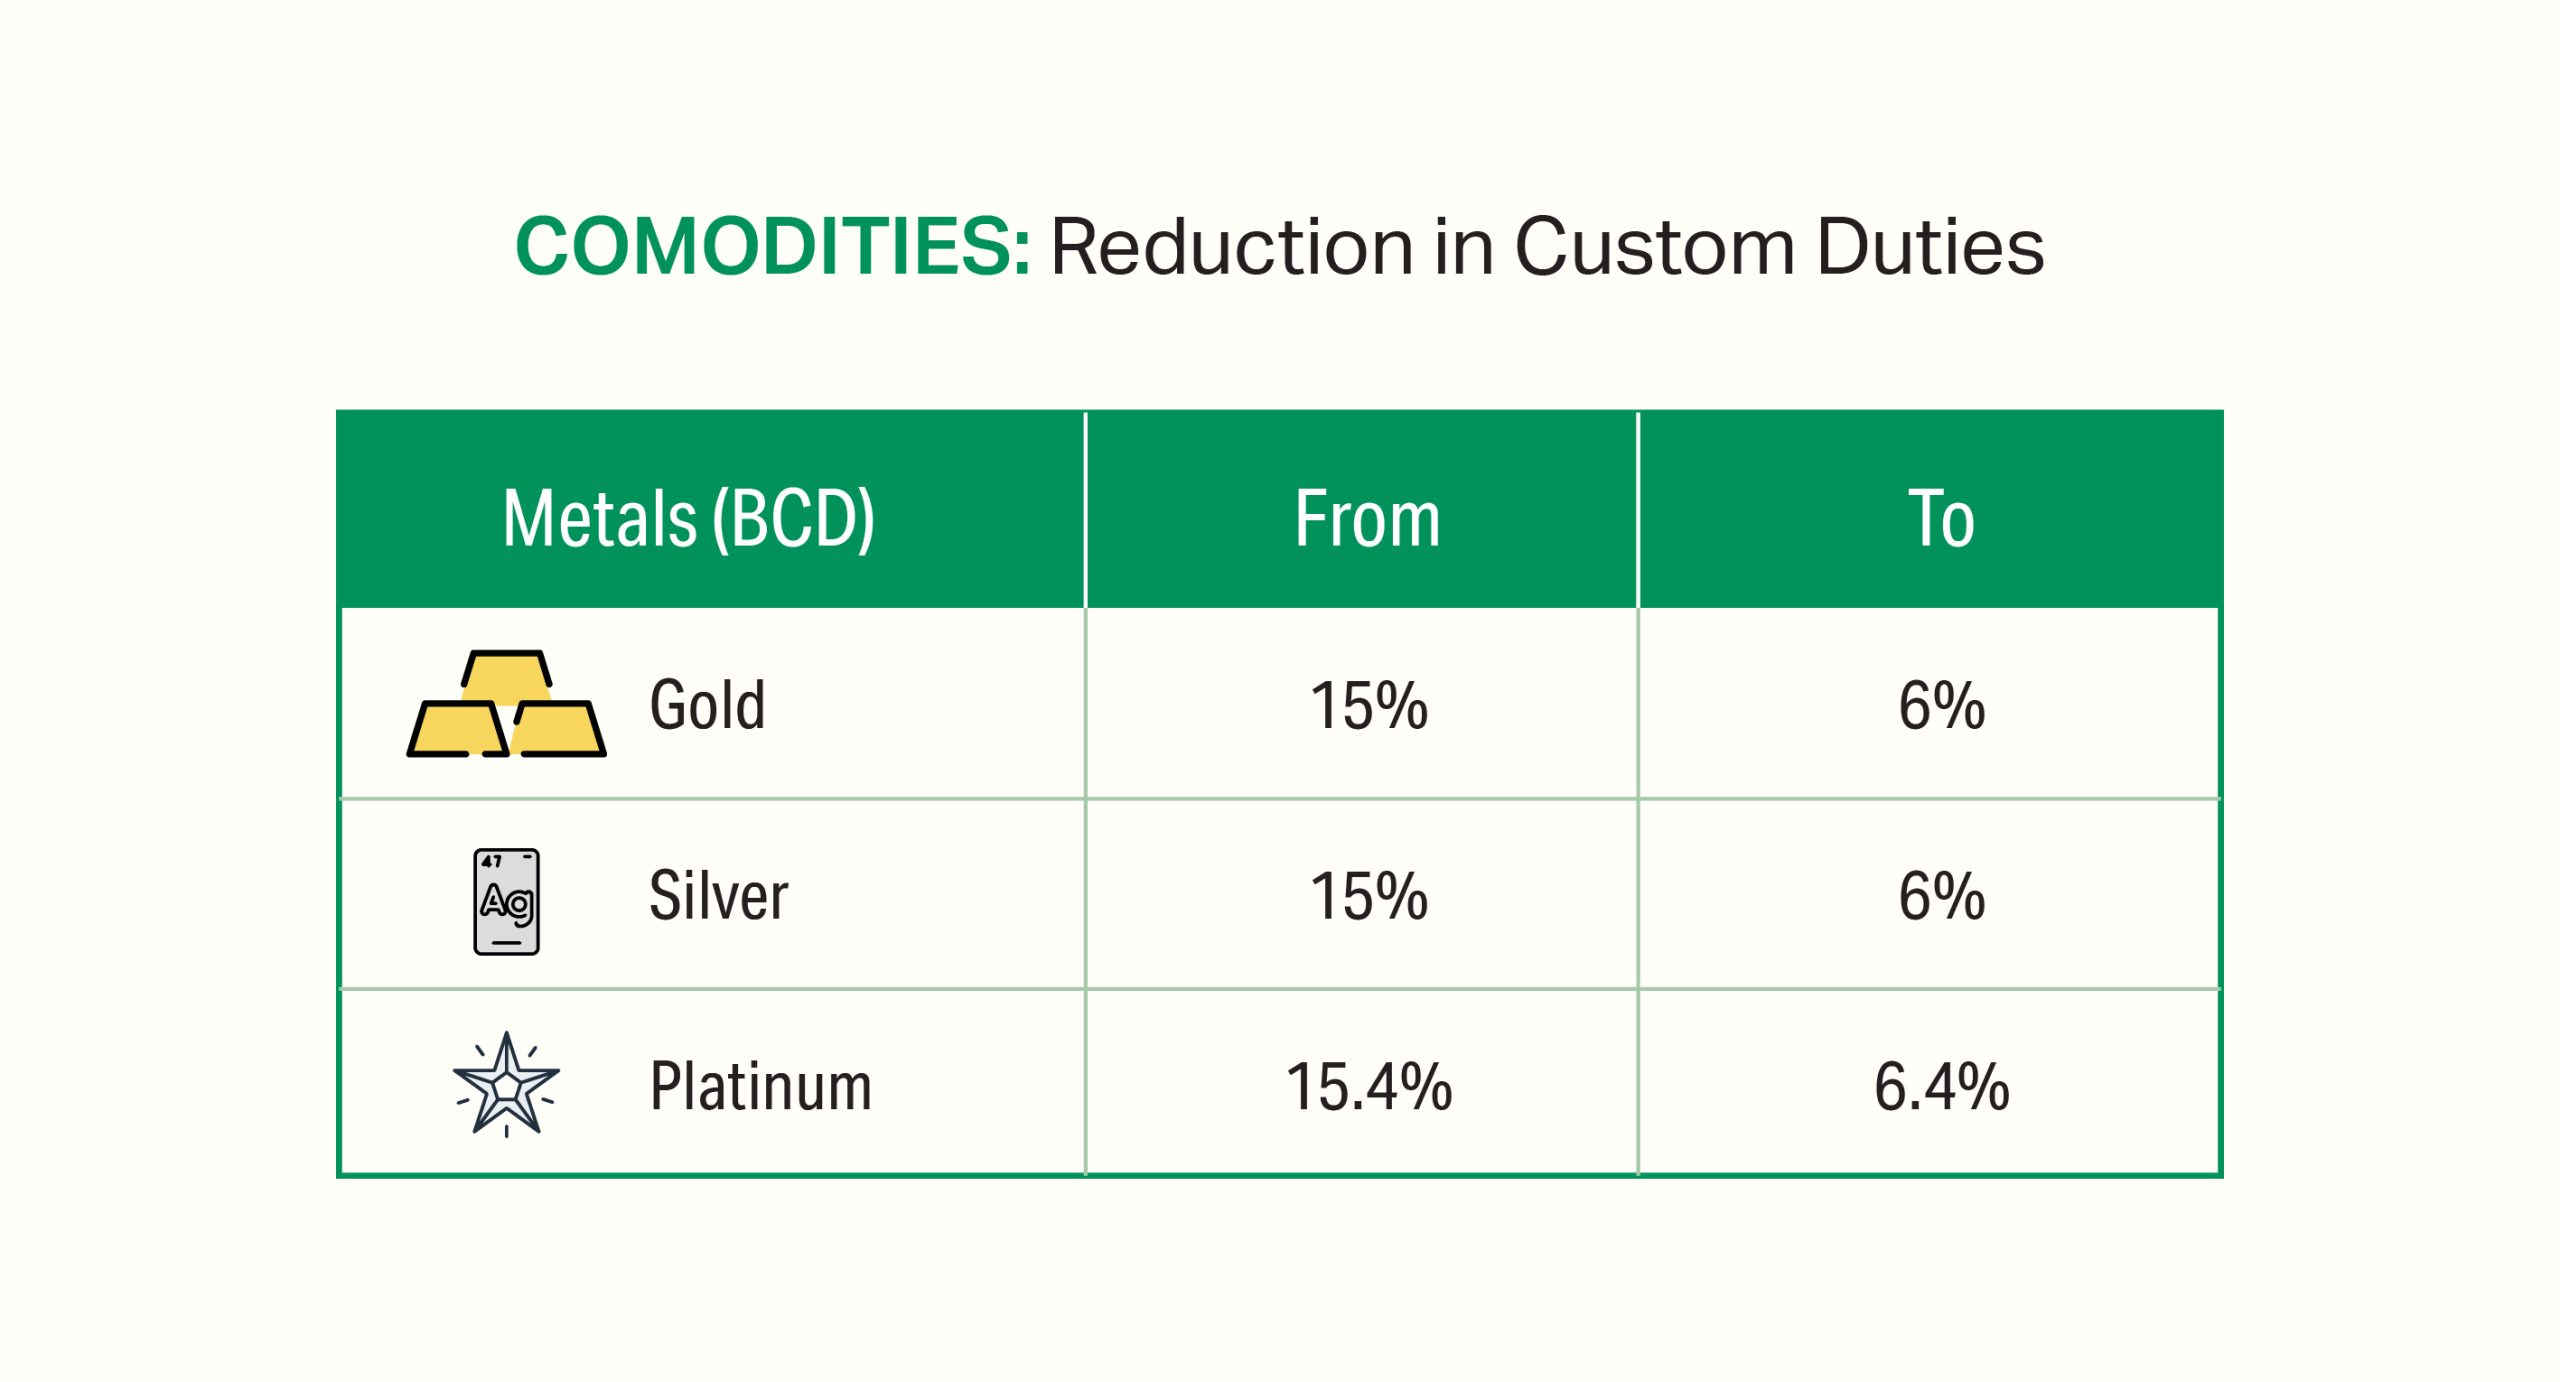
The recent significant duty cut is anticipated to benefit the domestic jewellery market by boosting demand, lowering prices, and encouraging increased investment in precious metals. By reducing smuggling and fostering a more competitive market, the government aims to create a conducive environment for jewellery businesses to thrive.
PART B
In 2022-23, over 58% of corporate tax revenue came from the simplified tax regime, and more than two-thirds of taxpayers have adopted the new personal income tax regime.
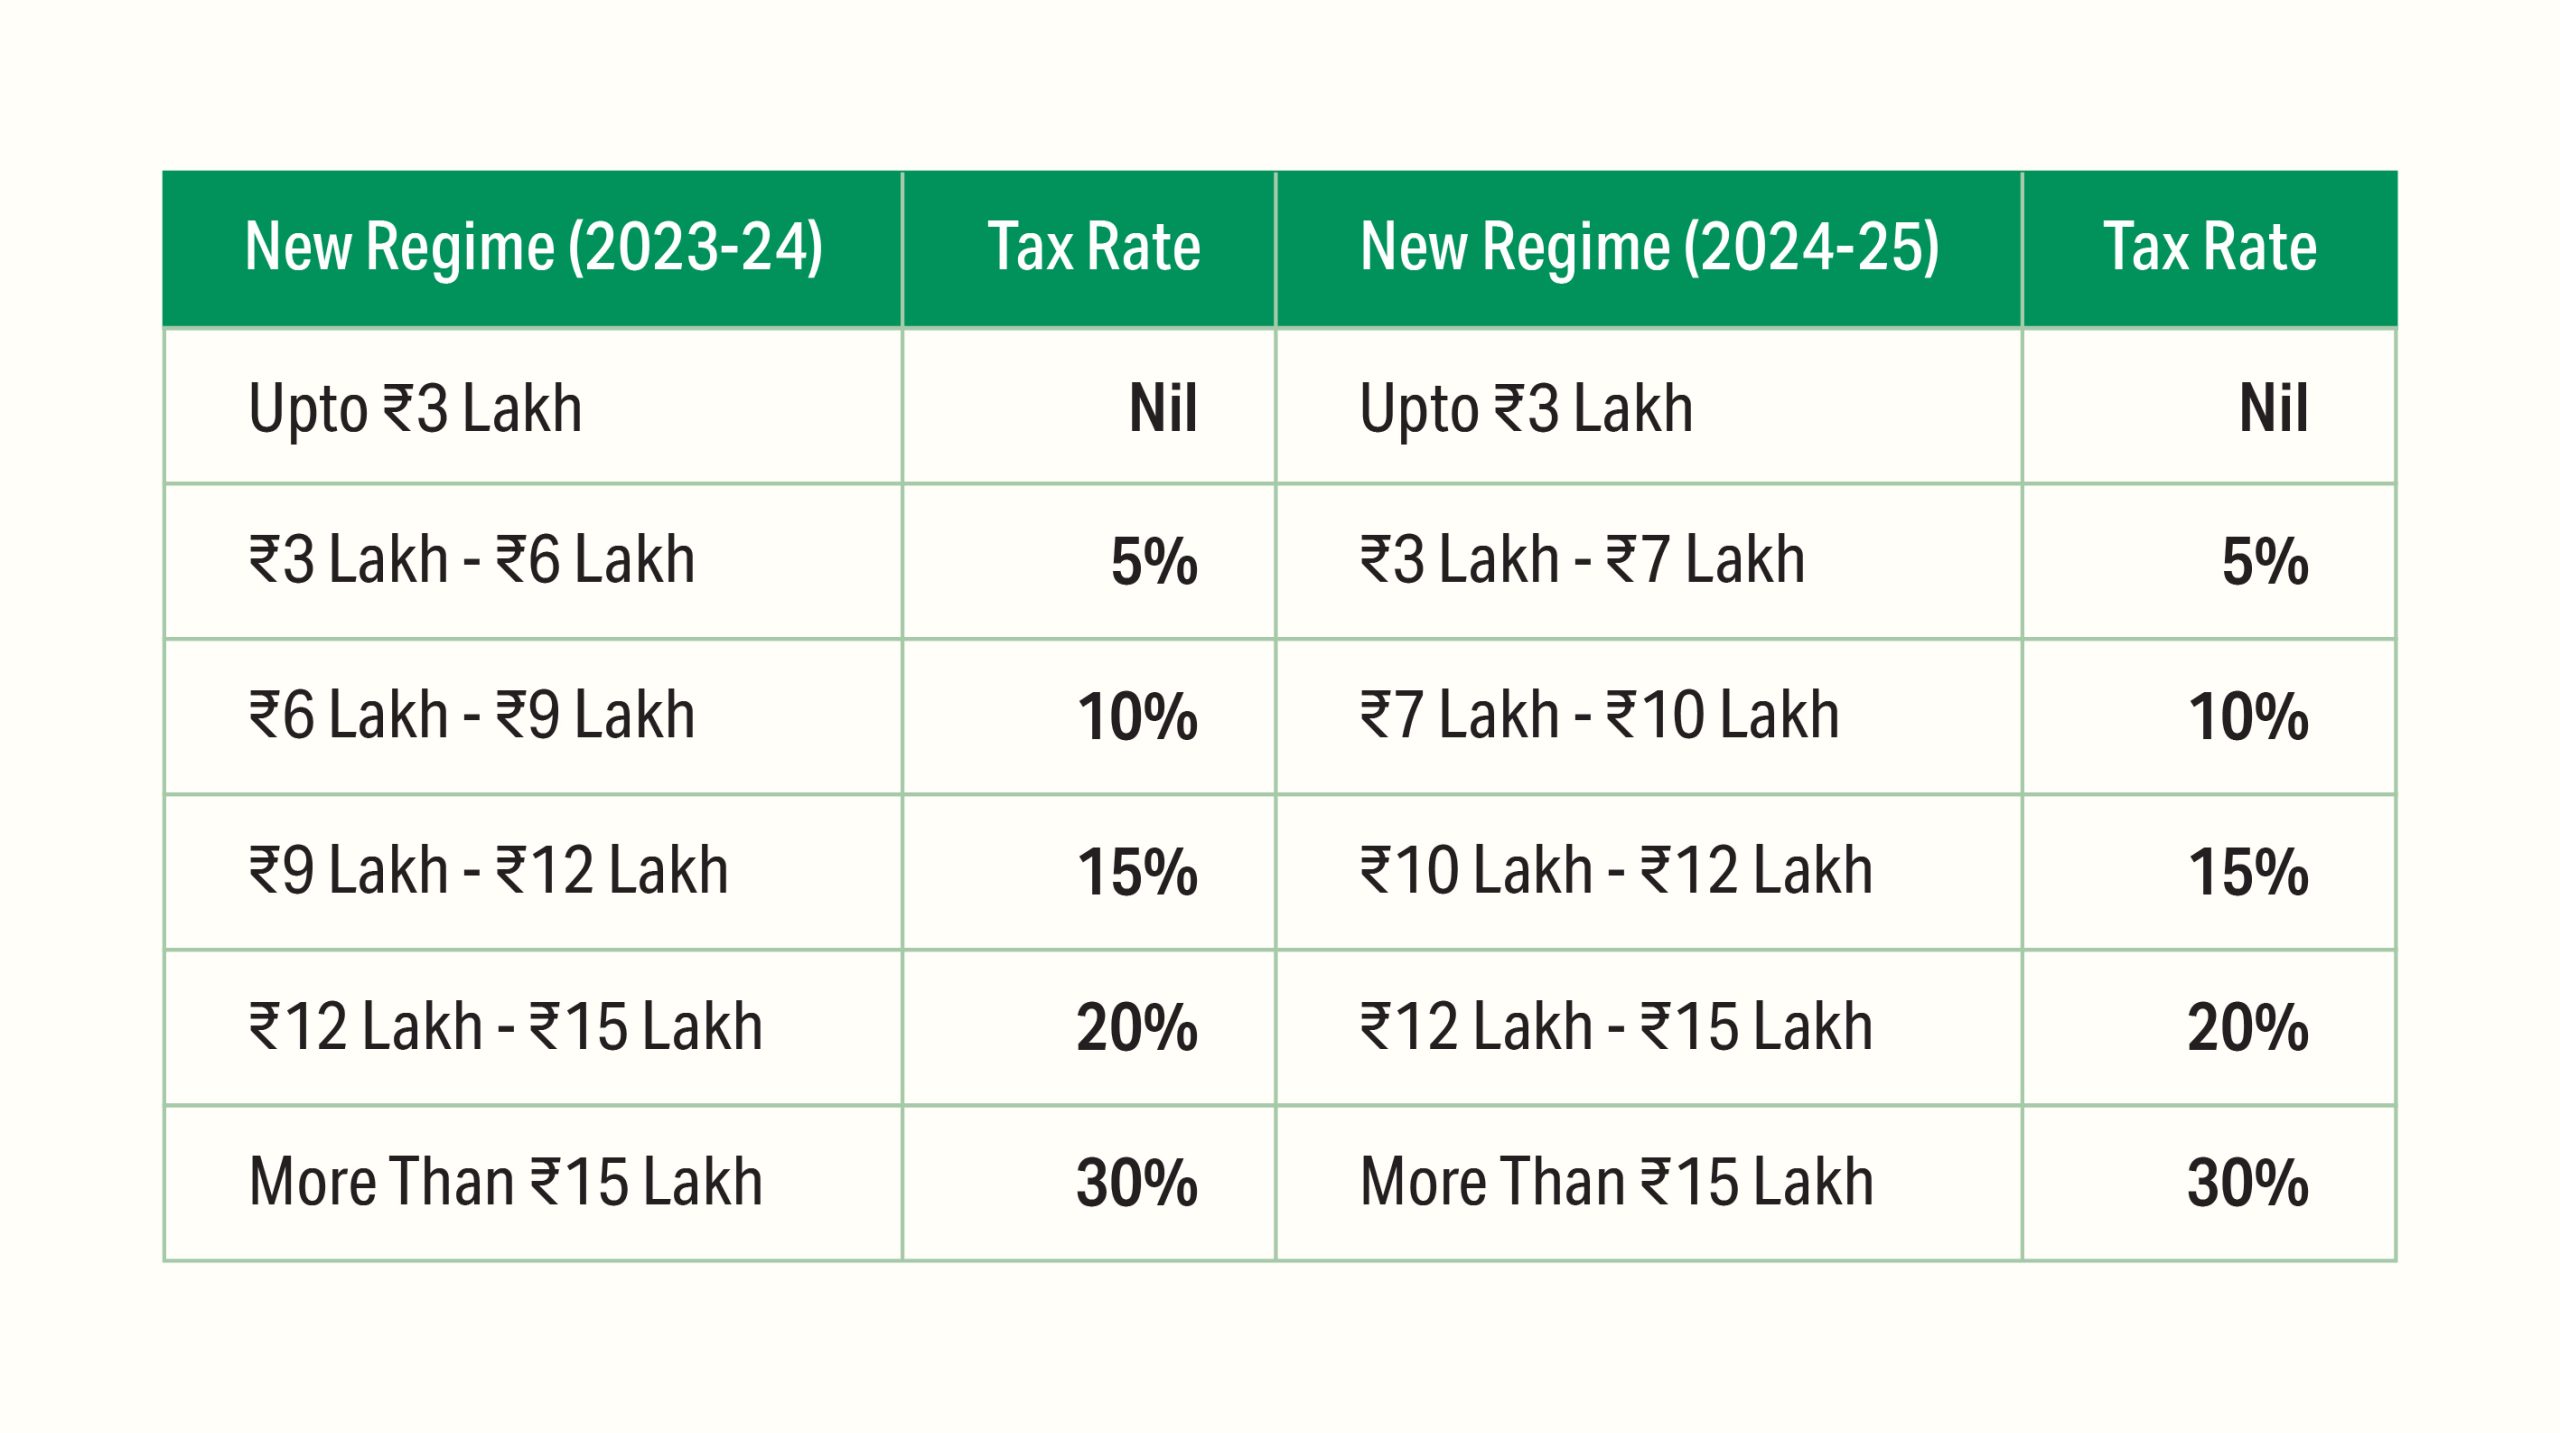
The revised tax slabs are expected to save salaried employees ~₹17,500, taking into account the standard deduction.
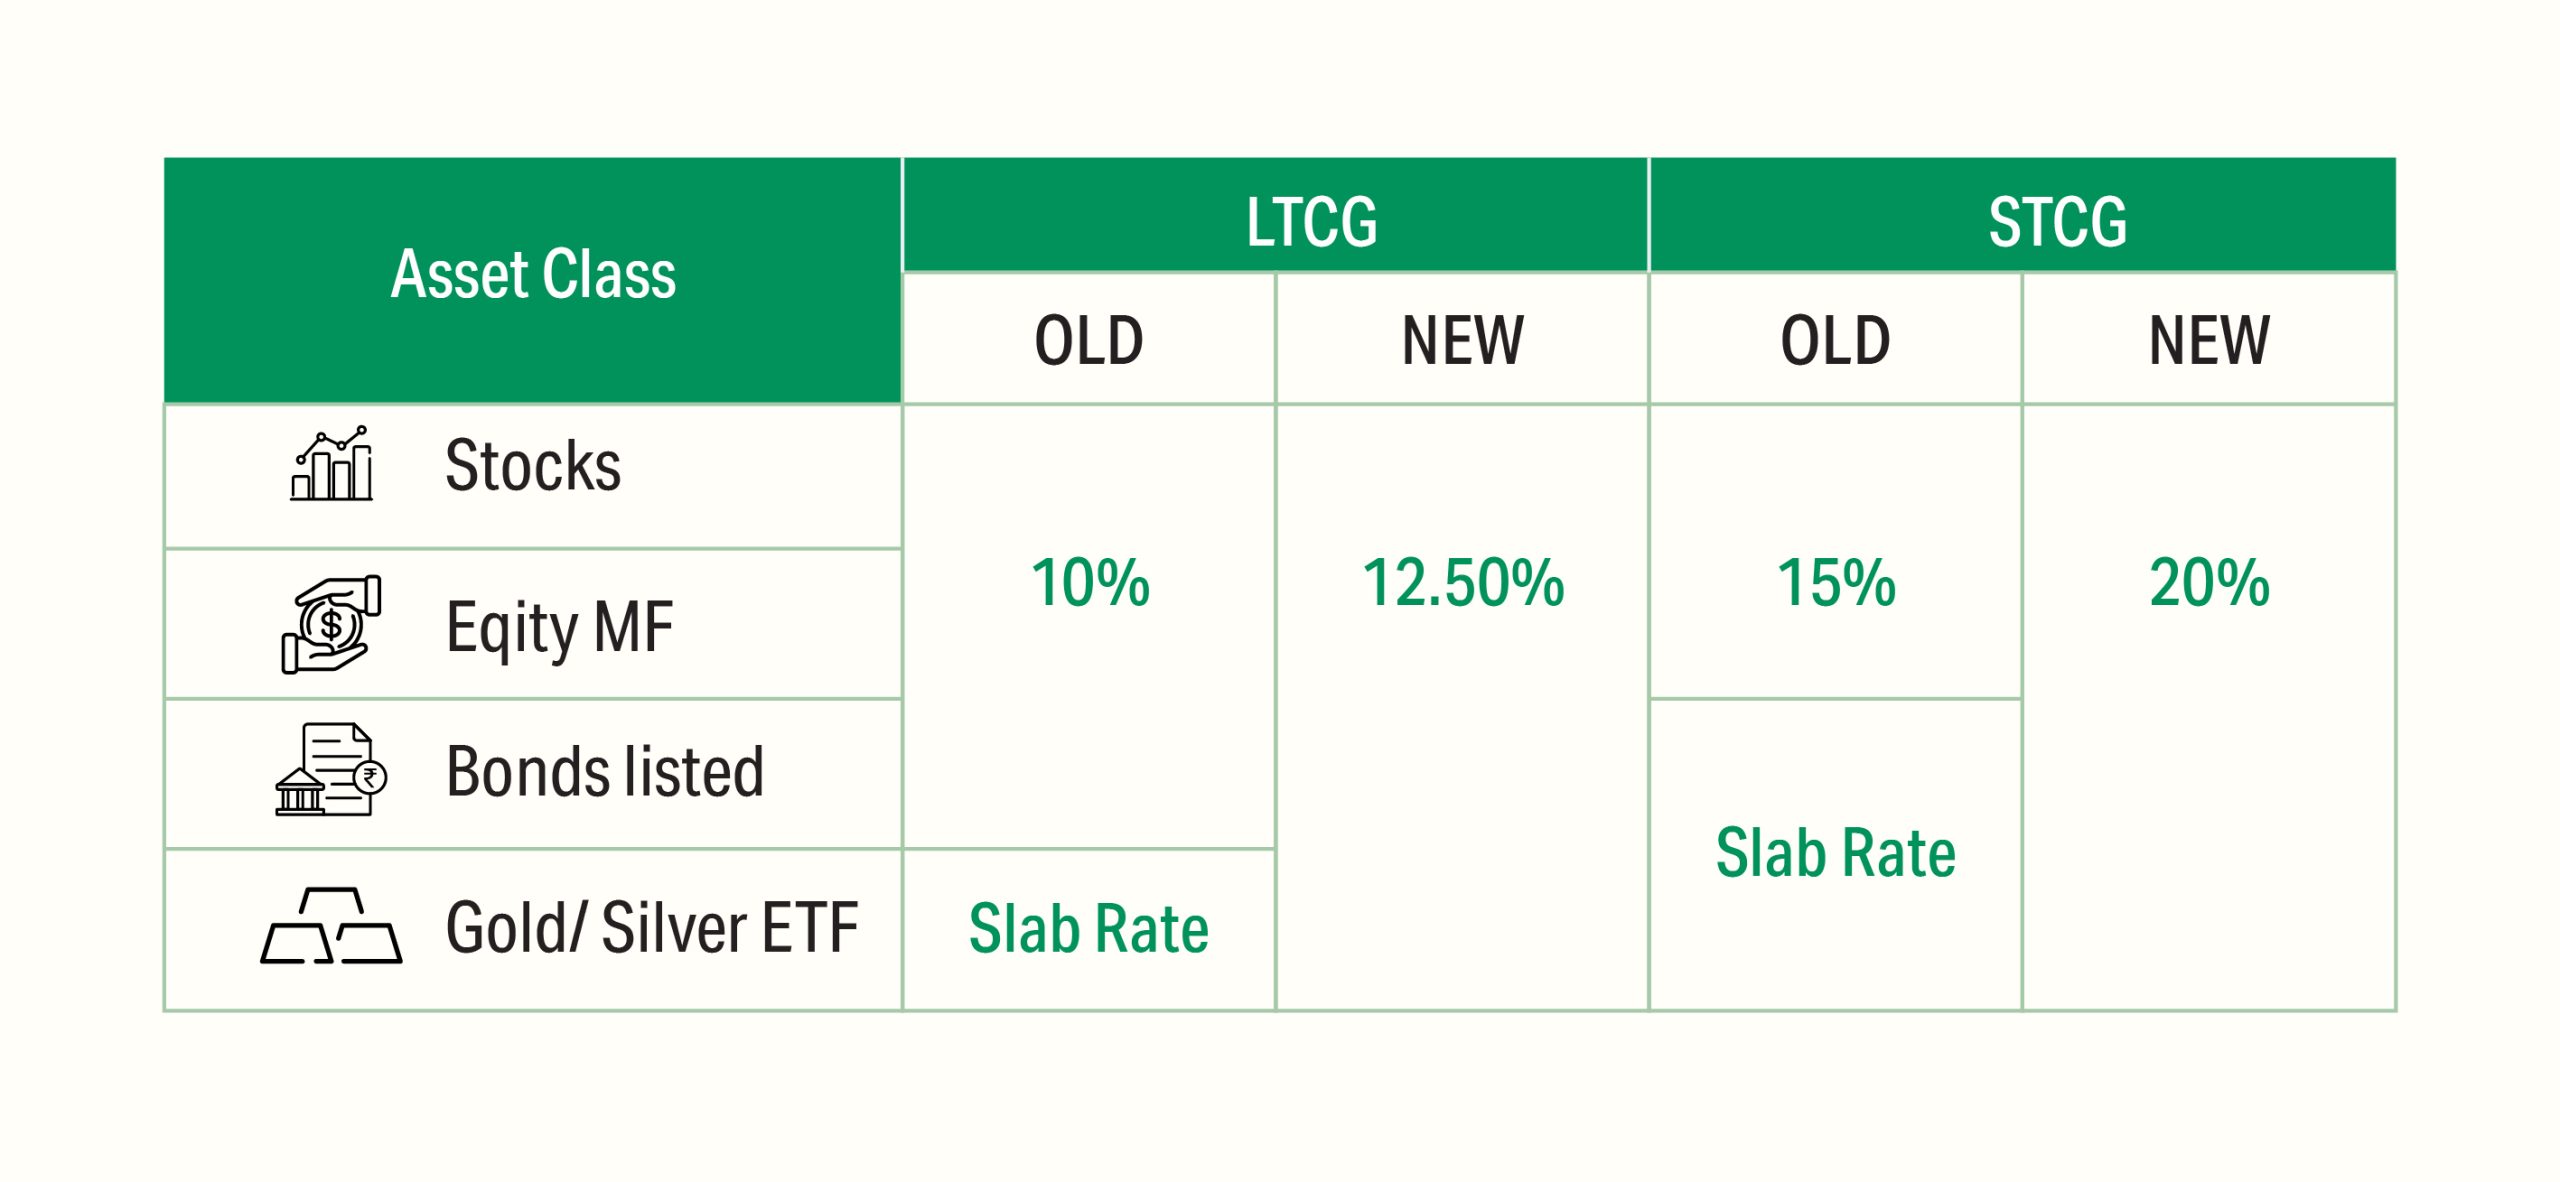
The finance minister has also removed the indexation benefits previously available for property sales and reduced the Long-Term Capital Gains (LTCG) tax on property from 20% to 12.5%. While this may impact short-term investments, it aims to simplify the computation of capital gains for both taxpayers and tax administration.
India's tax reforms reflect a commitment to creating a conducive environment for economic growth. India is attracting investments and encouraging industrial development by reducing corporate tax rates, particularly for new manufacturing units. The simplified personal income tax regime has reduced compliance burdens and has been well-received by taxpayers, indicating a positive shift towards a more efficient tax system.
In 2018, when the capital gains tax was introduced, adverse economic conditions occurred, and there were high corporate debts. Still, today's resilient economic environment and strong corporate balance sheets support our confidence that these policies will drive further growth.
In comparison to developed countries, India's tax rates are competitive, and its ongoing reforms are positioning it as an attractive destination for business and investment, signaling a robust trajectory toward development.
Disclaimers and Disclosures
SEBI Registration No. :INH000017338, IN/AIF3/24-25/1571, IN/AIF2/24-25/1607 | BASL Membership ID: 6276
Investment in Securities Market are subject to market risks. Read all related documents carefully before investing. The securities quoted are for illustration only and are not recommendatory. Registration granted by SEBI, membership of a SEBI recognized supervisory body (if any) and certification from NISM in no way guarantee performance of the intermediary or provide any assurance of returns to investors.

Recycling & Refurbishment
Recycling: Turning Waste Into Opportunity (Part II)
In the previous blog, we touched upon the favourable economics of recycling, highlighting the potential savings associated with using recycled materials. In the current blog, we will discuss more about the recycling industry and how we can shift our investing gears towards an investment opportunity. We have identified three distinct industries within this sector that we
In the previous blog, we touched upon the favourable economics of recycling, highlighting the potential savings associated with using recycled materials. In the current blog, we will discuss more about the recycling industry and how we can shift our investing gears towards an investment opportunity. We have identified three distinct industries within this sector that we will be discussing in the current blog: Plastic Packaging, Lead and Tyre Industry.
There have been regulatory changes happening across various industries. Extended Producer Responsibility (EPR) India is one such initiative that aims to place responsibility on producers for the proper disposal of waste and extend their responsibility to the post-consumer stage of a product’s life cycle. Let's have a look at EPR policies in different industries:
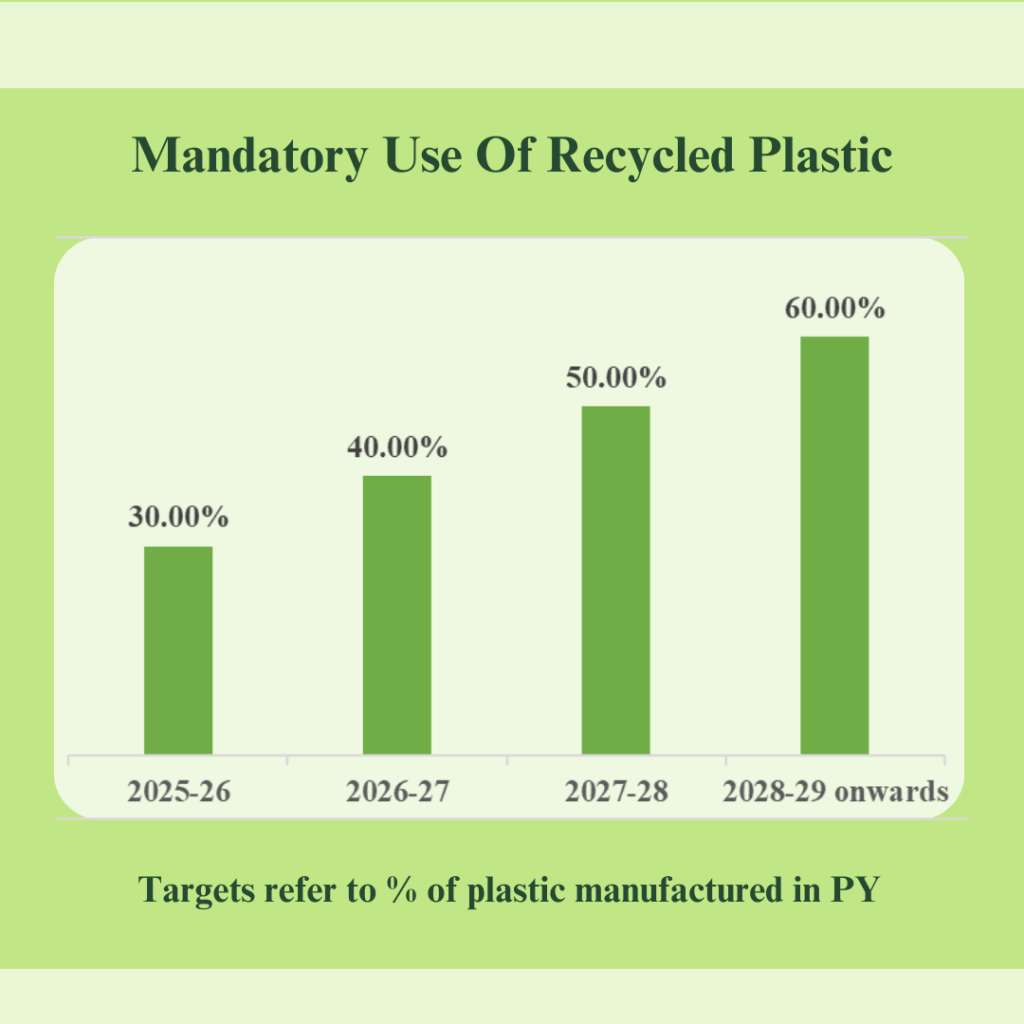
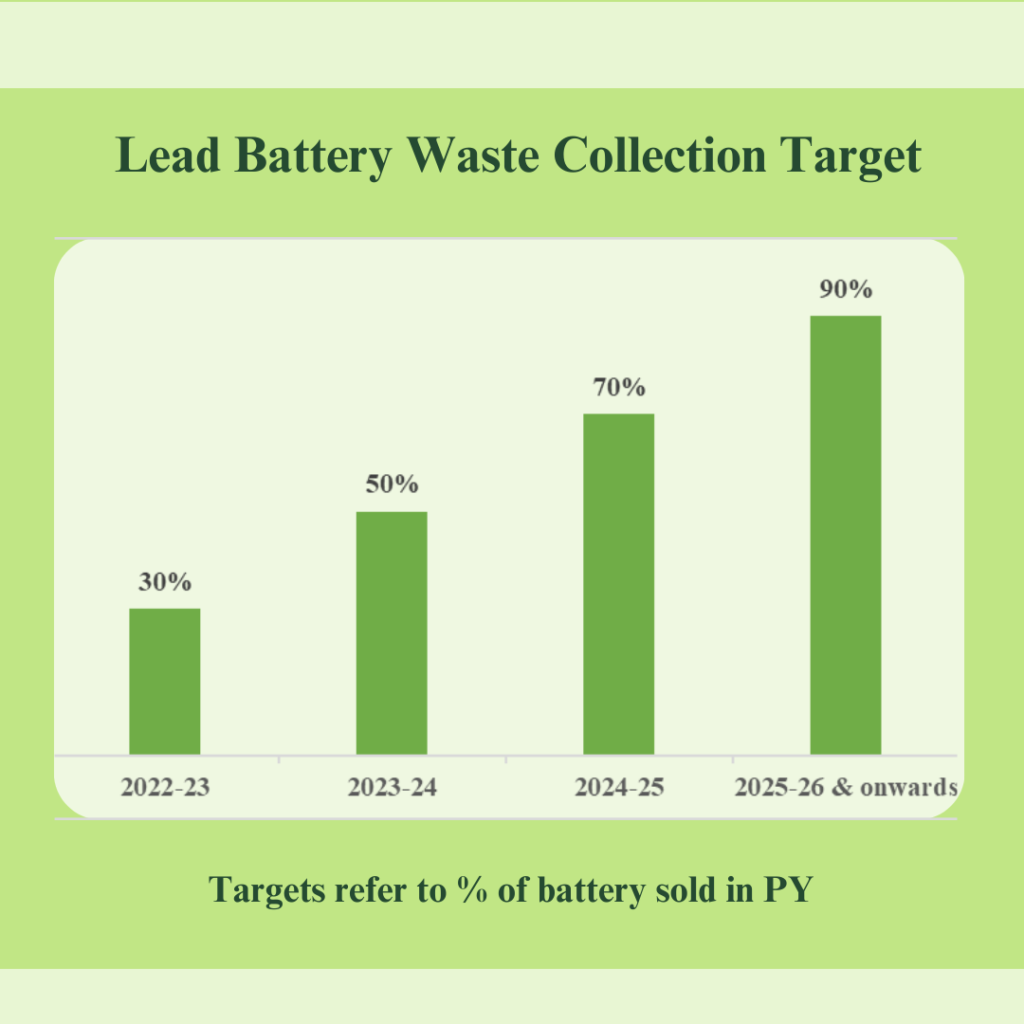
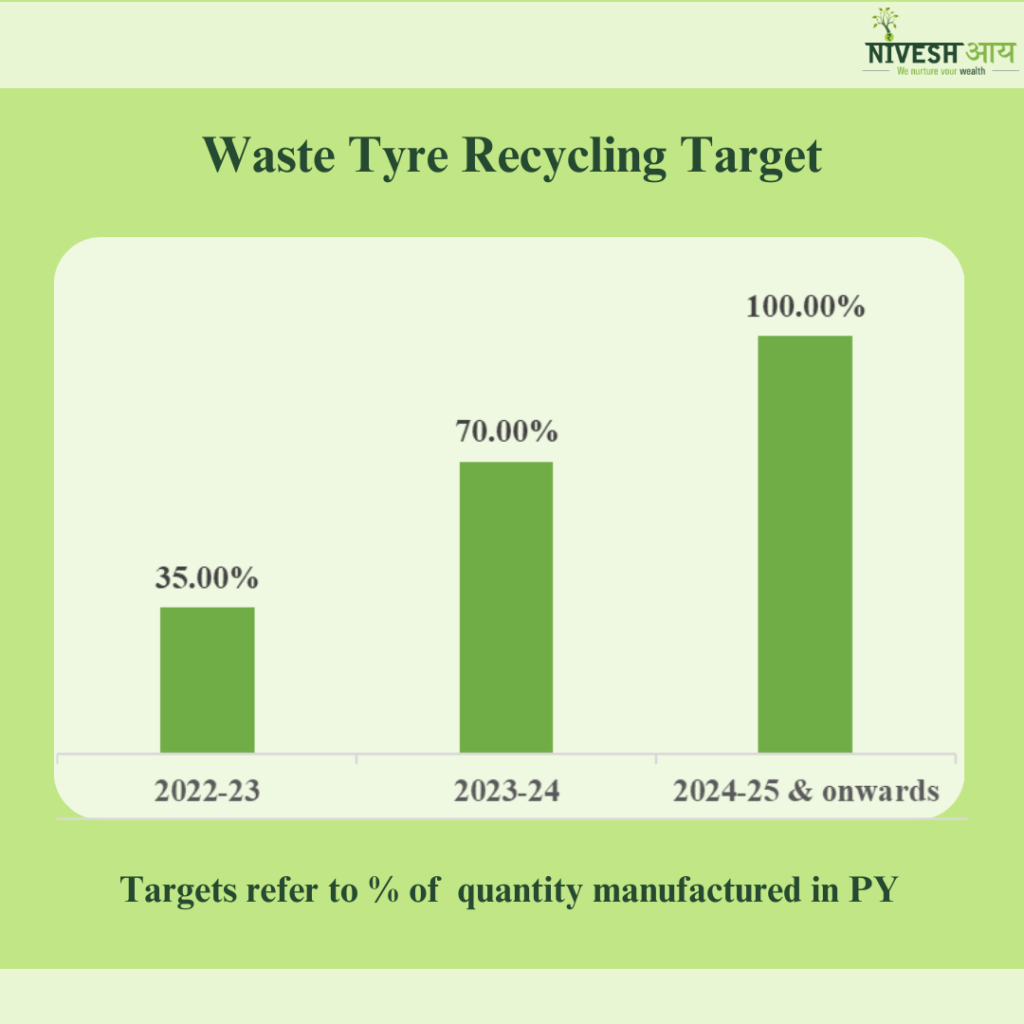
Now we will discuss how these rules are going to benefit each recycling industry. Let’s start with
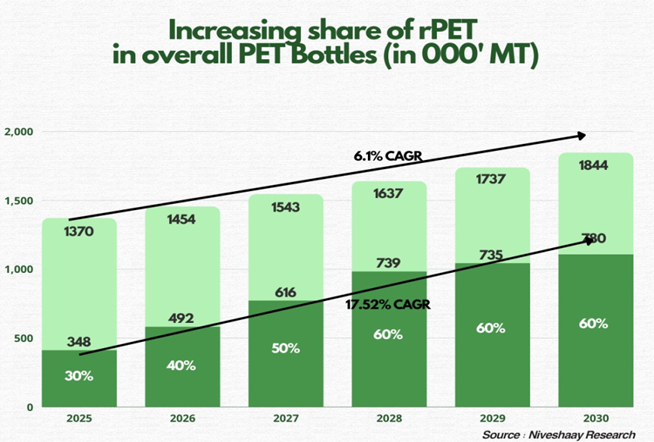
Bottle producers had no incentives or penalties involved to use recycled material, but now, with EPR implementation, the plastic recycling industry is set to grow. The use of recycled plastic was prohibited in food contact applications, but in 2022, the Food Safety and Standards Authority of India (FSSAI) issued a direction, that permits the use of recycled plastics (food-grade rPET) as food packaging. Many brands, like Coco-Cola and Pepsi are already committing to using rPET for their packaging. Overall PET bottle market is expected to grow by 6.1% CAGR and the estimated derived demand of the rPET market arising because of EPR rules is expected to grow at a CAGR of 17.52%.
Opportunity in Fashion Industry
In India, recycled yarn was considered only if it was more economical. Things have changed for good in last few years, and there will be a higher demand of recycled materials in the future, due to the following:

To produce the popular Nike Air shoes, the company is able to reuse more than 90% of the waste generated from Air shoe manufacturing, often turning it into new Air bags sole. This ensures all Nike Air soles are made with at least 50% recycled material. Likewise, other brands like H&M, Zara, Under Armour etc. have also set sustainability targets. For these companies, using recycled polyester is one of the easiest ways to achieve those targets.
The company is the largest PET bottle recycling company in India, having 30 years of experience and a domestic market share of 16%. It is into the manufacturing of Recycled Polyester Staple Fibres (RPSF) and rPET Yarn. Revenue mix : 85% - RPSF and 15% - rPET Yarn.
Why can Ganesha Ecosphere Limited grow well ?
After the Government approved bottle to bottle (B2B) recycling for food-grade applications, Ganesha Ecosphere grasped the opportunity with both hands and entered into the segment of manufacturing rPET chips used in making recycled bottles. This will create an additional revenue stream for the company. According to a survey, 60% people in India are willing to pay a premium for sustainable fashion products. To further address this opportunity, the company introduced branded and non-commoditised value-added products under the new ‘Go Rewise’ brand. The EPR policy and other government regulations along with increasing awareness towards sustainability will help the company grow well.
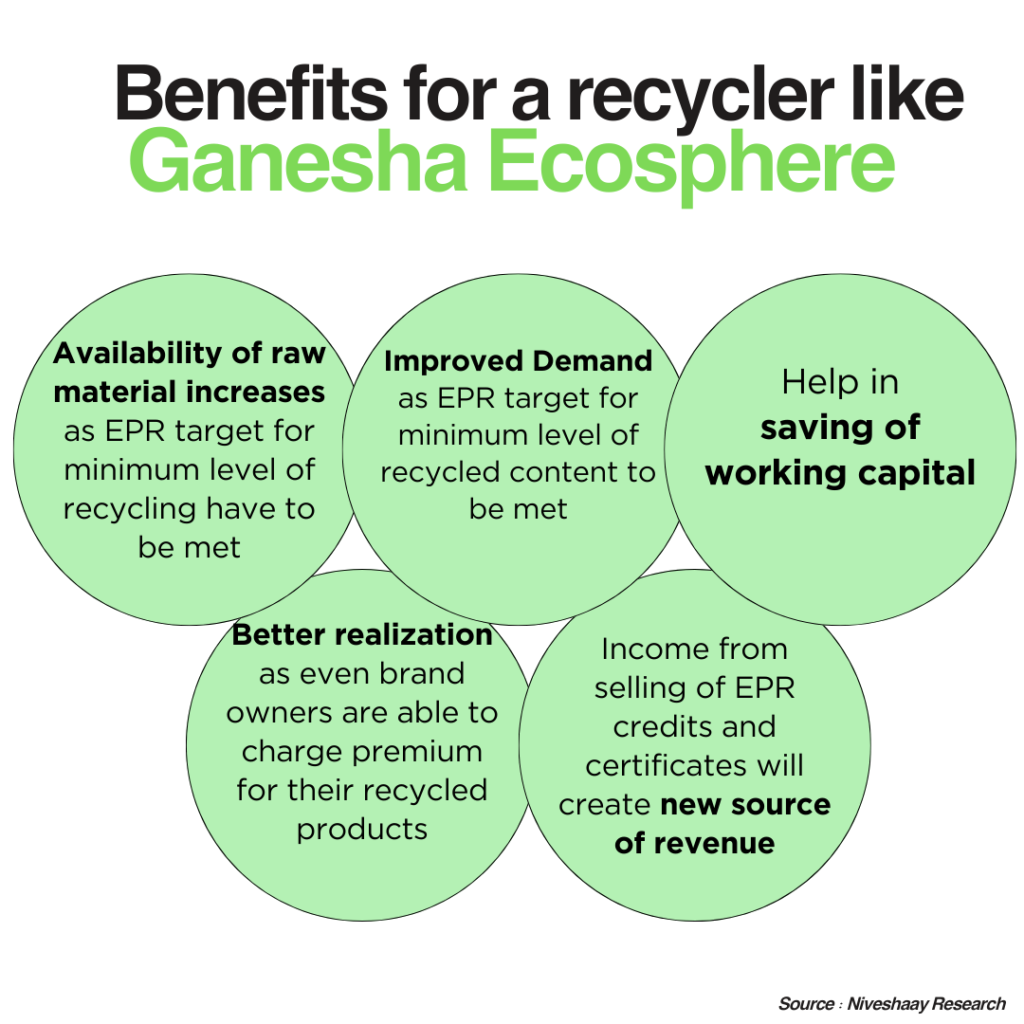
Opportunity for Lead Recycling Industry
Primary lead scrap that is discarded causes huge environmental damage and pollution. However, recycled lead uses only 30-40% of the energy required to extract primary lead from its ore. Lead as a commodity can be remelted and recycled an infinite number of times without any loss in its properties. Therefore, a lot of industries prefer recycled lead over primary lead. The recycled lead is primarily consumed by Lead-Acid Battery manufacturers followed by other industries like Glass, Ceramic, Pharmaceuticals, Paint, etc.
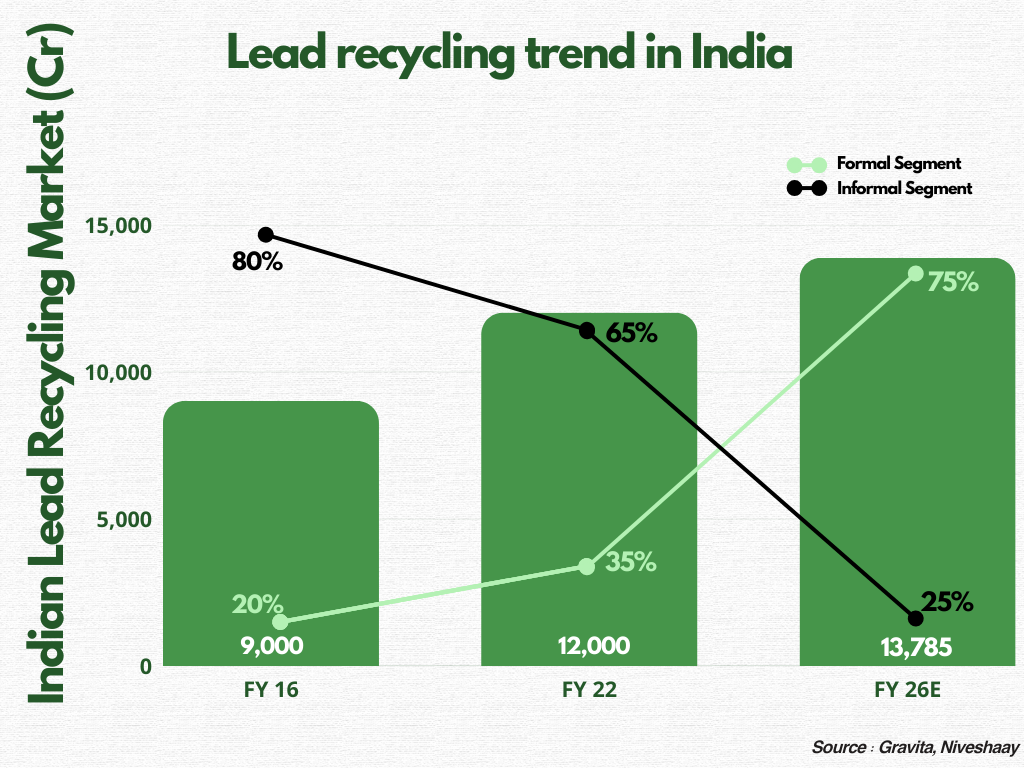
The lead recycling formal segment occupied only 35% of the lead recycling market in India till FY22. However, with the growing government’s measures to strengthen regulations and enforce strict standards, the formal segment share in the lead recycling market is expected to rise to 75% by FY26. Also, as per various studies, the increase in lead demand will be fuelled by recycled lead and demand for primary lead is expected to remain the same. With organisation of the lead recycling market, top existing players in the lead recycling industry have the potential to become industry leaders.
Gravita India Ltd is one of the largest lead producer in India, established in the year 1992, with a market share of ~18- 19% in the organised lead recycling.
Revenue Mix: Lead Recycling (84%), Aluminium Recycling (9%), Plastic Recycling (6%) and Turnkey Solutions (1%)
Why can Gravita India Limited grow well ?
The attractive shift to the formal sector presents an opportunity for organised recycled lead players like Gravita India Ltd. because it already has 18% market share in the organised sector. PAN India presence and plants near port reduces logistic cost for Gravita. Scraps procured overseas are cheaper than scraps procured in India. Its deep presence in Asia, Africa, Middle East, Europe and America ensures raw materials are available at competitive prices.
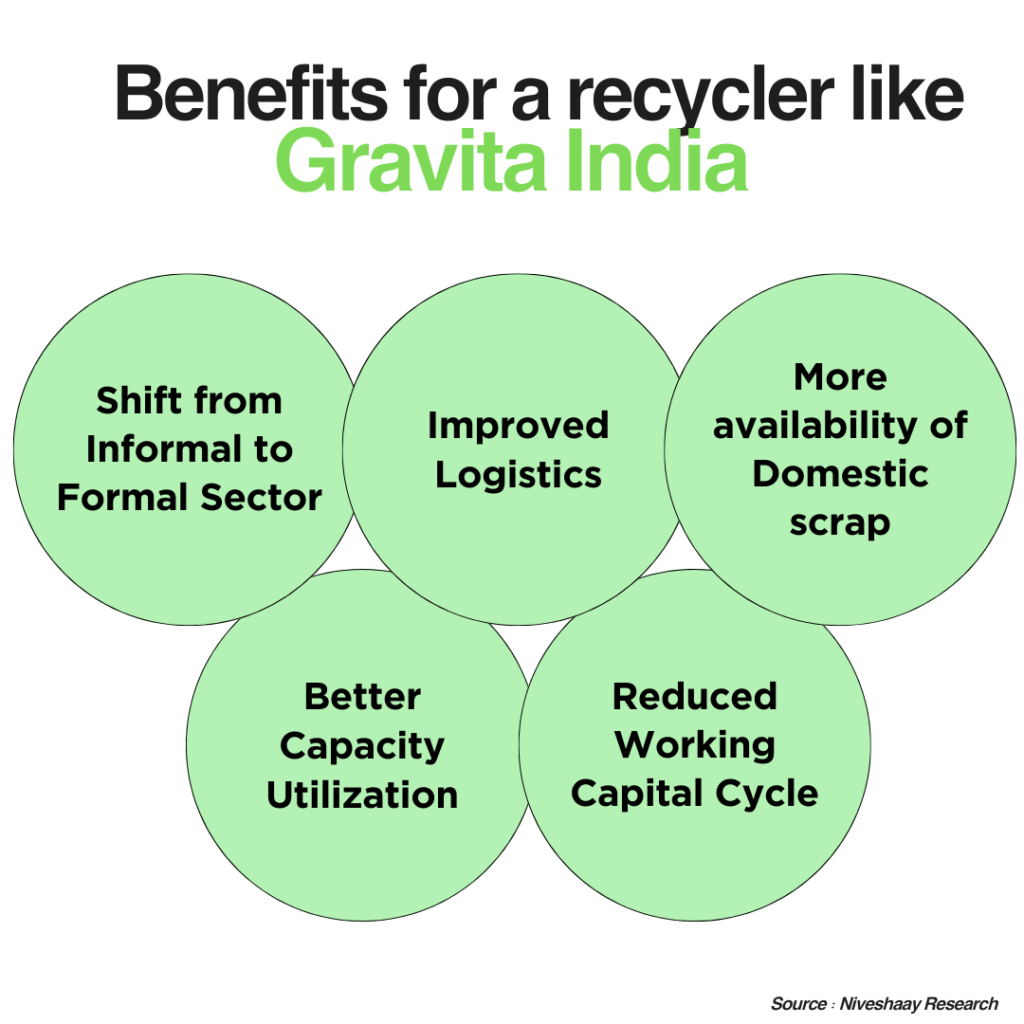
Opportunity for Tyre Recycling:
India is amongst the world’s largest manufacturer of reclaimed rubber. Reclaimed Rubber is one of the most prominent material made from waste tyres. Out of total rubber content in tyre, currently 3-4% is reclaimed rubber. Due to rising awareness regarding potential saving and eco-friendly alternative, the reclaim rubber demand is already increasing.
Reclaim Rubber has the highest weightage for eligible quantity for EPR certificates.
Several tyre manufacturing companies like Bridgestone, Michelin, Continental and Pirelli across the globe have sustainability targets that envisage higher use of recycled rubber. Indian tyre companies like Apollo, JK tyre and CEAT, following in the footsteps of global peers, are also progressing towards higher usage of recycled rubber
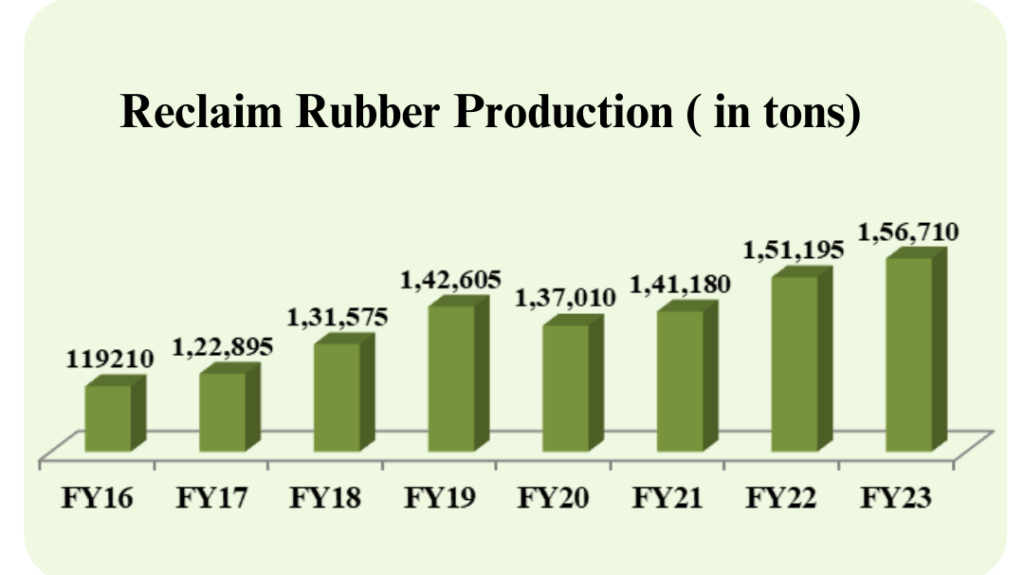
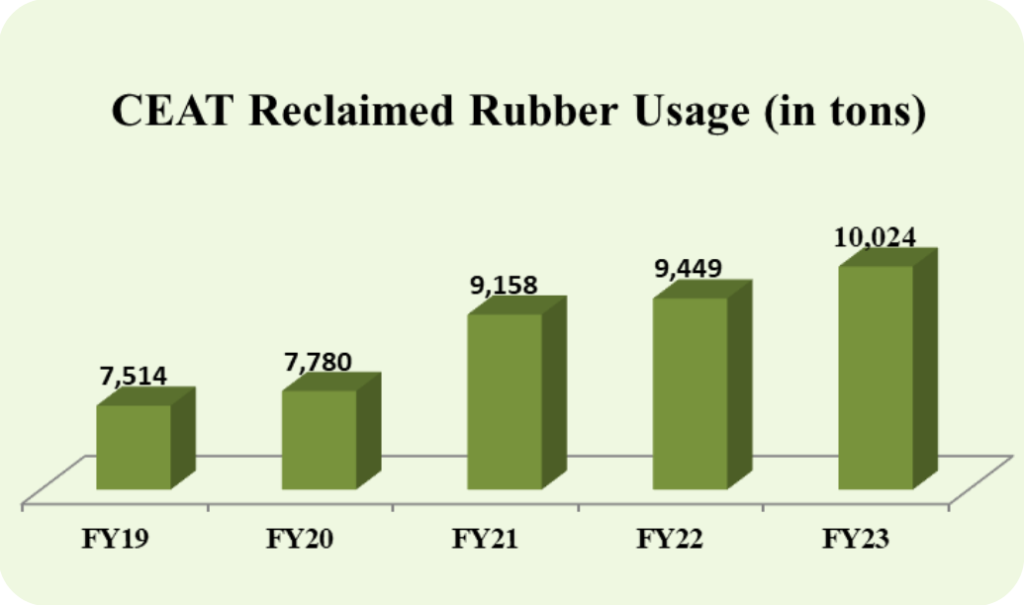
GRP Ltd. is one of the top three manufacturers of reclaimed rubber globally and the largest in India. The company claims to have an 18% domestic market share and accounts for 50% of India’s exports of reclaimed rubber. Company has the following segments :
Why GRP Ltd. can do well ?
With the introduction of EPR policy, the current 3-4% reclaim rubber content is expected to move up to 7-8% for meeting recycling targets for producers pushing the overall reclaim rubber demand. Around 70% application of reclaimed rubber is for tyres and tubes. Inherent growth of automobile industry along with increased percentage usage is going to help increase the demand of reclaimed rubber.
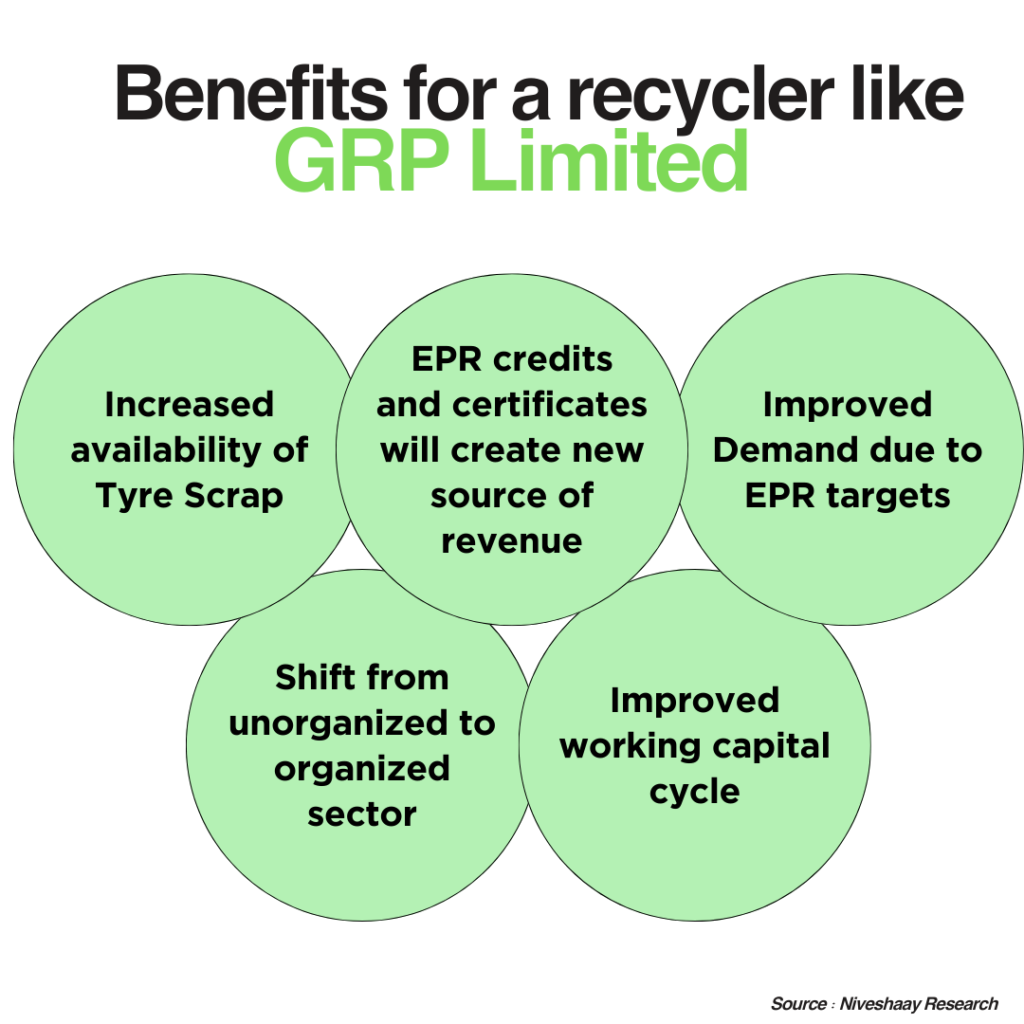
Niveshaay’s Scuttlebutt
We visited India’s biggest plastic industry exhibition held at Pragati Maidan, Delhi in February 2023 organized by the Plast India Foundation. The exhibition marked the presence of around 1500+ exhibitors, both domestic and international, from countries like USA, Australia, UK, Switzerland, UAE, Germany, and Austria covering every part of the plastic product supply chain. There was one hall completely dedicated to the recycling segment.
Few takeaways from the visit:
Disclaimer:
Investment in securities market is subject to market risks. Read all the related documents carefully before investing. The content in these posts/articles is for informational and educational purposes only and should not be construed as professional financial advice and nor to be construed as an offer to buy /sell or the solicitation of an offer to buy / sell any security or financial products.
Registration granted by SEBI, membership of BASL and certification from NISM in no way guarantee performance of the intermediary or provides any assurance of returns to investors. The securities quoted are for illustration only and are not recommendatory.
Disclaimers and Disclosures
SEBI Registration No. :INH000017338, IN/AIF3/24-25/1571, IN/AIF2/24-25/1607 | BASL Membership ID: 6276
Investment in Securities Market are subject to market risks. Read all related documents carefully before investing. The securities quoted are for illustration only and are not recommendatory. Registration granted by SEBI, membership of a SEBI recognized supervisory body (if any) and certification from NISM in no way guarantee performance of the intermediary or provide any assurance of returns to investors.
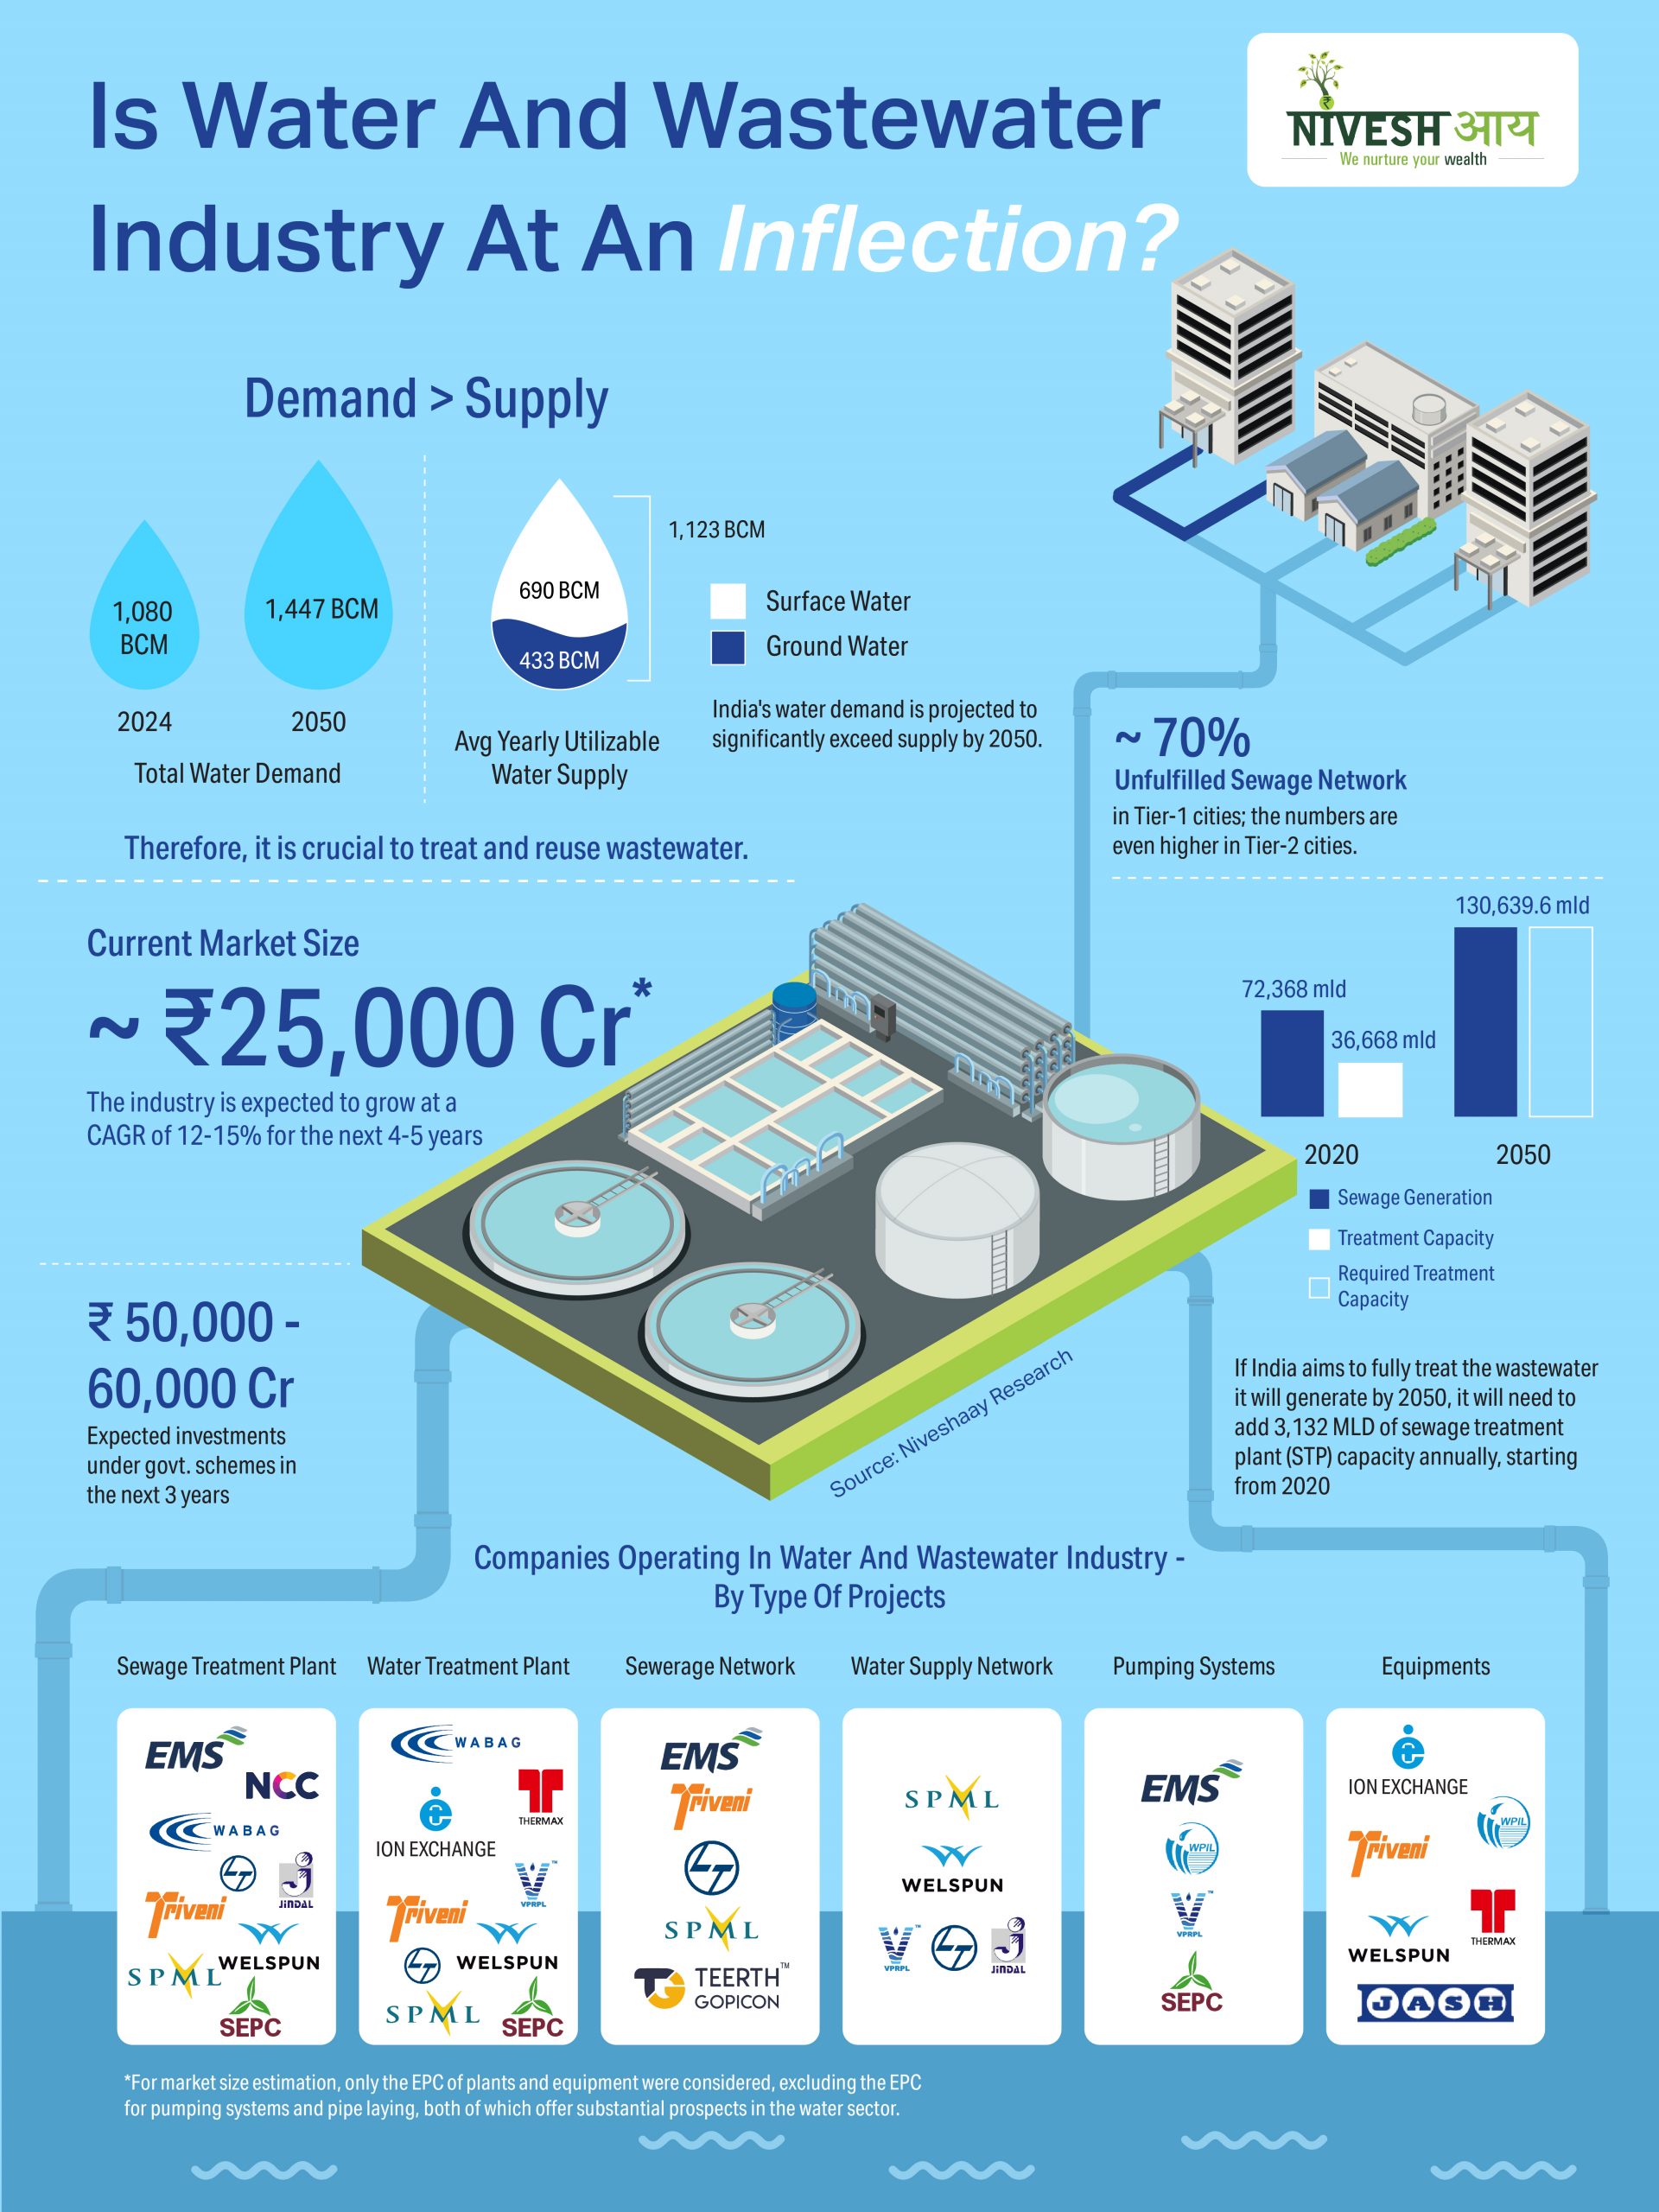
Water & Waste Water Industry
Is Water and Wastewater Industry at an Inflection?
It is crucial to address the growing water demand, which now exceeds supply in India. There is a significant gap in treatment capacity and related infrastructure. Reduced water availability threatens both agricultural and industrial activities, potentially leading to increased food prices and economic instability. With the sector gaining widespread attention and robust governmental initiatives like
It is crucial to address the growing water demand, which now exceeds supply in India. There is a significant gap in treatment capacity and related infrastructure. Reduced water availability threatens both agricultural and industrial activities, potentially leading to increased food prices and economic instability. With the sector gaining widespread attention and robust governmental initiatives like AMRUT, the National Mission for Clean Ganga, Jal Jeevan Mission, and Swachh Bharat Mission, the industry is poised for significant growth. This presents an opportunity for businesses in this sector to expand and thrive. Dive into our latest blog to understand the key drivers behind this evolving industry. https://niveshaay.com/blog/2024/07/20/indian-water-and-wastewater-industry/
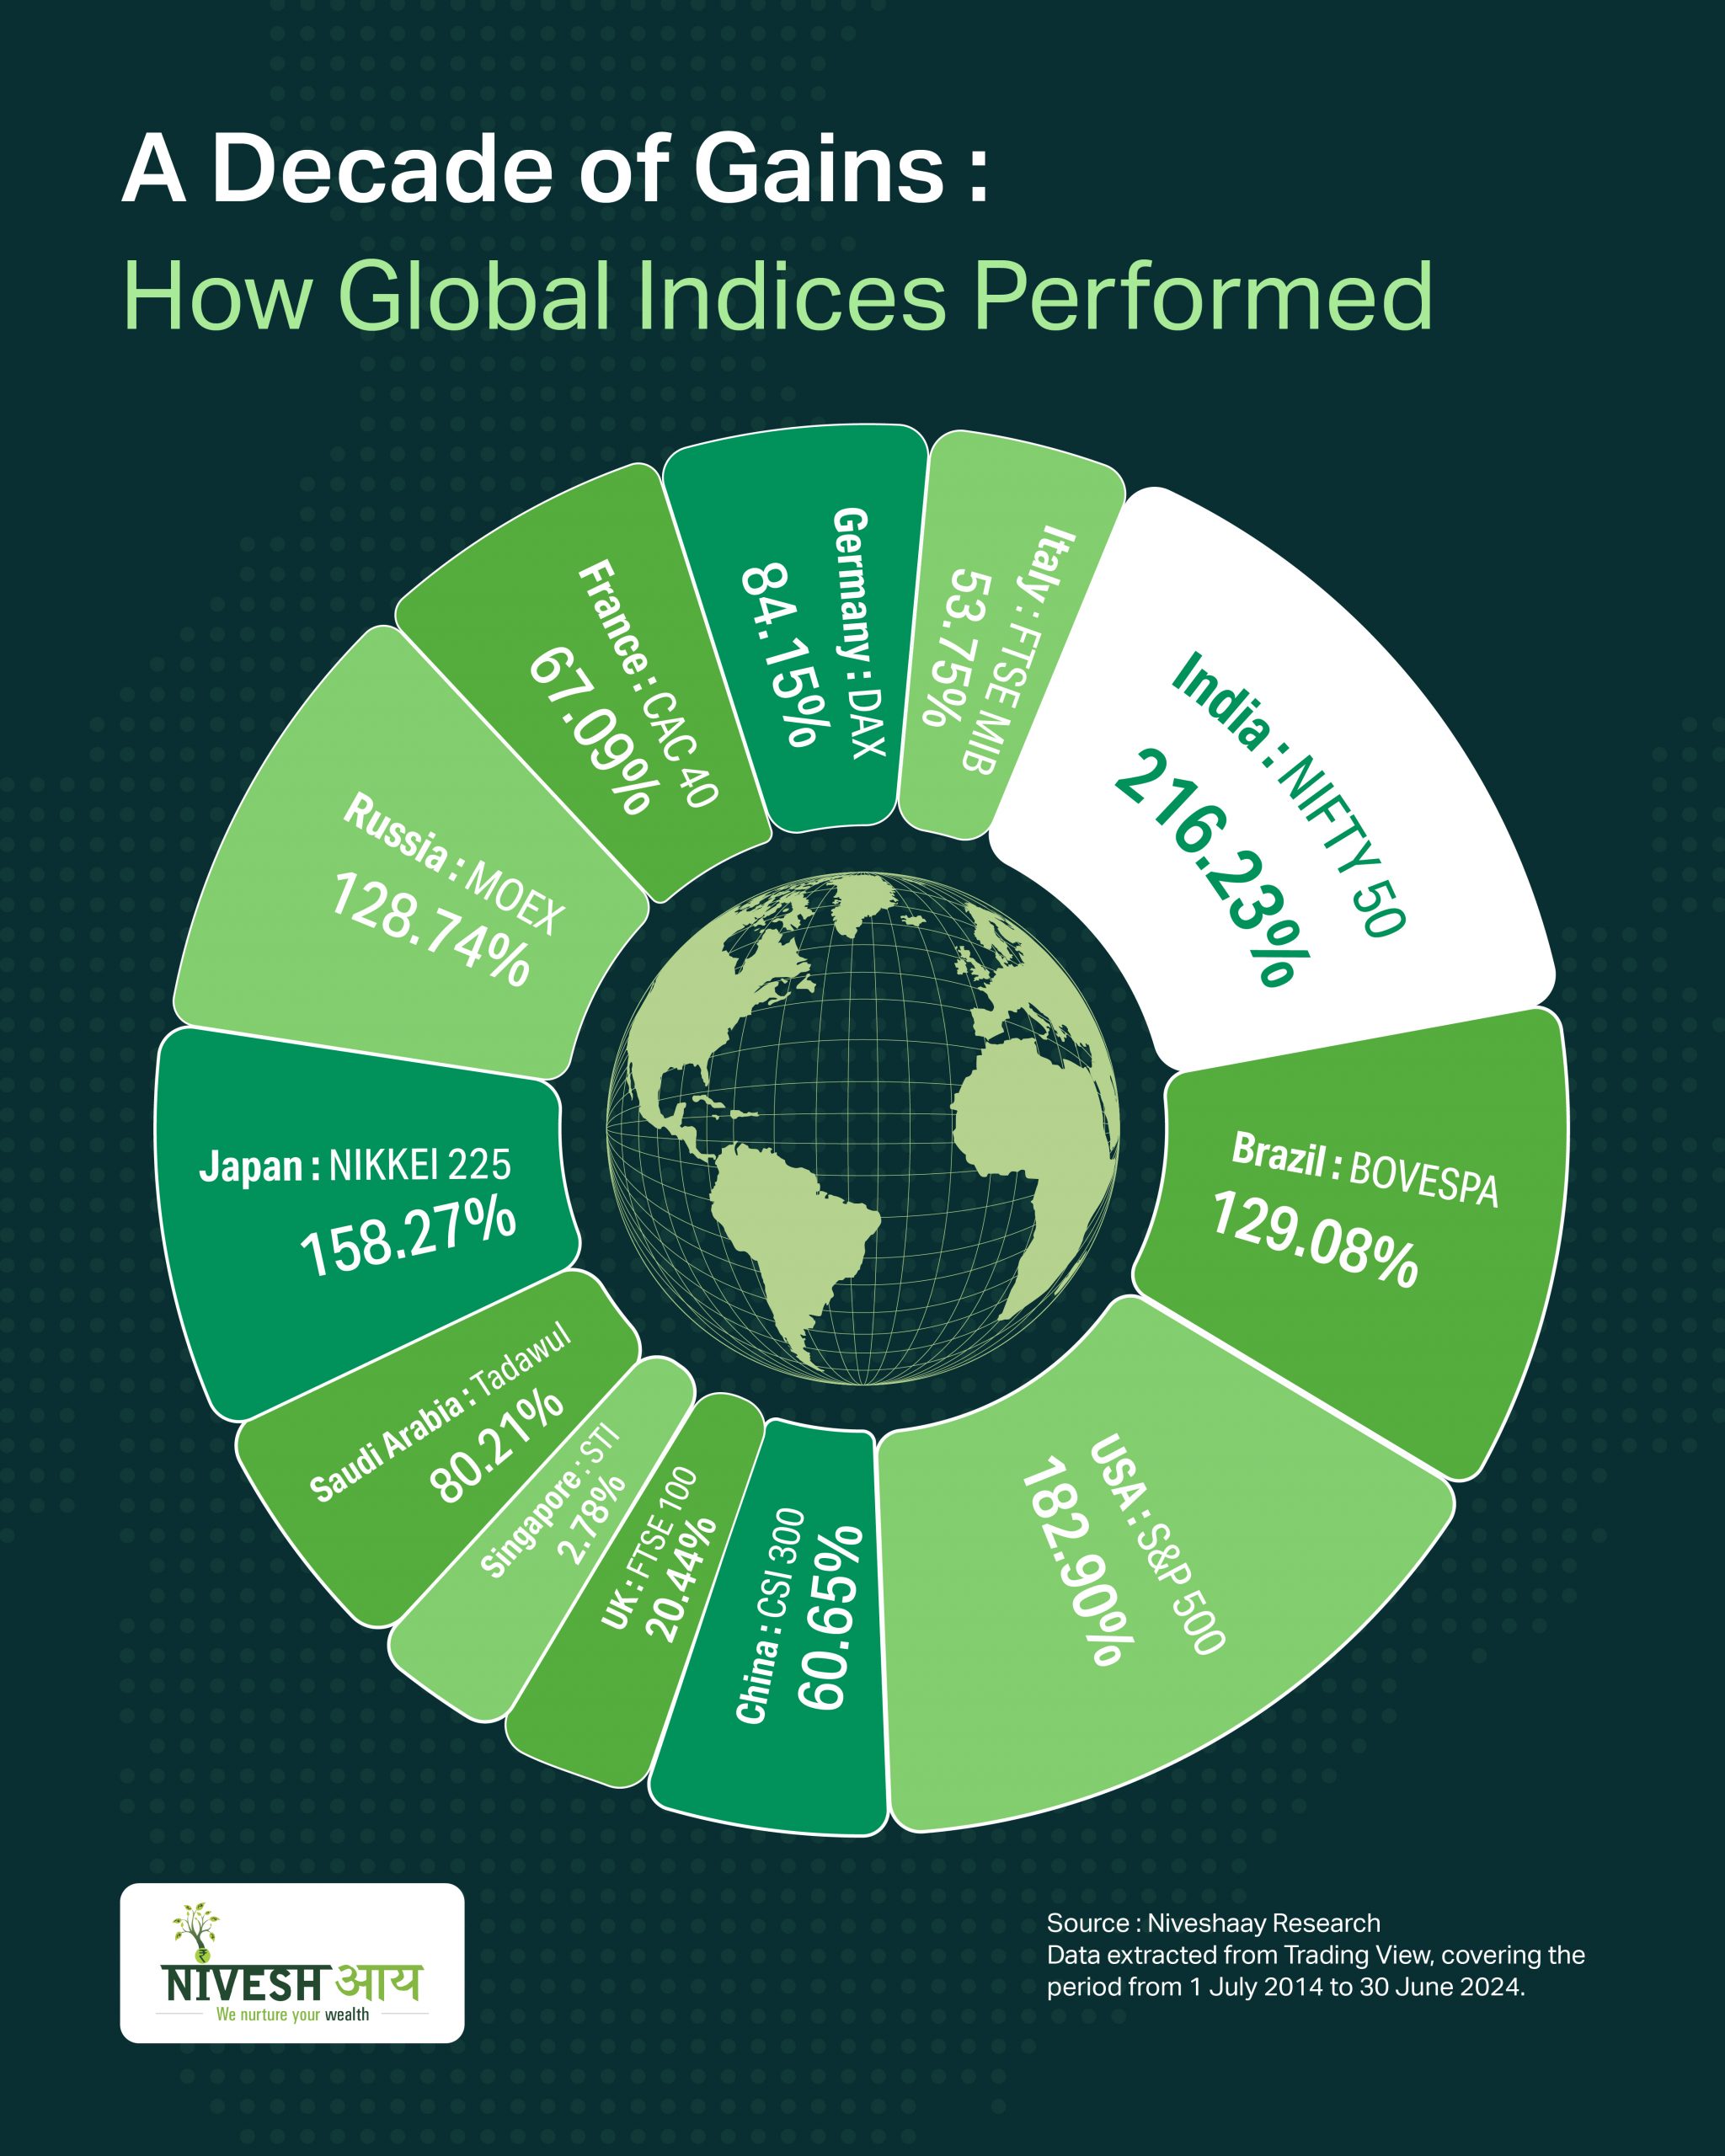
Capital Goods & Engineering
A Decade of Gains : How Global Indices Performed
India's economic trajectory during the past decade has been remarkable, consistently surpassing global averages. As per IMF, in 2023-24, India's total GDP was US$ 3.94 trillion and per capita was ~$2,730, marking a 9.2 % rise from the previous year's ~$2,500. This growth is attributed to strong reform measures initiated by the government over the
India's economic trajectory during the past decade has been remarkable, consistently surpassing global averages. As per IMF, in 2023-24, India's total GDP was US$ 3.94 trillion and per capita was ~$2,730, marking a 9.2 % rise from the previous year's ~$2,500. This growth is attributed to strong reform measures initiated by the government over the last ten years. The impact of these reforms is visible not only in economic indicators but also in the robust performance of India's stock market, reflecting investor confidence and optimism about the country's future economic prospects.
AI & Data Center
Key Insights from SNEC Expo, Shanghai
In the coming decades, global energy demand is expected to significantly increase due to rising population, industrial growth, technological advancements, and increased data center usage. This growing demand, coupled with challenges such as climate change, greenhouse gas emissions, and escalating pollution, underscores the need for renewable energy solutions. Among these solutions, Solar energy has been
In the coming decades, global energy demand is expected to significantly increase due to rising population, industrial growth, technological advancements, and increased data center usage. This growing demand, coupled with challenges such as climate change, greenhouse gas emissions, and escalating pollution, underscores the need for renewable energy solutions. Among these solutions, Solar energy has been adopted in a meaningful way leveraging its scalability, decreasing costs, and long-term sustainability.
As the power sector undergoes this rapid transition towards cleaner and greener sources of energy, it has presented investors with interesting investment opportunities. We, at Niveshaay, are particularly bullish on this trend. As part of our scuttlebutt investing approach and to gain firsthand insights into the global solar industry, we recently attended the ‘SNEC 17th (2024) International PV Power Expo’ in Shanghai, China.
Current Industry Trend
Our visit to the SNEC Expo provided invaluable insights into the industry's current landscape and emerging trends. One of the important observations was the industry-wide adoption of TOPCon technology in China. This technology boasts superior efficiency compared to the previously dominant PERC technology, and Chinese manufacturers are leading the charge with a whopping 700 GW TOPCon cell capacity. Due to cost advantages and better pricing of TOPCon cells as compared to PERC cells, most of the companies in China are strategically shifting to TOPCon and phasing out their PERC facilities. Though HJT has better efficiency than TOPCon, it is a costlier technology and the manufacturers are facing some issues in manufacturing HJT cells. China currently has 100 GW HJT cell capacity.
Dominant Position of China
The key factor behind China's dominant position in the solar industry is the robust government support. This enables them to establish massive production capacities (ranging from 10 to 20 GW) within a remarkably short timeframe of 12-18 months. This rapid scaling is fuelled by a confluence of government incentives, including free land for five years, attractive local subsidies, tax exemptions for initial years, and access to critical utilities like power and water at subsidised rates. Additionally, their fully automated production lines enable them to scale and run efficient operations through adequate human oversight.
India's Rise: Matching Ambition with Action
Despite dominance of China in the global solar industry, the Indian government has been very proactive in building the necessary infrastructure for a swift energy transition. Initiatives like ALMM (Approved List of Models and Manufacturers) and DCR (Domestic Content Requirement) have significantly benefitted Indian solar manufacturers, empowering them to cater more effectively to domestic demand and restrict competition from Chinese players. The implementation of ALMM has also led to a decline in module imports from China. A growing trend within the Indian solar sector is the intention to push for backward integration, a strategy that allows manufacturers to exert greater control over their supply chains. This move is expected to be further bolstered by the government's PLI (Production Linked Incentive) scheme.
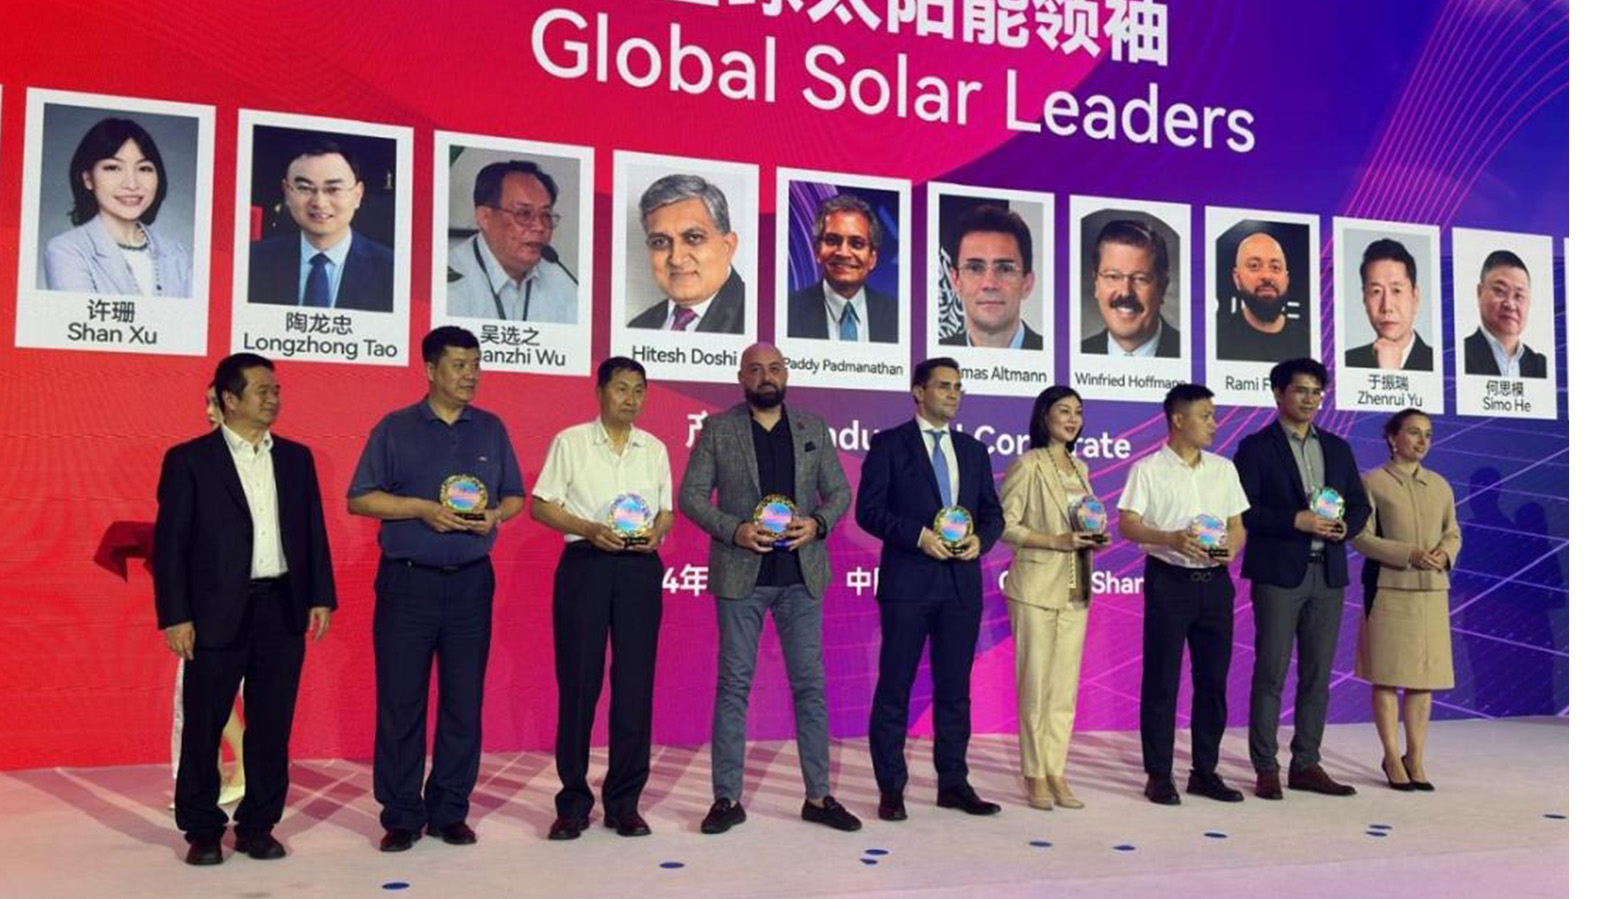
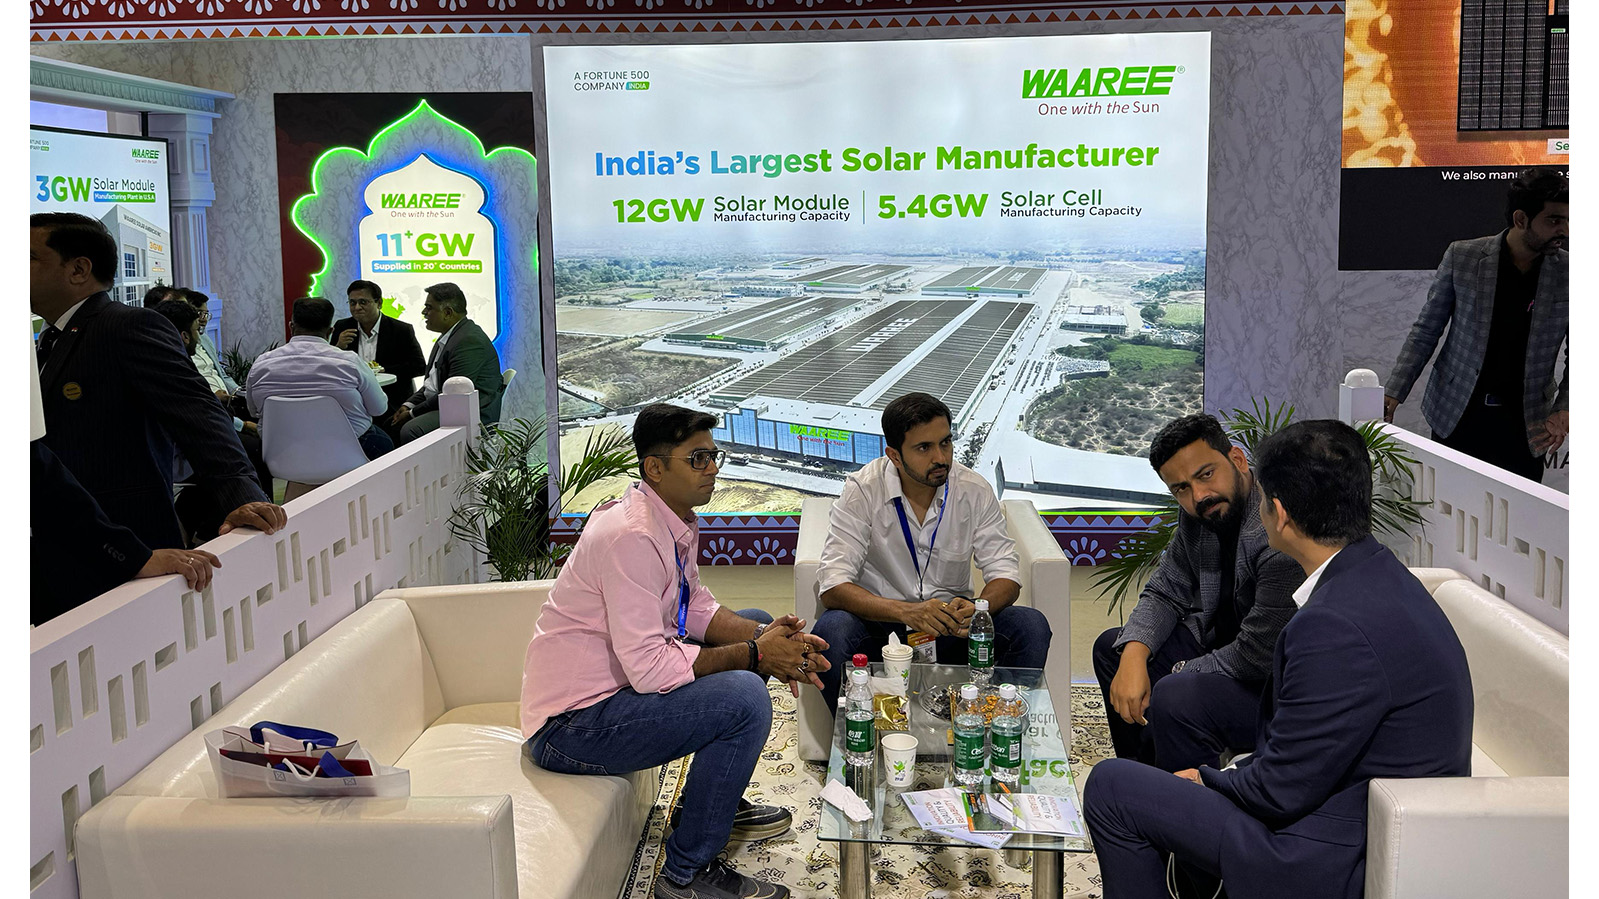
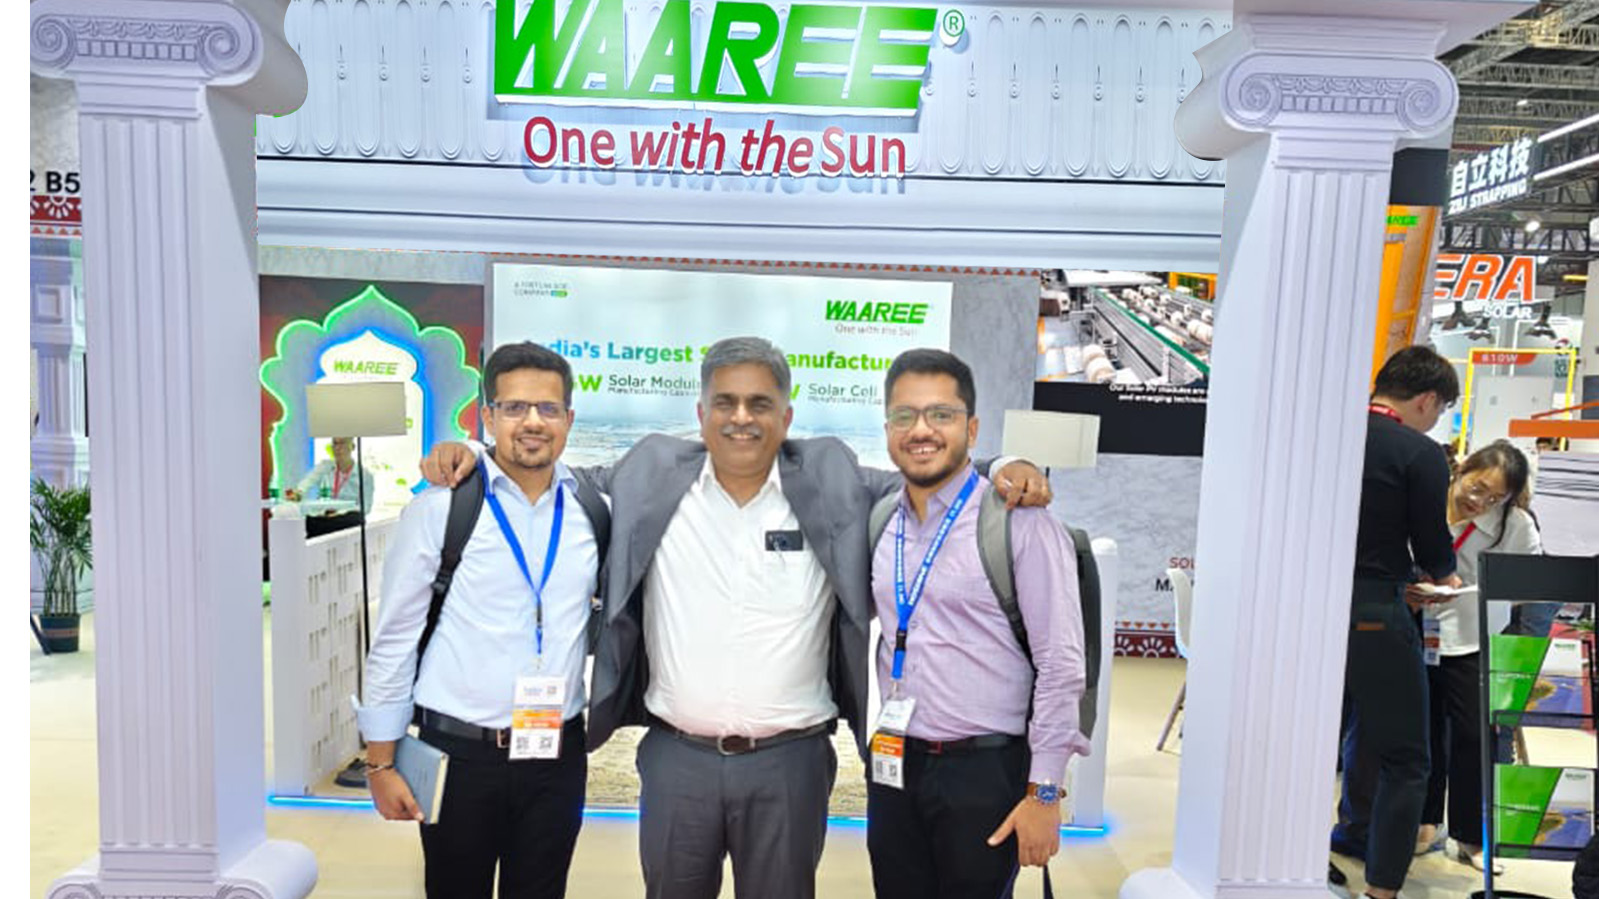
A Golden Opportunity for Indian Solar Players
MonoPERC technology is expected to stay relevant for Indian markets for implementation under DCR and ALMM requirements. TOPCon is still in its initial phases and may take time to ramp up as only few large players in India are making TOPCon modules in limited quantity. Manufacturers who are able to transition to TOPCon technology in the near future would stand to gain a significant competitive edge. By embracing TOPCon early, they can capitalize on its efficiency benefits and establish themselves as strong contenders.
There are also circumventing and dumping allegations against few Southeast Asian countries in US markets which will create demand-supply gap. Other export markets are also expected to restrict entry of Chinese vendors due to significant overcapacity. Indian manufacturers stand to benefit due to this unique situation in the export markets.
Challenges and the Road Ahead: Building a Resilient Domestic Ecosystem
One of the key challenges on the path to self-sufficiency lies in establishing cell manufacturing facilities in India. Currently, Indian cell manufacturers are facing hurdles in securing essential utilities infrastructure and navigating restrictions on the entry of Chinese engineers to India. Companies that can commence facilities without much delay will have a significant advantage due to demand generated from DCR scheme. However, China's current overcapacity has created a unique advantage for Indian companies. Chinese equipment manufacturers who are facing constrains in domestic (China) market, are now wooing Indian companies with attractive turnkey solutions at favourable terms.
Summary
The technology in solar is changing fast with limited time available for the manufacturer to recover their investments along with decent profitability while parallelly shifting to latest technology. Due to this complicated and capital-intensive nature of the industry, it may be difficult for a new player with limited history of execution to enter the business and be successful in long run. The energy storage business has also started gaining traction in China due to falling prices of the batteries. Once available at full scale and at a reasonable cost, it will experience significant growth in the Indian market.
The SNEC Expo served as a powerful testament to the dynamism of the global solar industry. The future of solar energy is undeniably bright, and India is well-positioned to be a major player in this transformative journey. By staying informed about the latest technological advancements, government policies, and market trends, investors can make strategic decisions and capitalize on the immense potential of this rapidly evolving sector.
Happy Investing!
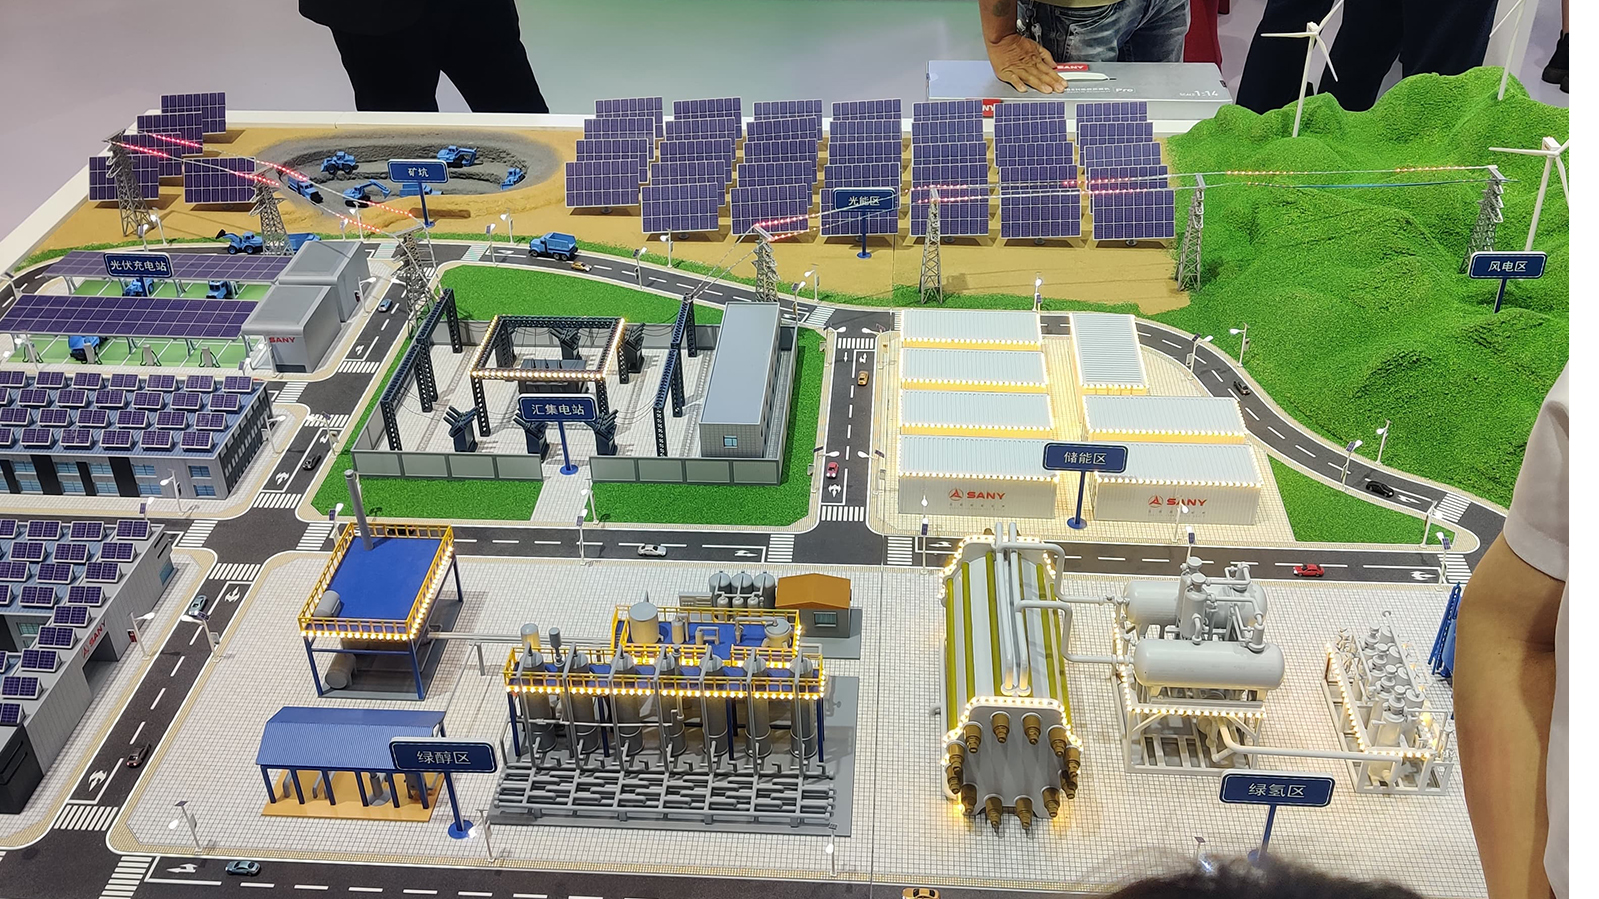

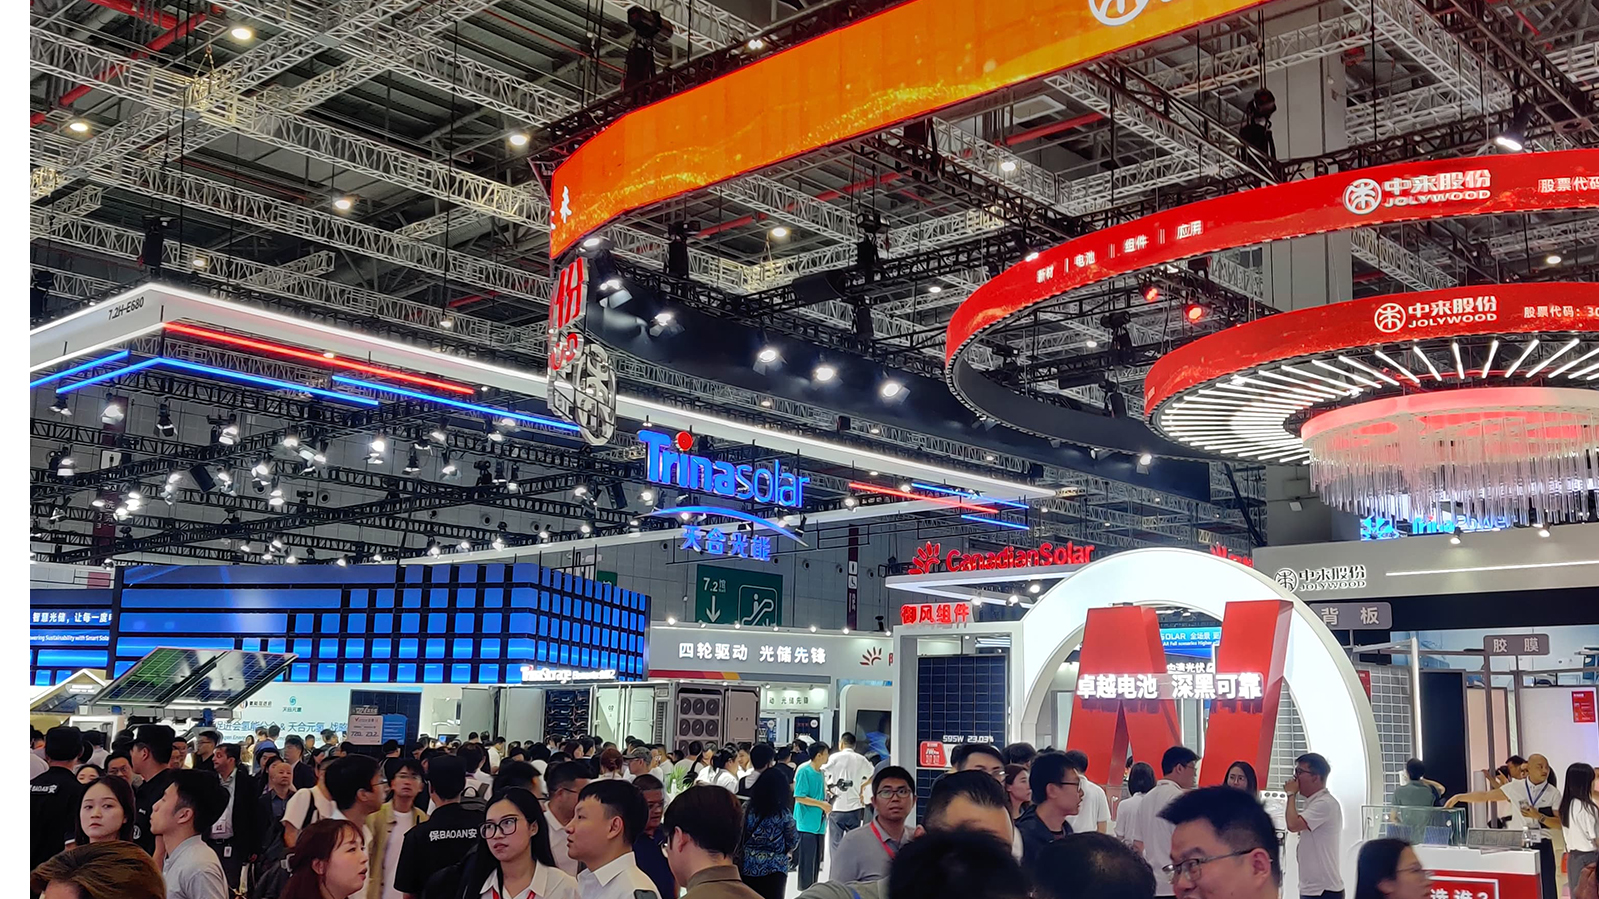
Disclaimers and Disclosures
SEBI Registration No. :INH000017338, IN/AIF3/24-25/1571, IN/AIF2/24-25/1607 | BASL Membership ID: 6276
Investment in Securities Market are subject to market risks. Read all related documents carefully before investing. The securities quoted are for illustration only and are not recommendatory. Registration granted by SEBI, membership of a SEBI recognized supervisory body (if any) and certification from NISM in no way guarantee performance of the intermediary or provide any assurance of returns to investors.
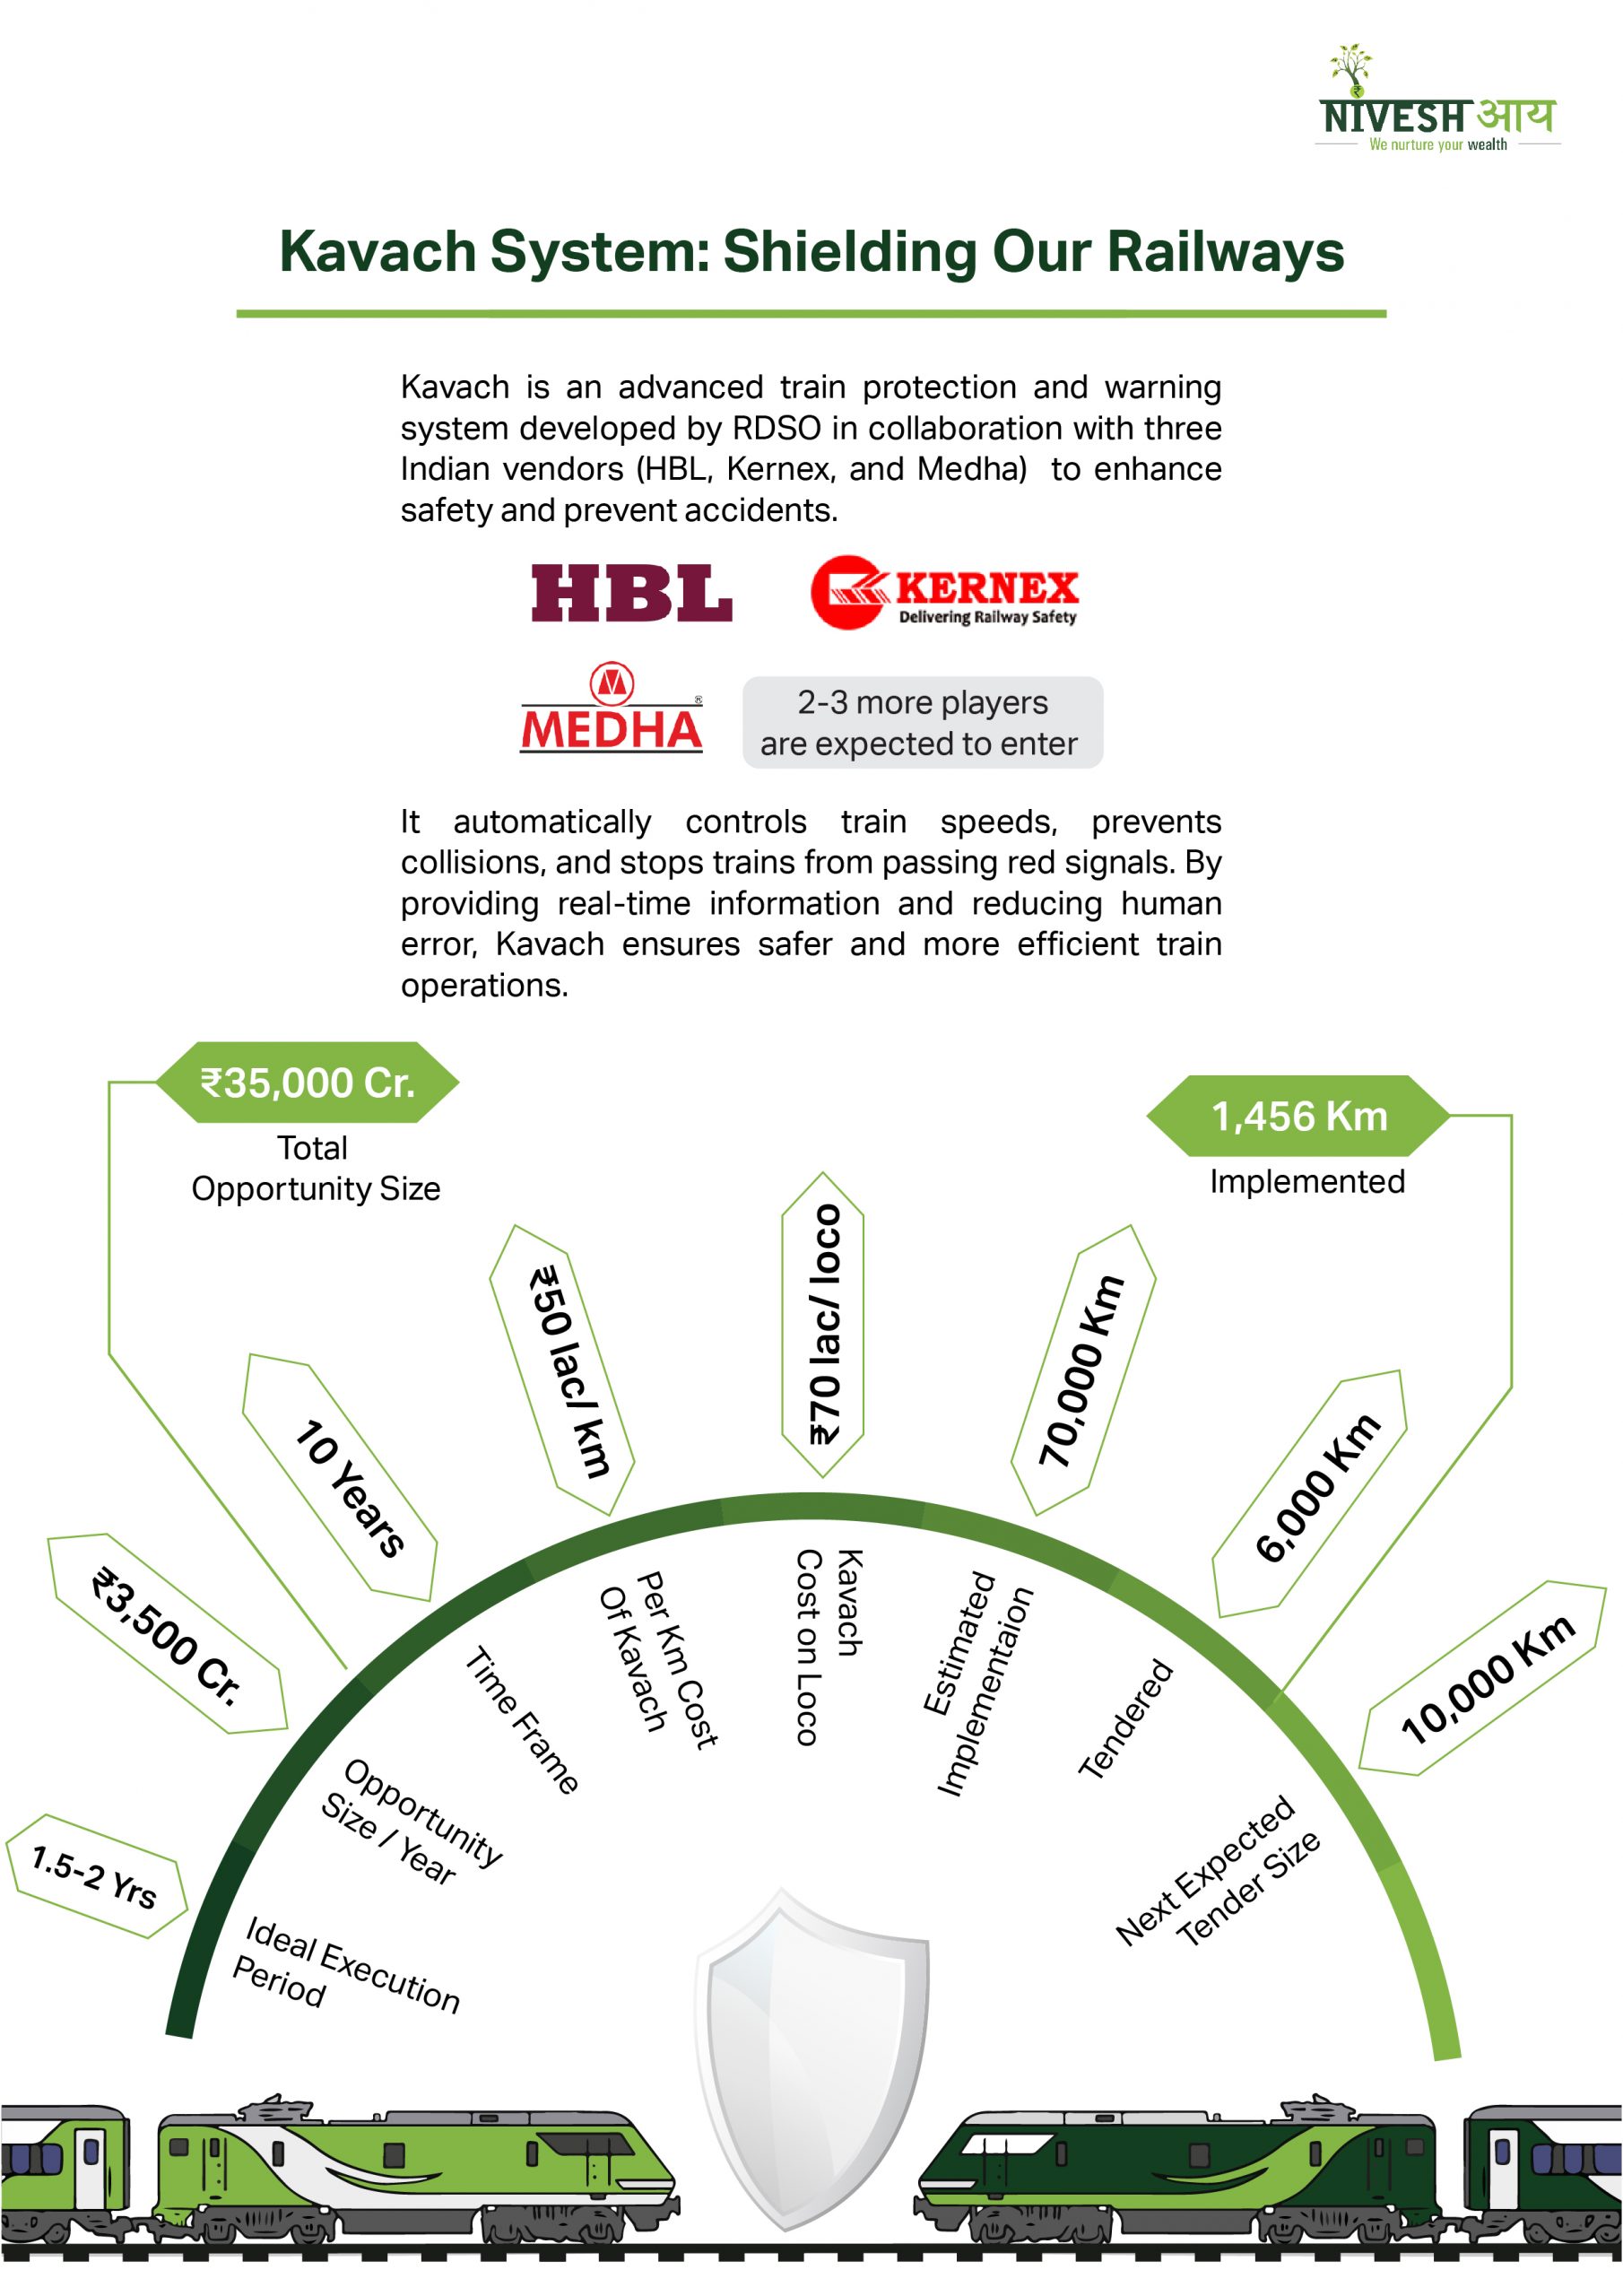
Capital Goods & Engineering
Kavach System : Shielding Our Railways
The Kavach is also known as the automatic train protection system and plays a crucial role in abating accidents. It works as a shield in an emergency when a driver fails to take the required action, Kavach comes into play and applies brakes in auto mode. The under penetration of Kavach presents a substantial opportunity
The Kavach is also known as the automatic train protection system and plays a crucial role in abating accidents. It works as a shield in an emergency when a driver fails to take the required action, Kavach comes into play and applies brakes in auto mode. The under penetration of Kavach presents a substantial opportunity for its growth.

Electric Vehicle & Ancillaries
Market Outlook: Post Election Results
The election outcome has been both remarkable and unexpected. The National Democratic Alliance (NDA) has returned for a third term forming a coalition government. There should not be any crucial impact on the policy frameworks as previous ministers have retained major ministries, ensuring the continuity of previously announced policies. Historical Context: Government Capex and Economic
The election outcome has been both remarkable and unexpected. The National Democratic Alliance (NDA) has returned for a third term forming a coalition government. There should not be any crucial impact on the policy frameworks as previous ministers have retained major ministries, ensuring the continuity of previously announced policies.
Historical Context: Government Capex and Economic Impact
Historically, the size and influence of government capex on the economy were substantial, particularly in the 1980s when public spending played a critical role in economic growth. At that time, continuity in government policies was crucial for sustaining economic momentum.
Typically, government capex drives initial growth, which is then followed by private investment. As government policies have already set the foundation, it's time for private capex to take the lead, indicating a reduced dependency on government spending.
In India, the bull market persisted in 2004 despite a change in government and the formation of a coalition government, fuelled by the continuation of key economic policies and major private capex, resulting in a substantial market rally from 2004 to 2007.
The data mentioned below suggests that irrespective of government actions or changes, portfolio returns will ultimately reflect long-term earnings growth. Therefore, as investors, it's crucial to concentrate on sectors where corporate earnings growth is expected to be robust.
| Government | NIFTY EPS CAGR | NIFTY Return CAGR |
| UPA 1&2 (2004-2014) | 12% | 14% |
| NDA 1&2 (2014-2024) | 10% | 10% |
Sustained Continued Growth Expected for Key Industries
The last two terms of the BJP-led government have seen a huge budgeted capital expenditure for Infrastructure, Railways, Defence, and many more, where we have already made investment allocations to capitalize on the anticipated growth opportunities.
In addition to the global momentum towards energy transition, investments in the whole value chain have paved the way for significant growth. Concurrently, India's textile industry stands to benefit from the 'China Plus One' strategy and supply chain consolidation trends. The growth in this sector not only supports these strategies but also leads to significant employment generation in the country. Moreover, in electronics manufacturing, import substitution has strengthened Indian companies due to cost efficiencies, reduced lead times, and enhanced quality, fostering both domestic preference and increased export opportunities.
Moving forward, we also anticipate some measures towards populist measures aimed at rural development.
Rural Development: Addressing Economic Disparities
According to our observations, the current government’s approach focuses on long-term improvements in rural economies through infrastructure development, such as housing, electrification, and essential facilities, rather than short-term freebies. This strategy aims to provide sustainable economic upliftment.
Moreover, we believe that nurturing a thriving manufacturing sector will result in higher wages, particularly benefiting the bottom of the pyramid. This approach could potentially offer a sustainable solution for rural economic growth over the next decades. Emphasizing investments in manufacturing rather than short-term incentives ensures long-term growth supported by increased earnings and economic stability.
Strategy: Balancing Reactivity and Long-Term Focus
In the face of current market conditions, it is prudent to adopt a reactive rather than predictive investment strategy. Observing the formation of the new government and the distribution of ministries will provide critical insights into the future direction of economic policy. This wait-and-watch approach will allow investors to make informed decisions based on emerging data.
Furthermore, with minimal disruption in the distribution of ministries, we have been actively tracking and investing in the high-growth sectors supported by favorable policies. We anticipate continuity in policy allocation while remaining cautious about any announcements or shifts that could impact our portfolio or present future investment opportunities.
In conclusion, despite current anomalies, we remain focused on the bigger picture, confident that India's long-term growth trajectory is secure and short term challenges will not have a lasting impact. The manufacturing sector is poised to be a long-term growth driver and energy transition initiatives are expected to remain a focus, aligning with global trends.
Disclaimer:
Niveshaay is a SEBI Registered (SEBI Registration No. INA000017541) Investment Advisory Firm.Our research expresses our opinions which are based on available public information, field research, inferences, and deductions through our due diligence and analytical process. To the best of our ability and belief, all information contained here is accurate and reliable and has been obtained from public sources, which we believe to be accurate and reliable. We make no representation, express or implied, as to the accuracy, timeliness, or completeness of any such information or with regard to the results obtained from its use. This report does not represent investment advice or a recommendation or a solicitation to buy any securities.
Disclaimers and Disclosures
SEBI Registration No. :INH000017338, IN/AIF3/24-25/1571, IN/AIF2/24-25/1607 | BASL Membership ID: 6276
Investment in Securities Market are subject to market risks. Read all related documents carefully before investing. The securities quoted are for illustration only and are not recommendatory. Registration granted by SEBI, membership of a SEBI recognized supervisory body (if any) and certification from NISM in no way guarantee performance of the intermediary or provide any assurance of returns to investors.
Recycling & Refurbishment
Recycling: Favourable Economics Of It (Part I)
Two decades ago, it was hard to imagine that the share of renewables (including hydro) in global electricity generation could touch ~30% in 2023. The energy transition in India has been in an accelerating phase, thanks to the favourable government policies. Why has it suddenly become more important than ever? Well, COVID-19 accelerated the clean energy adoption
Two decades ago, it was hard to imagine that the share of renewables (including hydro) in global electricity generation could touch ~30% in 2023. The energy transition in India has been in an accelerating phase, thanks to the favourable government policies. Why has it suddenly become more important than ever? Well, COVID-19 accelerated the clean energy adoption trend and also made us realise that the shift to green energy is fuelled by necessity. In addition, the Russia-Ukraine war also highlighted the importance of a quick shift to renewables. Countries like India and Europe, which are fuel dependent on other nations, did realise the need to fill in the gaps after the energy supply disruptions for greater security after the pandemic and the war period. Hence, definitely, it’s a long-term and integral play for any economy to achieve sustainable growth. Continuing cost declines confirm that competitive renewables are a low-cost climate and decarbonisation solution that aligns with short-term economic needs while keeping long-term sustainable goals intact. The more these technologies are deployed, the more their costs could fall.
A big factor in this journey has been the optimum usage of resources, a pivotal concept in stock market commonly referred to as operating efficiency. Haven’t we observed companies emphasizing reducing waste while manufacturing, optimizing resource utilization to its fullest extent, and transitioning to raw materials that offer a higher yield. These indicators suggest that the recycling industry is poised for healthy growth, with unit economics increasingly becoming favourable. Frequently, we express the adage, "What goes around, comes around," and it is now imperative to transition from the conventional linear model of produce, use, and dispose to the circular model of reuse and recycle.
Although the recycling industry has been in existence for several years, the pace of its adoption has significantly quickened over the last 2–3 years. ESG (Environmental, Social, and Governance) compliance is not confined to this sector alone; it is now prevalent in various other industries.
Relevance of Recycling Across Industries
For example, as far back as 1993, Patagonia employed recycled polyester from plastic soda bottles to make outdoor clothing. Presently, brands and companies are increasingly embracing the concept of a "circular economy," especially when they can command premium prices for their products due to their sustainability attributes. Notably, the utilization of recycled polyester, such as PET bottle recycling, by major brands like Zara and H&M stands out as a crucial element of sustainability initiatives in the fashion industry.
At first, recycled yarn predominantly found its place in the international market. However, there is now a notable shift towards its adoption in the domestic market as well. The management of Banswara Syntex Ltd. emphasized during a recent conference call how they have augmented the incorporation of recycled polyester in their production processes. Previously, in India, recycled yarn was primarily considered viable if it demonstrated a higher level of competitiveness. Presently, other factors have gained significant prominence, leading to an increased demand for recycled yarn in the Indian market.

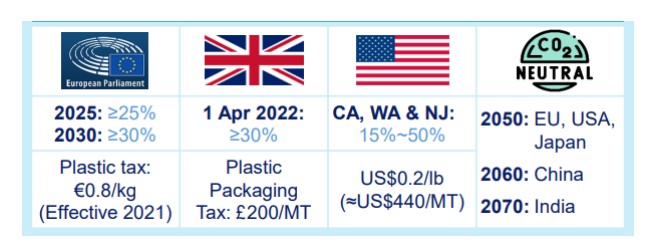
The green impact of this fabric goes even beyond the recycling benefits. The clothes match virgin polyester in quality, but their manufacturing takes significantly fewer resources. Its production requires almost 60 percent less energy, and CO2 emissions are reduced by nearly one-third compared to virgin polyester.
Extended Producer Responsibility (EPR) schemes, for example, have become a powerful tool for promoting effective waste management solutions in a number of countries. The objective of EPR is to push producers (including thermal power generators, renewable energy developers, and manufacturers) to factor in environmental costs as part of their project planning. For instance, a change in government regulations mandates using at least 30% recycled content in new PET bottles by 2025. The current recycled content in Coca-Cola is 9–10%, and the company plans to increase it to 50% by 2025. Sustainability and ESG compliance have now become global trends.
An equally significant illustration pertains to the importance of recycling within the steel industry. The pivotal shift of the steel industry toward a circular economy model holds profound significance in terms of optimizing resource efficiency, curtailing waste generation, and fostering sustainable practices, given its integral role in the broader economy.
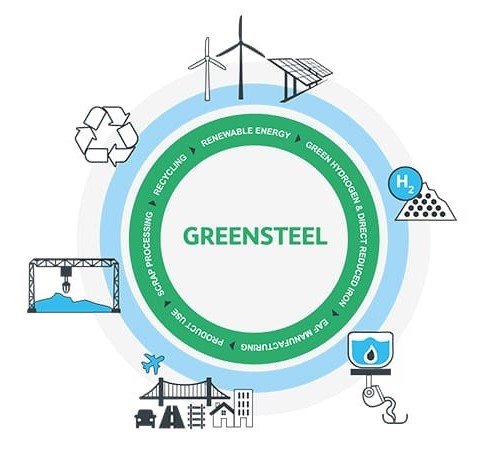
Augmenting the proportion of Electric Arc Furnace (EAF)-based steel production serves as a means to reduce carbon emissions in the steel industry, offering the additional advantage of requiring lower capital investments. In the United States, the EAF's share of total steel production was 25% in 2012, but this figure surged to 70% by 2020. Similarly, in the Middle East, EAF accounts for 94.4% of production; in India, it stands at 55.5%; and in the European Union, it constitutes 42.4% of steel production.

Almost a decade ago, if someone had inquired of refractories companies whether they engaged in recycling, the response would have been an unequivocal "no." The refractories industry was commonly associated with pollution. However, over the past 5-6 years, the worldwide emphasis on pollution reduction and the scarcity of raw materials have prompted a re-evaluation of material recycling within the refractory industry. Such recycling opportunities remain quite limited, but companies able to access them can achieve substantial savings, amounting to ~30% of their total costs.
Another noteworthy sector that is fostering favorable economics is the aluminum recycling industry. Primary aluminum accounts for 65% of the total demand for aluminum, with the remaining 35% being sourced from recycled aluminum. Each ton of aluminium recycled rather than produced from ore saves:
Globally, nearly 70% of aluminum cans are recycled, and in India, the recycling rate is an impressive 85%.
Another significant sector of note is lead recycling. In India, 65% of the demand for lead is met through recycled sources, with the remaining 35% relying on primary lead production. An essential aspect is that nearly 100% of primary lead can be recycled, effectively removing impurities without any deterioration in its properties. Primary lead scrap that is discarded causes huge environmental damage and pollution.
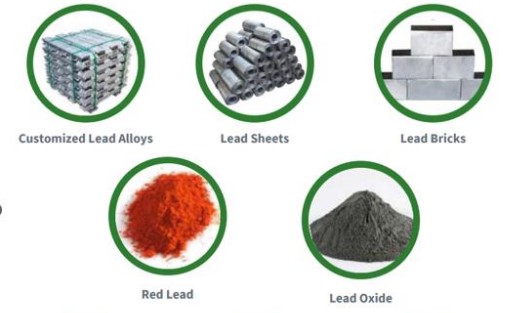
Thus, recycling these waste scraps and using it again can protect the environment. Recycled lead uses only 30–40% of the energy required to extract primary lead from its ore. An additional advantage is that lead can be repeatedly re-melted and recycled without any degradation in its properties, making recycled lead the preferred choice for most industries over primary lead.
Reclaimed rubber products are in high demand across various essential industries, including automotive, consumer goods, aerospace, and footwear. This growing demand is a direct result of a significant shift towards the preference for environmentally friendly and recyclable materials. Particularly, the automotive sector represents the largest consumer of reclaimed rubber within these industries.

The EPR policy assigns the highest level of importance to reclaimed rubber, and as a result of its introduction, the current usage of reclaimed rubber, which stands at 3-4%, is expected to increase to 7-8%. This adjustment is aimed at helping manufacturers meet recycling targets and boost the overall production of reclaimed rubber.
Examining the current utilization of sustainable materials by global players like Bridgestone and Michelin, who currently incorporate 30–40% sustainable materials and have plans to raise this to 80% by 2050, it becomes evident that there is significant growth potential for Indian industry players.
Undoubtedly, efforts are underway to enhance the structure of the recycling industry, and the potential for growth is vast. Part Two of the blog will delve deeper into specific industries within this sector, providing detailed insights into the companies that are highlighting their significant contributions and advancements in this direction.
Disclaimer:
Investment in securities market are subject to market risks. Read all the related documents carefully before investing. The content in these posts/articles is for informational and educational purposes only and should not be construed as professional financial advice and nor to be construed as an offer to buy /sell or the solicitation of an offer to buy / sell any security or financial products.
Registration granted by SEBI, membership of BASL and certification from NISM in no way guarantee performance of the intermediary or provide any assurance of returns to investors.
The securities quoted are for illustration only and are not recommendatory.
Disclaimers and Disclosures
SEBI Registration No. :INH000017338, IN/AIF3/24-25/1571, IN/AIF2/24-25/1607 | BASL Membership ID: 6276
Investment in Securities Market are subject to market risks. Read all related documents carefully before investing. The securities quoted are for illustration only and are not recommendatory. Registration granted by SEBI, membership of a SEBI recognized supervisory body (if any) and certification from NISM in no way guarantee performance of the intermediary or provide any assurance of returns to investors.

Space Ecosystem
Gratitude and Vision: Closing the Year with Our Founder’s Reflections
As 2024 comes to a close, we pause to reflect on a year filled with valuable lessons. It has been a year marked by challenges, milestones, and achievements that have reinforced the values we stand for at Niveshaay and the vision that drives us forward. Looking ahead to the new year, we also take time
As 2024 comes to a close, we pause to reflect on a year filled with valuable lessons. It has been a year marked by challenges, milestones, and achievements that have reinforced the values we stand for at Niveshaay and the vision that drives us forward.
Looking ahead to the new year, we also take time to remember where it all began. Niveshaay’s story started in 2014 with a small, dedicated team united by a shared passion for uncovering hidden businesses. Through our deep-dive research into under-researched companies, we laid the foundation for Niveshaay’s unique identity.
Gradually as Niveshaay evolved, so did our vision. One of our core visions has always been to back entrepreneurs—the true heroes of our economy. What once seemed like a distant dream has come closer, guided by persistence, faith, and the unwavering support of our investors. We launched the Niveshaay Hedgehogs Fund (Category III AIF) and the Niveshaay Sambhav Fund (Category II AIF) this year. These vehicles provide us with the flexibility and structure to leverage the business relationships that have been cultivated over the years, further aligning with our philosophy of “thinking the entrepreneur way.”
This year also marked the beginning of a new tradition. We hosted our first meet-and-greet session with our investors and entrepreneurs, The Dhandho Valley by Niveshaay, in Surat—the city where it all began. Known for its entrepreneurial spirit, Surat has always been close to our hearts. The event celebrated entrepreneurship, bringing together marquee investors, industry leaders, and entrepreneurs to reflect on the synergies between investing and building businesses. With our Niveshaay family growing—both in team size and vision—we also inaugurated our new office space during The Dhandho Valley event.
Additionally, this year marks our five-year journey on the Smallcase platform, where we've built a thriving community of investors. This achievement has been truly remarkable, enabling us to connect with investors across India and bring them together through our meet-and-greet sessions.
As we step into 2025, we are excited about India’s growth story. Opportunities abound in sectors like energy transition, power transmission, recycling, electronics manufacturing services (EMS), geospatial technologies, and data centres—areas we believe will lead the next decade of economic transformation.
This journey wouldn’t have been possible without our investors, partners, mentors, and well-wishers.
Thank you for being an integral part of our story. As we look forward to 2025, we do so with gratitude, hope, and determination to build on the foundation we’ve created together.
Wishing you and your families a joyful and prosperous New Year!
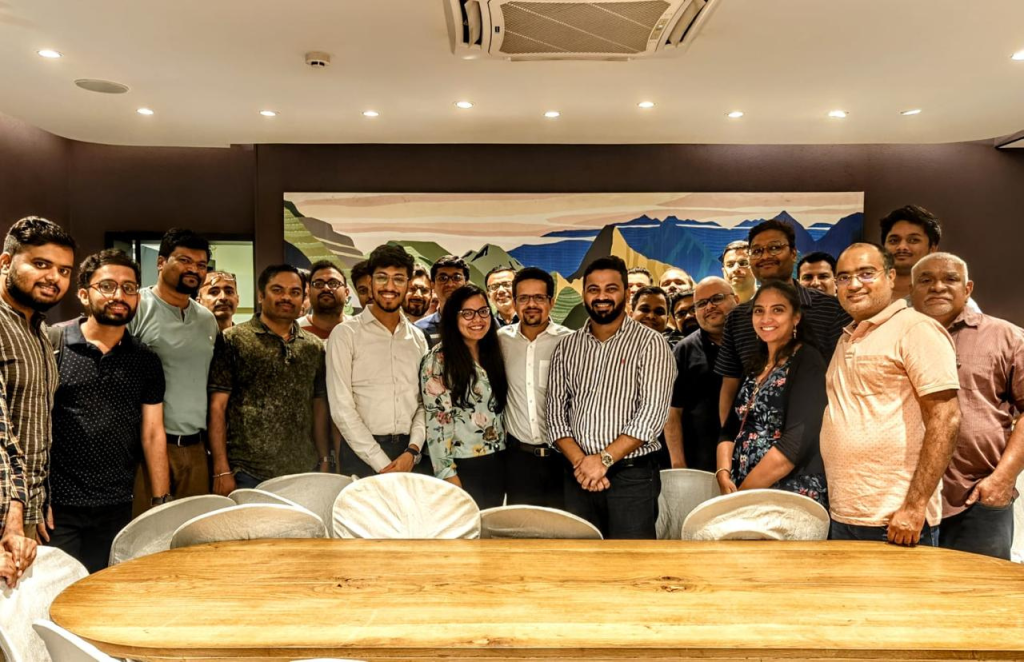



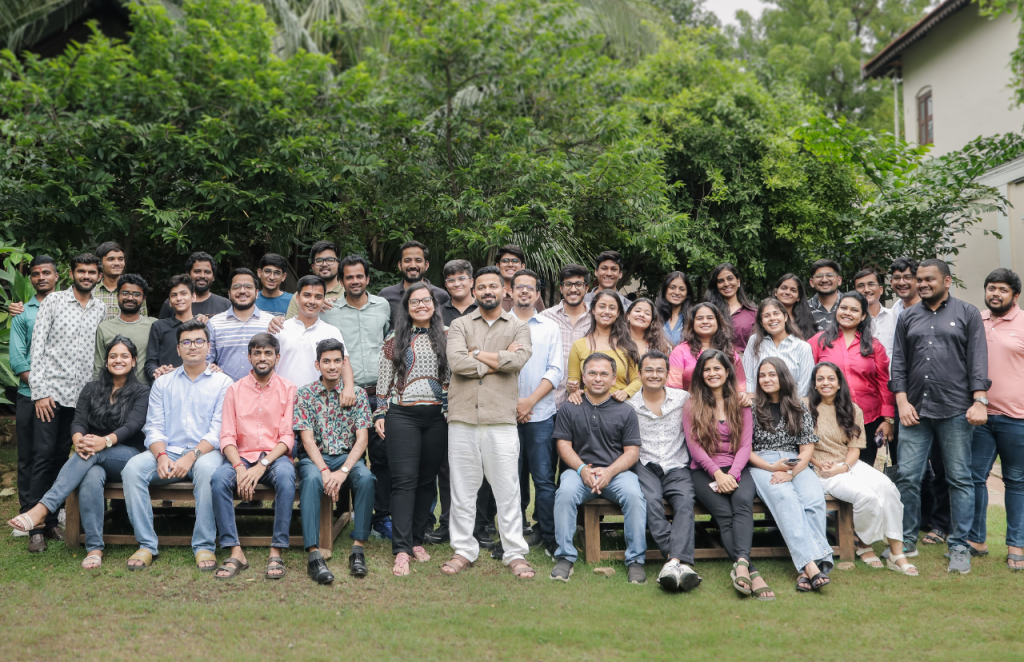
Disclaimers and Disclosures
SEBI Registration No. :INH000017338, IN/AIF3/24-25/1571, IN/AIF2/24-25/1607 | BASL Membership ID: 6276
Investment in Securities Market are subject to market risks. Read all related documents carefully before investing. The securities quoted are for illustration only and are not recommendatory. Registration granted by SEBI, membership of a SEBI recognized supervisory body (if any) and certification from NISM in no way guarantee performance of the intermediary or provide any assurance of returns to investors.

Electric Vehicle & Ancillaries
Indian Aviation Industry: Who’s leading the Pack? (Part II)
In part 1 of our blog, we discussed how the aviation industry appears to be headed towards strong growth. Amongst all, we also discussed how Interglobe Aviation Limited (“Indigo”) appears to be set to enjoy benefits from this industry wide tailwinds. This part of the blog delves deeper into the operational metrics of Indigo
In part 1 of our blog, we discussed how the aviation industry appears to be headed towards strong growth. Amongst all, we also discussed how Interglobe Aviation Limited (“Indigo”) appears to be set to enjoy benefits from this industry wide tailwinds.
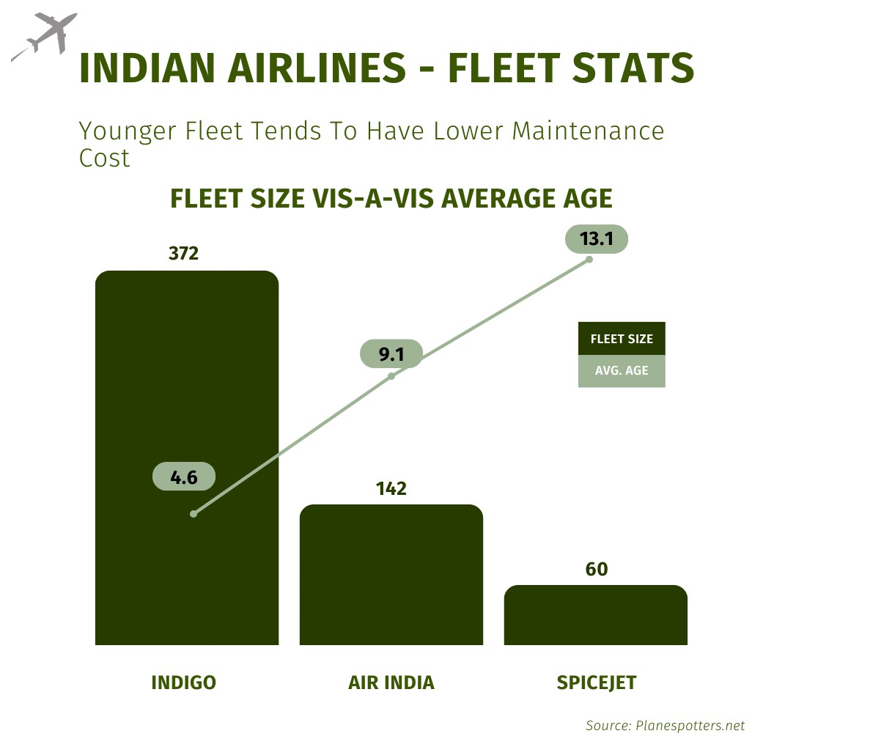
This part of the blog delves deeper into the operational metrics of Indigo which is India's largest airline and one of the world’s leading low-cost carriers with a dominant position in the Indian airspace (60%+ domestic market share and 17%+ international market share) with an exemplary management team. It offers passengers a simple brand promise of providing “low fares, on-time flights, and a courteous and hassle-free service”.
The company has a mega fleet of 360+ aircrafts with an average age of 4-4.6 years, almost half the average age of Air India and Spicejet. Further, it is undertaking aggressive capacity expansion by almost doubling its aircraft fleet in the next 5 years.
Some of the key operational excellencies of Indigo include:
1. Favorable shift in the Average Stage Length:

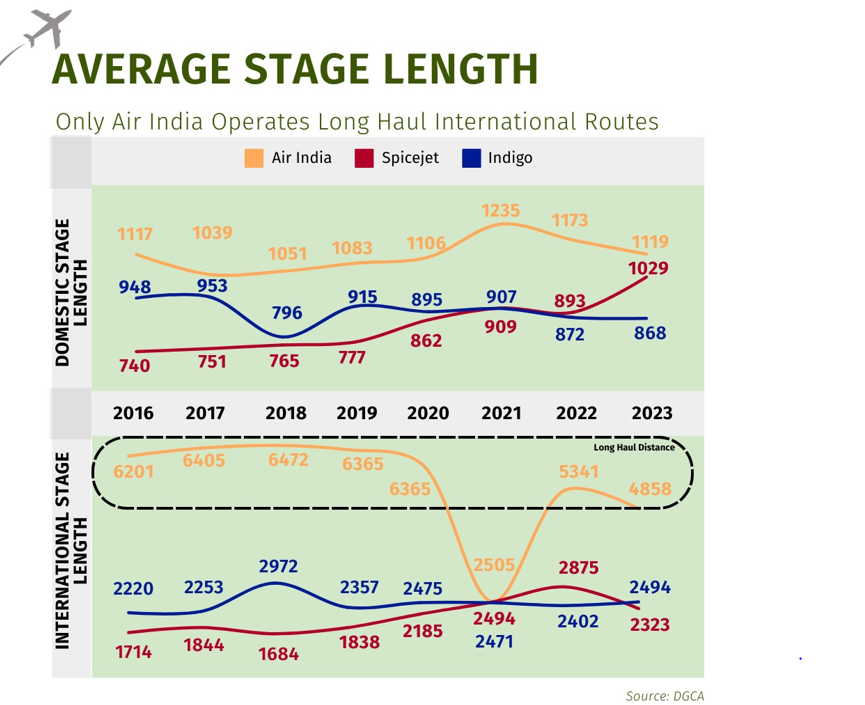
The lower the average stage length, the more cost-effective the airline is for short-haul flight operations (<4 hours flying distance). A lower average stage length also means a greater number of departures. For long-haul operations (>6 hours flying distance), higher stage length usually leads to cost savings which lead to improved profitability.
Over the last 10 years, Indigo’s domestic average Stage Length (Average Distance flown) has reduced from 947.5 Km in 2016 to 868.4 km in 2023. During the same period, the international average stage length increased from 2,219.8 km to 2,493.5 km. With the introduction of long-haul flights, the international average stage length is expected to increase further in the coming years.
Therefore, since the base minimum fare and functional constant is always received by the airline and the costs are limited, the low-cost carriers are able to earn higher yields per km flown on destinations that fall in the range of short to medium distances as compared to medium and longer distances. Thus, although the number of departures is higher, with extremely efficient operations, Indigo is able to earn good margins with good traffic volumes on these low to medium-faring routes.
2. Stable Yield Strategy:
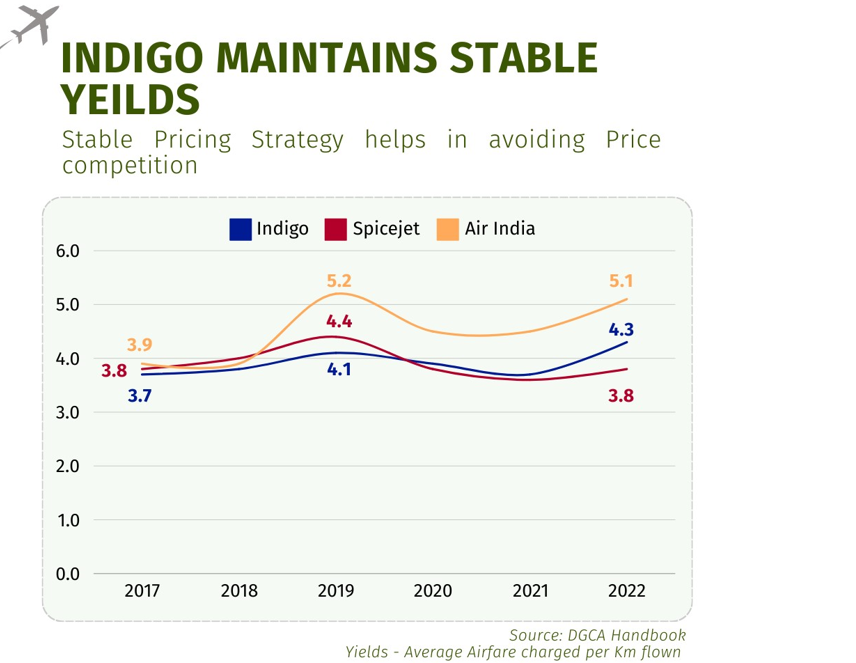
While Air India and Spicejet have struggled with volatile Yield Per Passenger km, i.e. fare charged to a customer per km flown, Indigo has maintained a stable yield range over the years. It has kept its pricing strategy very clear – “Affordable”.
Although sounds simple, in light of the aviation industry it is very difficult to maintain stable fares. This industry has always been troubled with pricing wars. However, Indigo’s strategy has been very clear – avoid price wars. Indigo maintains a fair airfare which is slightly higher than its competitors sufficient enough to pose to customers as if they are getting Indigo at almost similar fares (or at a very nominal premium).
3. Operational Excellence:
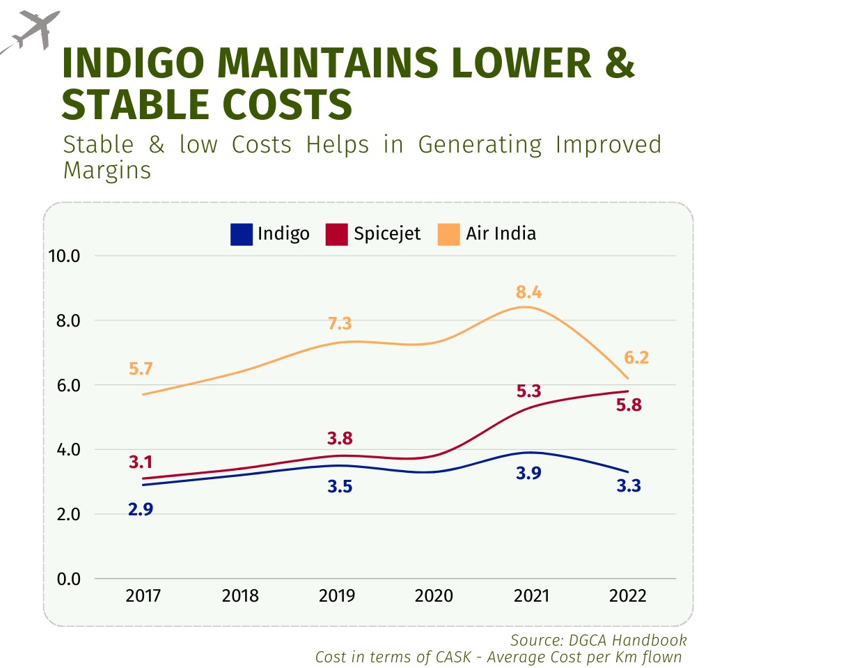
Strong management acumen with years of experience in operating airlines, strong business fundamentals and tactics like sale and leaseback model, maintaining lower aircraft weights, maintaining a passenger load factor at 80-85% levels, etc. leads to improved cost efficiency.
Whilst other players have struggled with maintaining their Cost per Available kms, Indigo has maintained a clear strategy to keep its operations efficient. The RASK-CASK spread has remained healthy over the years at Rs. 0.30-0.40 per passenger-km.
4. Efficient cash management:
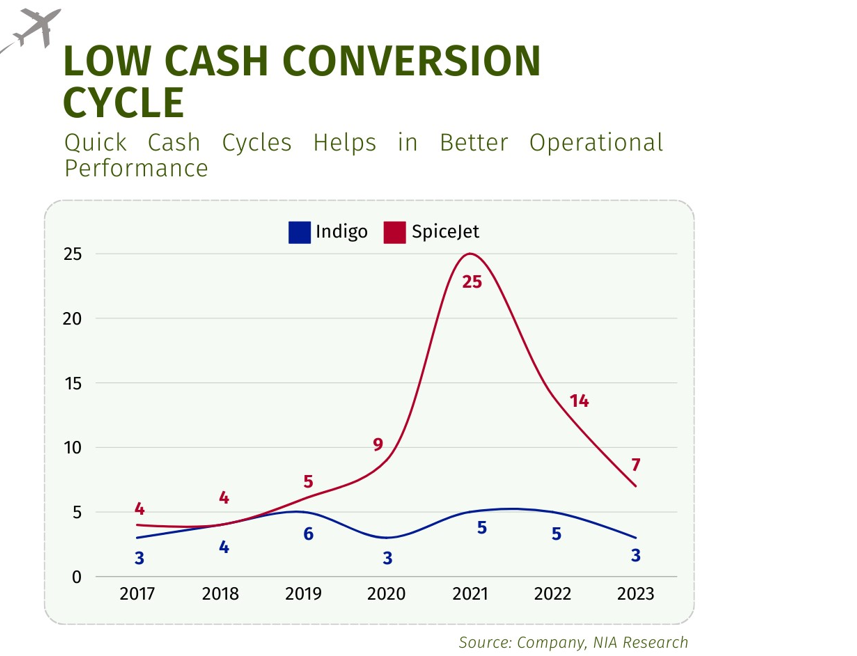
Indigo has managed to maintain a stable cash conversion cycle with the lowest in the industry conversion cycle of 3 days. Further, with a cash and cash equivalents balance of over Rs. 13,063 Crores as of 30 September 2023, the company appears well-prepared for capacity additions. This liquidity also aids in better credit ratings and therefore, lower lease finance costs.
All these strong fundamental metrics combined with tailwinds for the industry should lead to multiple benefits for the pioneer of the Indian aviation space, Indigo.
Whilst these factors do indicate a strong road ahead, various factors can impact the operations of the entity, such as weather-based disturbances, flight delays, operational issues, higher costs due to the grounding of aircraft, etc.
All things factored in, despite potential industry challenges, Indigo's robust operational metrics, strategic international expansion, stable yield strategy, efficient management, and strong cash position, position it well for growth.
Disclaimers and Disclosures
SEBI Registration No. :INH000017338, IN/AIF3/24-25/1571, IN/AIF2/24-25/1607 | BASL Membership ID: 6276
Investment in Securities Market are subject to market risks. Read all related documents carefully before investing. The securities quoted are for illustration only and are not recommendatory. Registration granted by SEBI, membership of a SEBI recognized supervisory body (if any) and certification from NISM in no way guarantee performance of the intermediary or provide any assurance of returns to investors.
Digital Infrastructure & Connectivity
National Stock Exchange Ltd.
Scope of NSE- A proxy play to the growing Indian Capital Market Whenever an investor makes a trade, there are various stock market participants that ensures smooth functioning of these trades. One such company is National Stock Exchange. Staying true to our investment style of peripheral play, we believe NSE is a good proxy play
Whenever an investor makes a trade, there are various stock market participants that ensures smooth functioning of these trades. One such company is National Stock Exchange. Staying true to our investment style of peripheral play, we believe NSE is a good proxy play on the growing Indian capital market. Let’s understand the scope and business model of how NSE derives its revenue and profitability.
The major participants of the market are explained below:
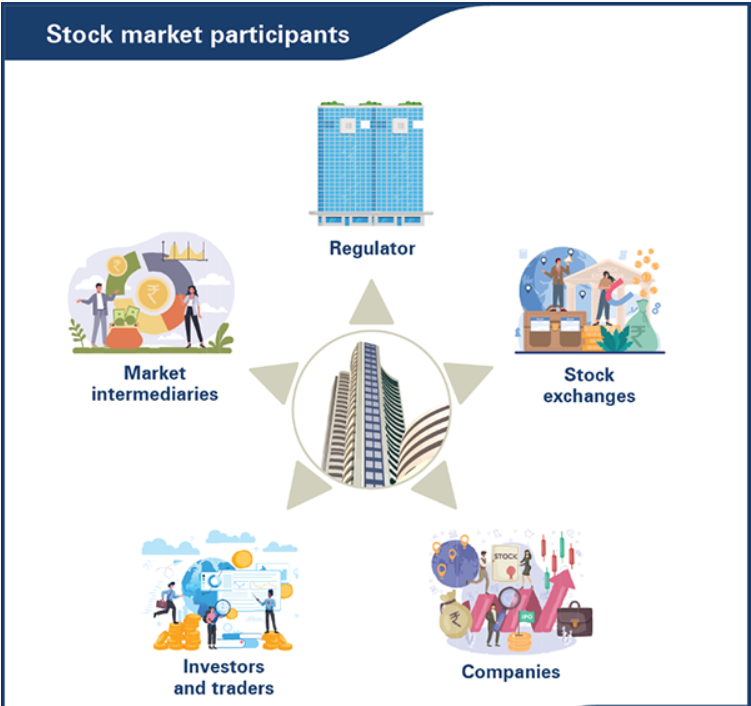
1. SEBI - SEBI stands for Securities and Exchange Board of India. It is a statutory regulatory body that protects the interests of investors along with regulating the securities market.
2. Market Intermediaries - Intermediaries are entities that are involved in a financial transaction in the market apart from the buyer and seller. These are institutions that help you carry out your investment activity smoothly while ensuring all the rules laid out by the regulator are met.
3. Investors- They are individuals or organisation that invest their money in the capital of various listed entities.
4. Companies- Every share that you see available to be purchased or sold in the stock market today are those issued by publicly traded companies. When a company makes an IPO it becomes publicly traded, which means it introduces itself in the stock exchange.
5. Stock Exchanges- Often used interchangeably with stock market, A stock exchange is a marketplace or the infrastructure that facilitates trading. On the other hand, a stock market is an umbrella term representing all of the stocks that trade in a particular region or country. One such example of a Stock exchange is NSE.
National Stock Exchange of India Limited (NSE) is one of the leading stock exchanges in India, based in Mumbai. NSE was incorporated in 1992, recognized as a stock exchange in 1993 and commenced operations in 1994.
NSE has been consistently ranked as the largest stock exchange in India in terms of total and average daily turnover for equity shares since 1995 (based on SEBI data). It is one of the largest stock exchanges in the world by market capitalization. NSE was the first exchange in India to implement electronic or screen-based trading which began its operations in 1994.
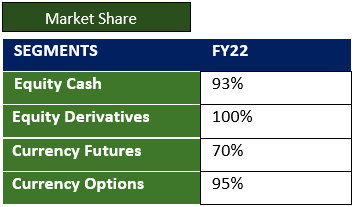
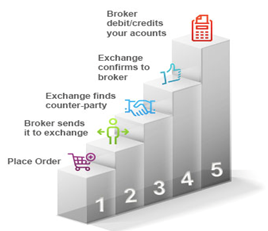
Companies list their securities on the stock exchanges and Investors invest in them via Brokers.
Companies pay the stock exchange listing fees to get their securities listed.
The brokers also charge transaction fees from investors for executing their trades on behalf of the Exchange.
These transaction charges are a direct source of income for Exchanges.
One such example of transaction charges charged by Zerodha (a broker) is shared in this snapshot below.
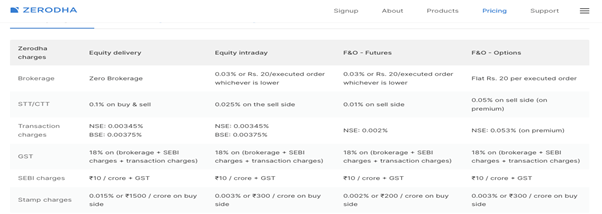
So, whenever an investor executes a trade, revenue in form of Transaction charges is received by the exchange.
Just like any other exchange, NSE offers services like exchange listing, trading services, clearing and settlement services, indices, market data feeds, technology solutions and financial education offerings.
Indian exchanges charge on value basis (turnover), whereas global exchanges charge on the basis of volumes.
Transaction charges are charges that the exchange levies on the trades conducted on the platform and are based on the transaction value.
It is directly proportional to the level of market activity, household savings and investments.
Transaction charges accounts for majority of the revenue mix of NSE.
Unlike global exchanges, NSE have high dependency on transaction charges since other revenue streams are at nascent stage.
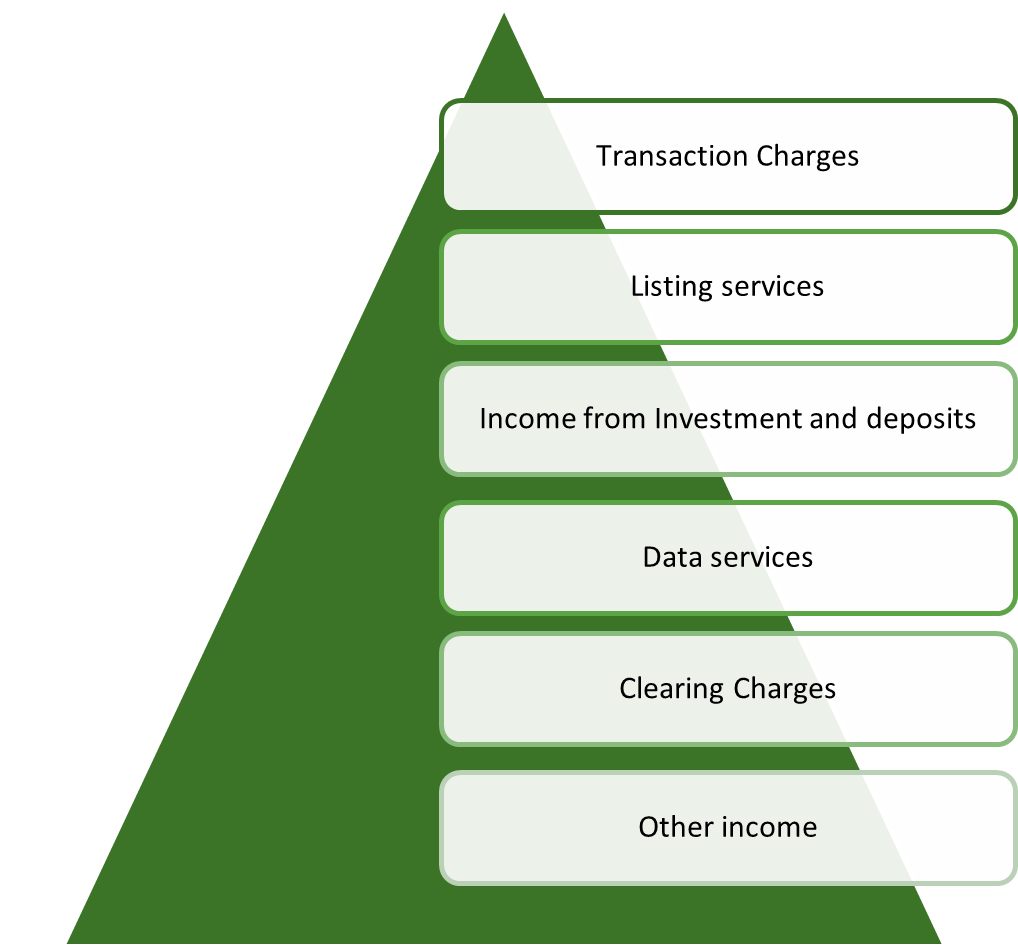
Growth Drivers in Transaction Charges:
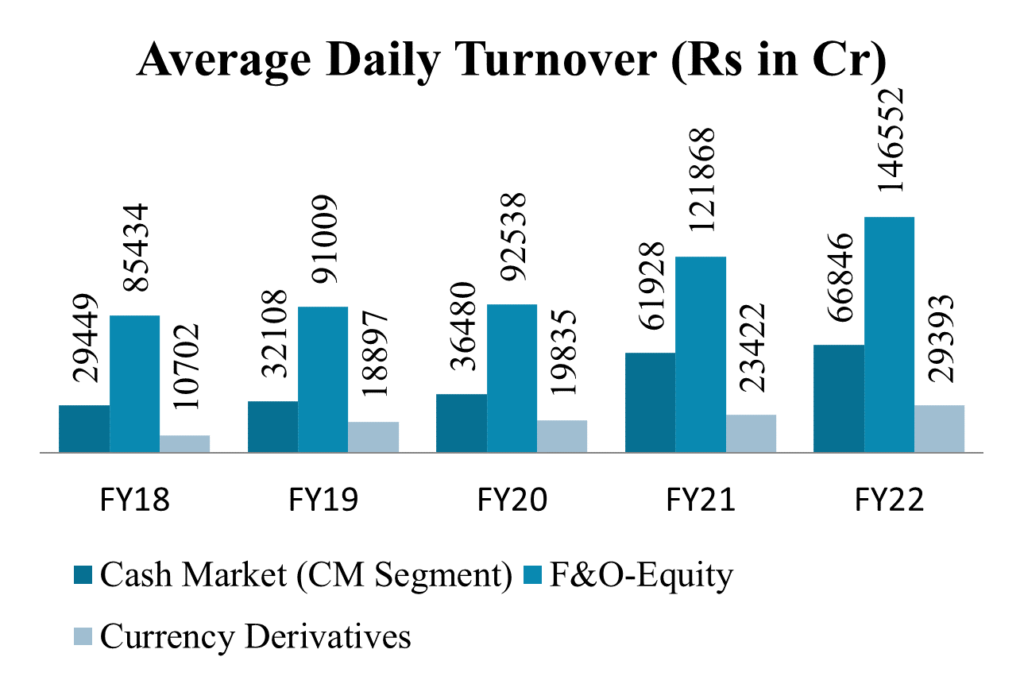
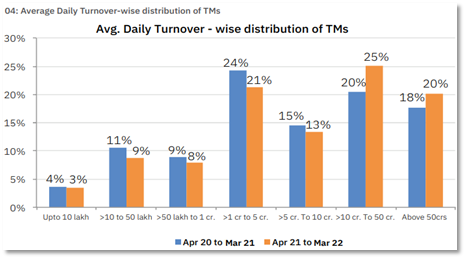
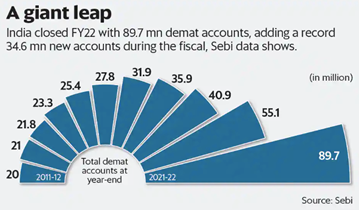
Just like any other company, NSE ltd also has a lot of expenses that are incurred regularly to ensure the smooth operations of the business. These are the major heads of expenses.
IT and telecom expenses and Employee expenses constitute nearly half of the total expenses incurred.
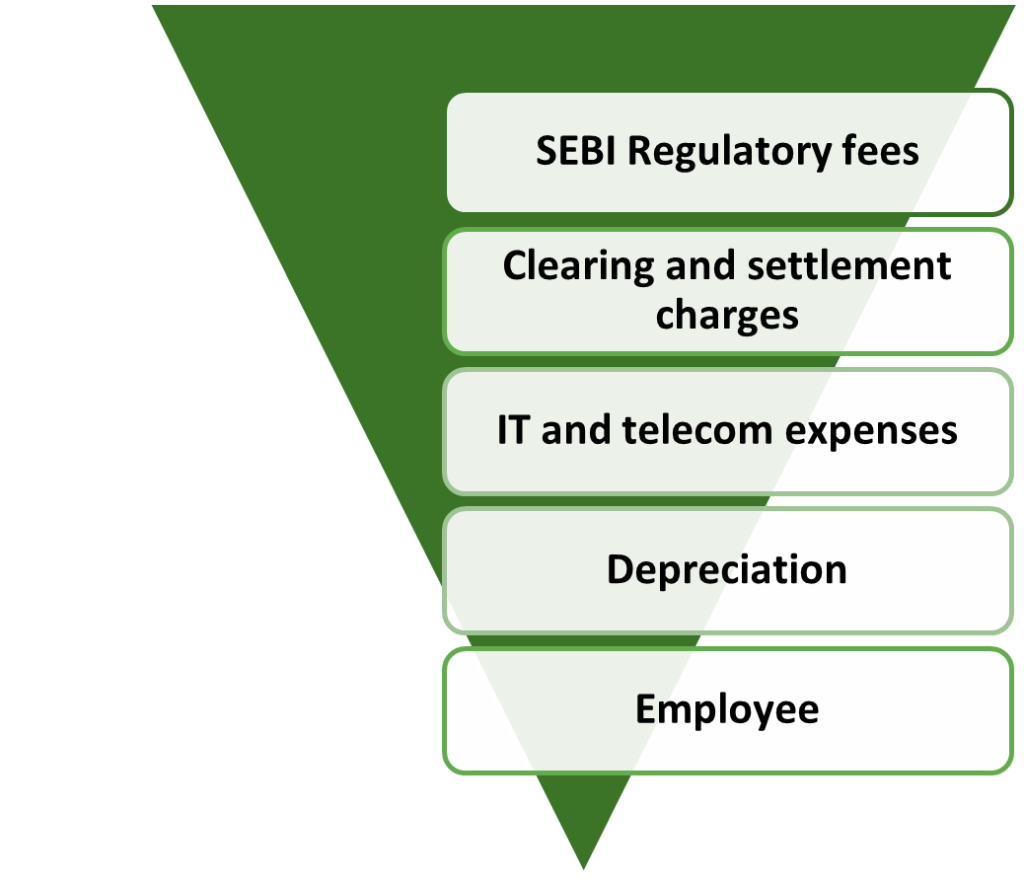
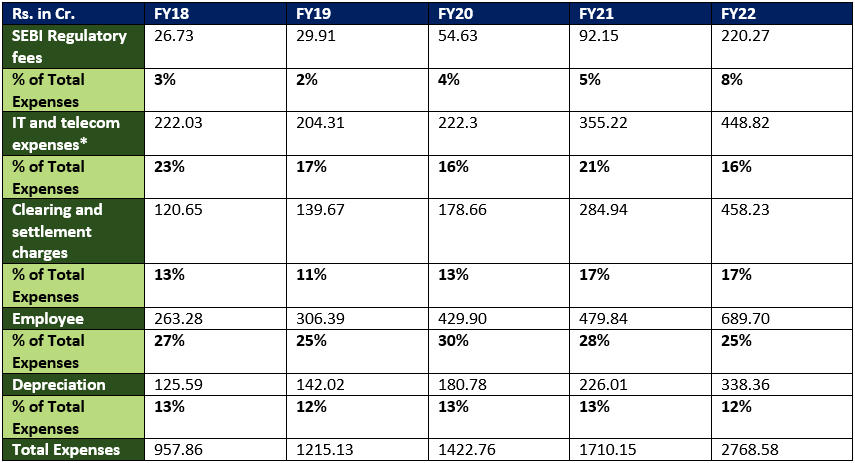
1. Undisputed leader - Derivatives contracts
NSE is an undisputed leader in the derivatives contracts segment. NSE has a huge running start and has virtually monopolized the entire segment. The most highly traded contracts in the derivative segment in India are the NSE’s major indices – the NIFTY 50 and Bank NIFTY which are exceptionally liquid. In comparison, the BSE enjoys far lower volumes among investors and traders alike.
Equity Derivatives – where NSE enjoys 100% market share contributes around 96% of total average daily turnover of Indian capital market.
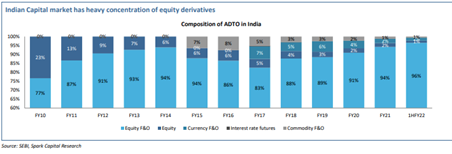
2. Increase in active User base registrations
People are becoming aware of investing in stock market as better asset class alternative.
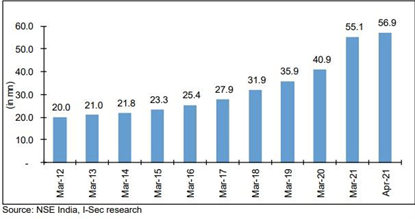
This rise in equity culture especially among new age investors proves to be boon for exchange like NSE.
3. Under Penetration of Capital Market
The level of capital market penetration is just 5% in India vis a vis 35-40% in developed countries. For an economy to grow, capital market development is imperative, and this provides huge scope of growth for NSE in terms of volumes and turnover.
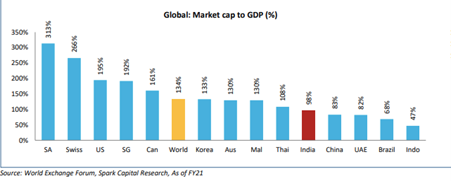
4. Trading at a low valuation compared to other exchanges listed in India
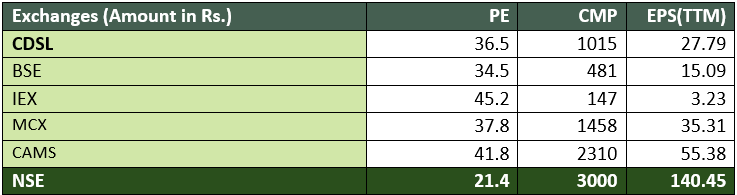
5. Focus on different segments:
NSE is trying to diversify its revenue sources through different products and services launch like NSE Prime, data dissemination services and colocation services.
6. Operating leverage Play:
Most of the expenses of the company are fixed in nature thereby providing an opportunity of operating leverage play with the increase in revenue.
7. Market Leader in most of the segments:
Largest stock exchange in equity derivatives and cash market in terms of total and average daily turnover.
8. New Developments: Benefitting from GIFT City
NSE and SGX (Singapore Stock Exchange) entered into a formal Collaboration Agreement to cement the key terms for operationalising the NSE IFSC-SGX Connect which will bring together international and GIFT City participants to create a bigger liquidity pool for Nifty products in GIFT City. The platform will lead to orders from SGX's 20 trading members being routed through the International Finance Centre for trading and execution and will consolidate the liquidity pool for Nifty products in NSE IFSC exchange.

NSE’s key revenue is derived through market activities. So, if overall sentiment is pulled down, this will reduce daily turnover. Hence, the transaction charges would decrease. Financial crisis can negatively impact the company’s business. The Company’s operations and investments are directly correlated with the health of the Indian as well as world economy, so any financial crisis would substantially hamper the company’s operations and financials.
Co-location scam is an allegation on NSE that few traders were able to get the market data earlier through an insider information about the servers which had the least load from NSE officials in IT department. This helped them to get the preferential access of the data resulting into windfall gains. Contingent Liability of Rs. 687.47 Cr. has been raised against NSE ltd. Possibility of huge penalty on the company for the same.
SEBI may bring in any law which it thinks is in the interest of public investors suspending any of the activities of SEBI-regulated entities posing a lingering risk.
Currently, around 80% of revenue is market linked. This is a sign of worry as any downward shift in market activity levels will have a direct impact on the company’s top line.
This sector is an oligopoly with NSE and BSE being the only major stock exchanges in India. BSE is the oldest stock exchange with around 6000 listed companies’ vis- a-vis NSE which has just around 2000 companies.


But still NSE has better margins. Here is a comparison between the margins of NSE and BSE. Clearly, NSE has better margins in both EBITDA and PAT.
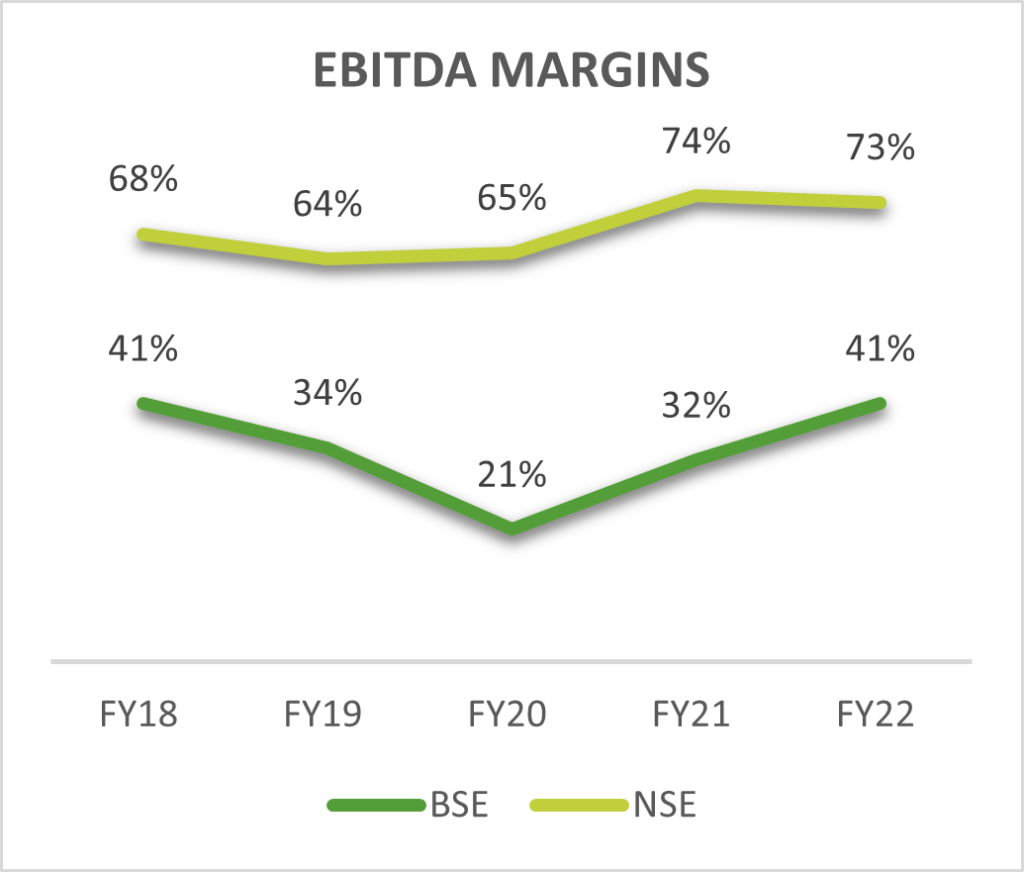
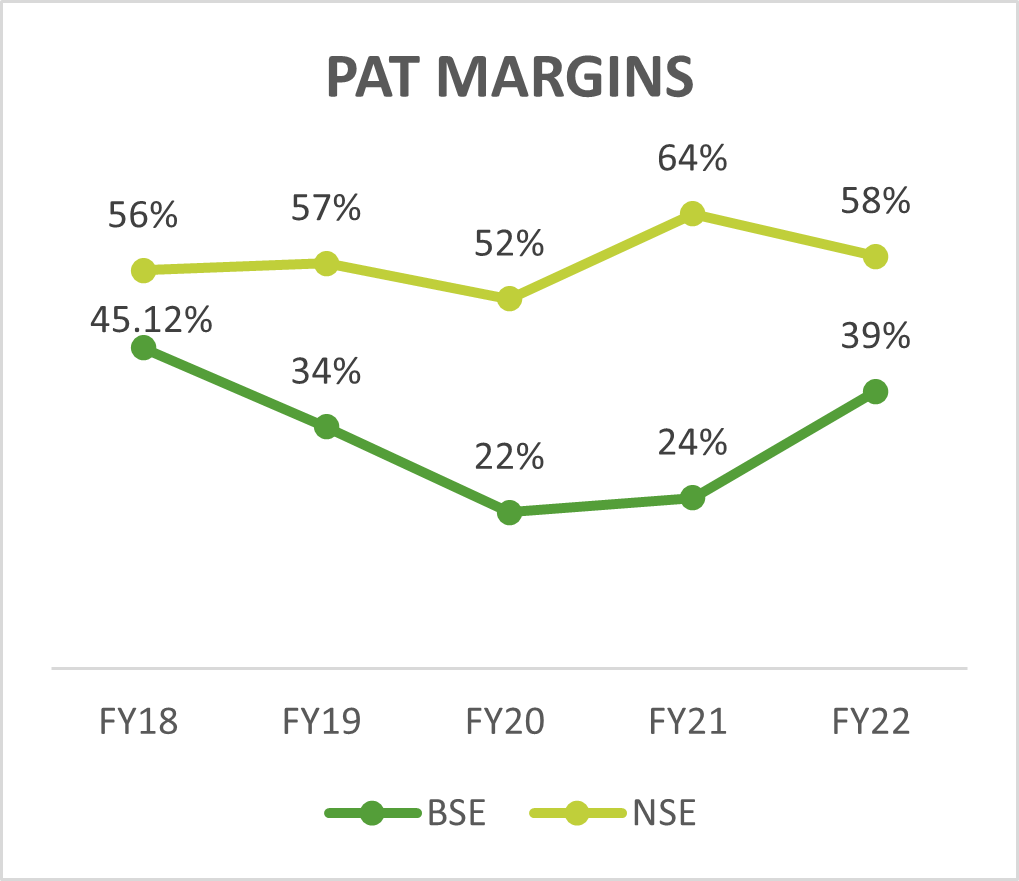
Globally also, when we compare with exchanges like NASDAQ, ICE and HKEX; NSE has grown at a very good rate and is not far behind HKEX.
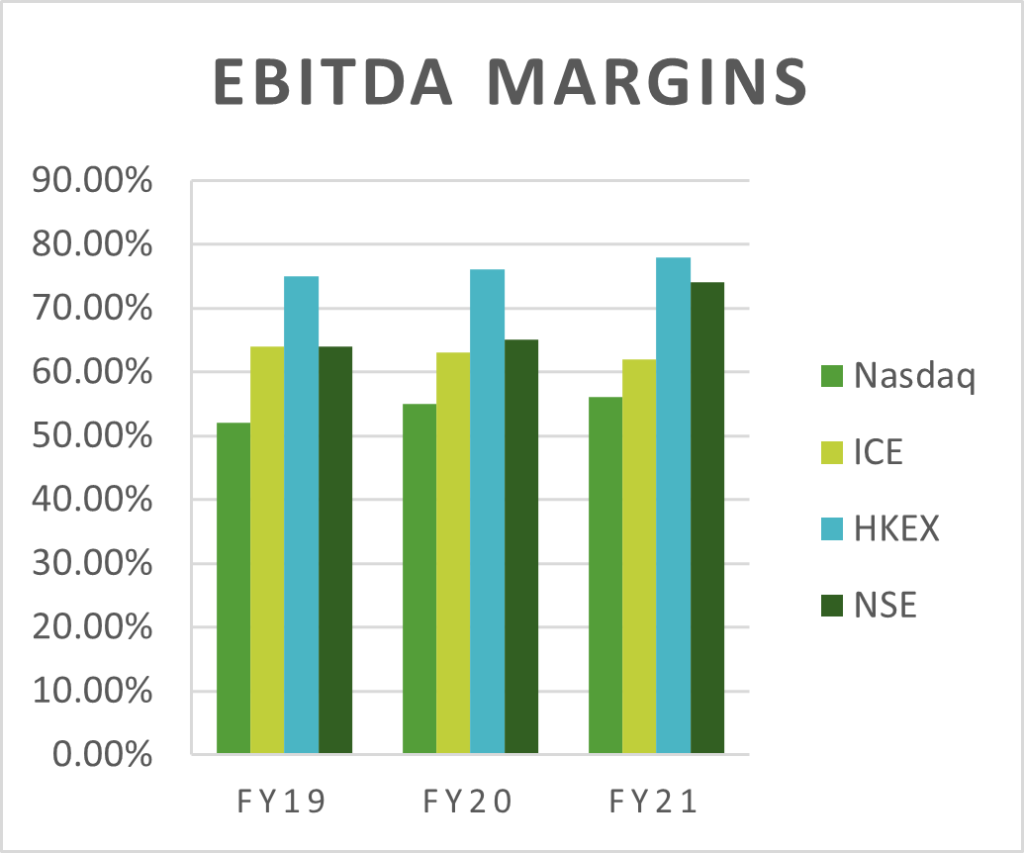
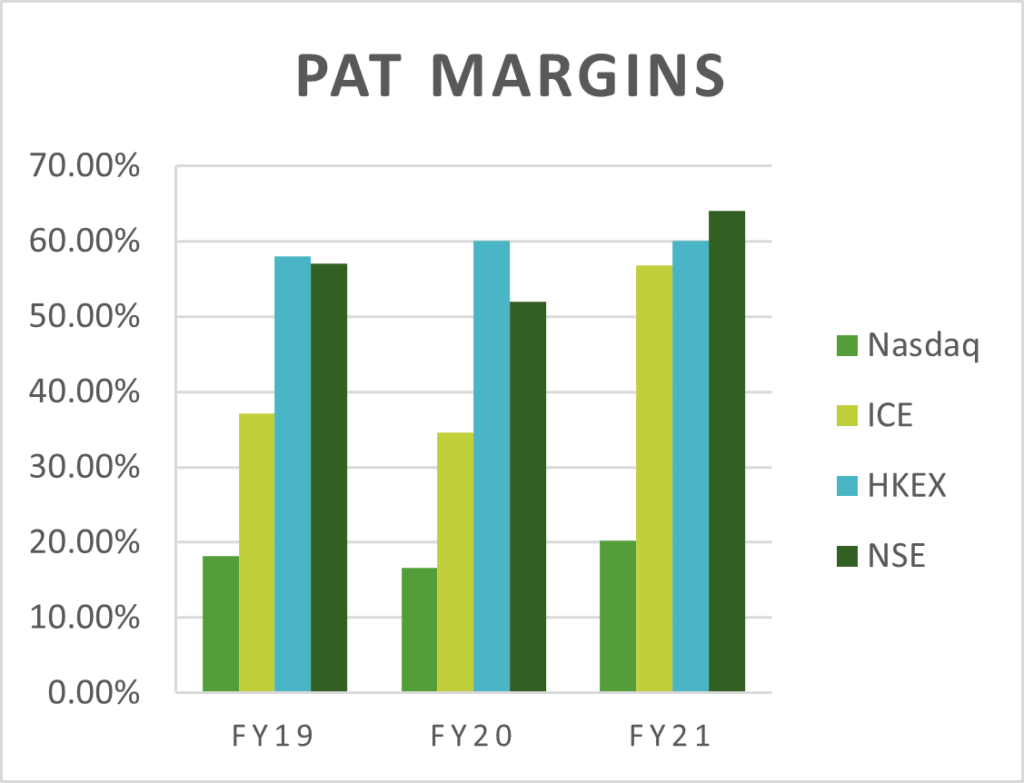


Income Statement for NSE ltd.
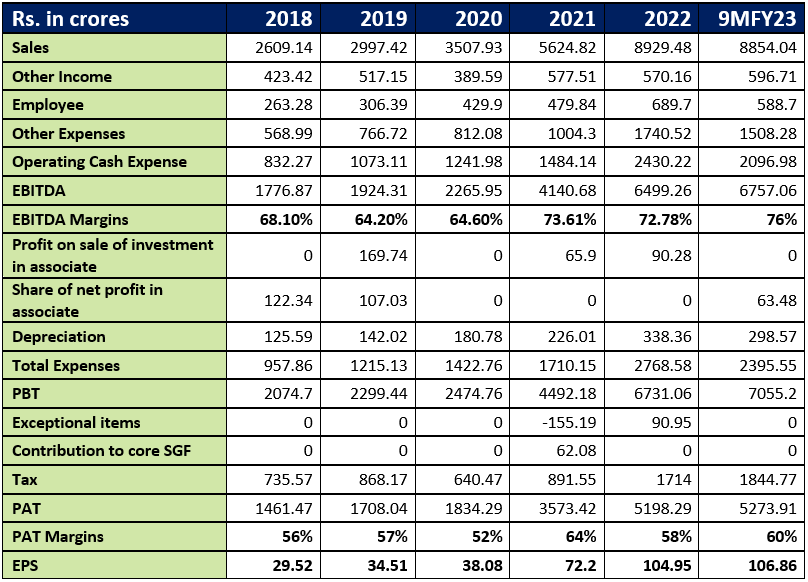
Balance Sheet of NSE ltd. For the years 2018-2022
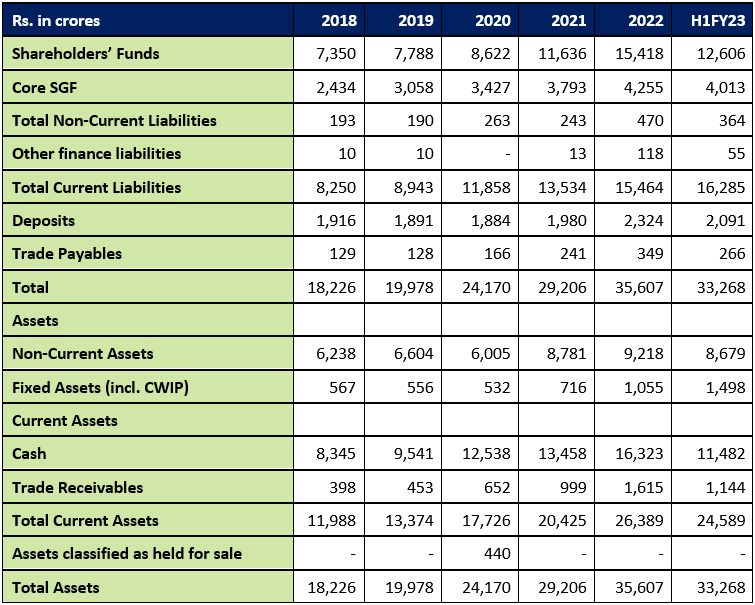
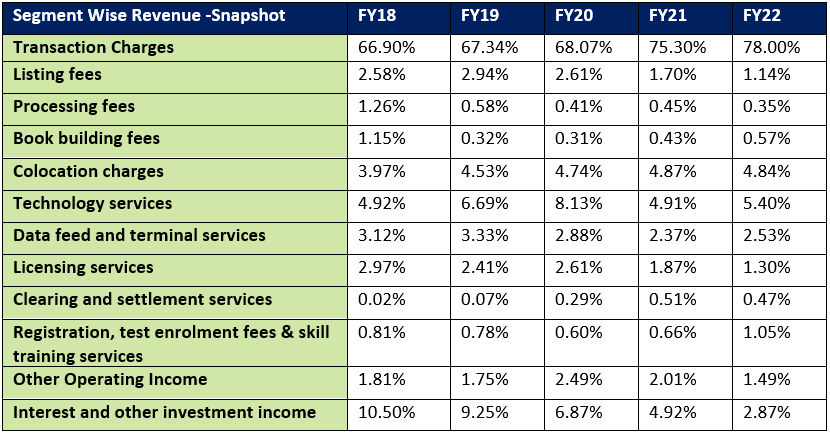
Return on Equity ratio for years 2018-2022
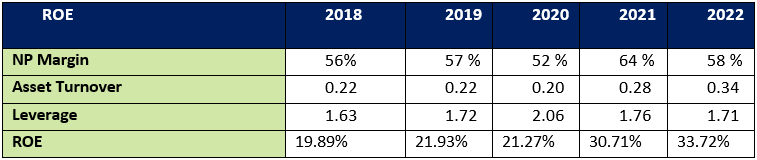
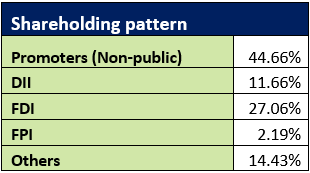
Disclaimer:
Niveshaay is a SEBI Registered (SEBI Registration No. INA000017541) Investment Advisory Firm. Our research expresses our opinions which are based on available public information, field research, inferences and deductions through our due diligence and analytical process. To the best of our ability and belief, all information contained here is accurate and reliable and has been obtained from public sources, which we believe to be accurate and reliable. We make no representation, express or implied, as to the accuracy, timeliness, or completeness of any such information or with regard to the results obtained from its use. This report does not represent investment advice or a recommendation or a solicitation to buy any securities.
Disclaimers and Disclosures
SEBI Registration No. :INH000017338, IN/AIF3/24-25/1571, IN/AIF2/24-25/1607 | BASL Membership ID: 6276
Investment in Securities Market are subject to market risks. Read all related documents carefully before investing. The securities quoted are for illustration only and are not recommendatory. Registration granted by SEBI, membership of a SEBI recognized supervisory body (if any) and certification from NISM in no way guarantee performance of the intermediary or provide any assurance of returns to investors.
Electric Vehicle & Ancillaries
Indian Aviation Industry: Who’s leading the Pack? (Part I)
Over the years, the aviation industry has witnessed numerous challenges aggravated by persistent stings of economic slowdowns, crude shocks and COVID-19 lead standstill. Despite these serious challenges, the Indian market has emerged as the third-largest and fastest-growing aviation market in the world, growing at almost 10 percent for the last decade, almost 2.5 times the
Over the years, the aviation industry has witnessed numerous challenges aggravated by persistent stings of economic slowdowns, crude shocks and COVID-19 lead standstill. Despite these serious challenges, the Indian market has emerged as the third-largest and fastest-growing aviation market in the world, growing at almost 10 percent for the last decade, almost 2.5 times the global average.
As the echoes of the COVID-19 standstill gradually fade, a notable shift emerges in the Indian aviation landscape. Once an aspirational luxury is now transforming into an indispensable convenience, ushering in a new era for the industry led by numerous factors.


A brief glimpse of the apparent tailwinds is highlighted in the graphic above:
On top of this, further capacity expansion plans of industry leaders like Indigo with close to 1000 aircraft on order, Air India with over 500 aircraft on order, and newcomer Akasa Air with over 50 aircraft on order signal robust demand expectations for the upcoming decade.
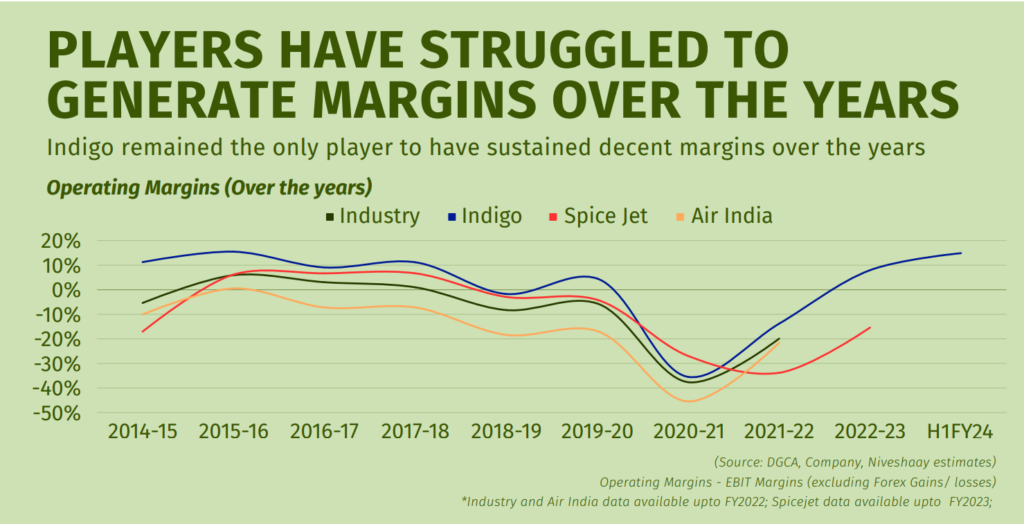
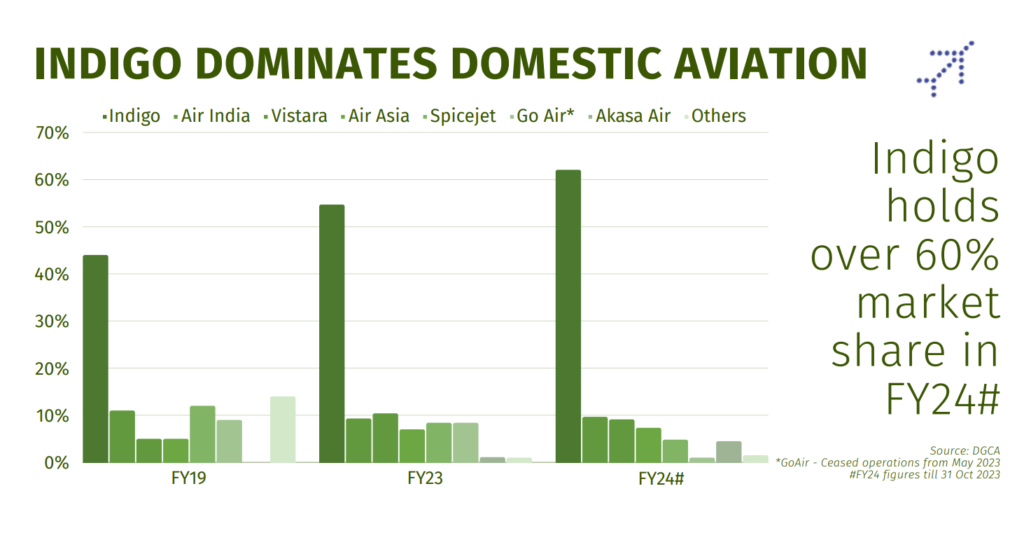
Established players, having weathered tough times, are set to benefit from favorable conditions.
Indigo, a standout performer for the past decade, boasts a dominant position in India's airspace, with over 60% domestic and 17% international market shares. Operating the youngest fleet (average age of 3.5 years) in the 100+ aircraft category and employing the Hub and Spoke model for high-faring routes, Indigo maintains high operational efficiency, ensuring stable margins compared to other airline players.
With an established market leadership position and the aviation sector's positive momentum, Indigo appears poised to capitalize on these tailwinds and extend its lead.
Part two delving deeper into the favorable economics of Indigo and its strategies that have propelled its growth over the years to be posted soon. Stay tuned.
Disclaimer:
Investment in securities market are subject to market risks. Read all the related documents carefully before investing. The content in these posts/articles is for informational and educational purposes only and should not be construed as professional financial advice and nor to be construed as an offer to buy /sell or the solicitation of an offer to buy / sell any security or financial products.
Registration granted by SEBI, membership of BASL and certification from NISM in no way guarantee performance of the intermediary or provide any assurance of returns to investors.
The securities quoted are for illustration only and are not recommendatory.
Disclaimers and Disclosures
SEBI Registration No. :INH000017338, IN/AIF3/24-25/1571, IN/AIF2/24-25/1607 | BASL Membership ID: 6276
Investment in Securities Market are subject to market risks. Read all related documents carefully before investing. The securities quoted are for illustration only and are not recommendatory. Registration granted by SEBI, membership of a SEBI recognized supervisory body (if any) and certification from NISM in no way guarantee performance of the intermediary or provide any assurance of returns to investors.
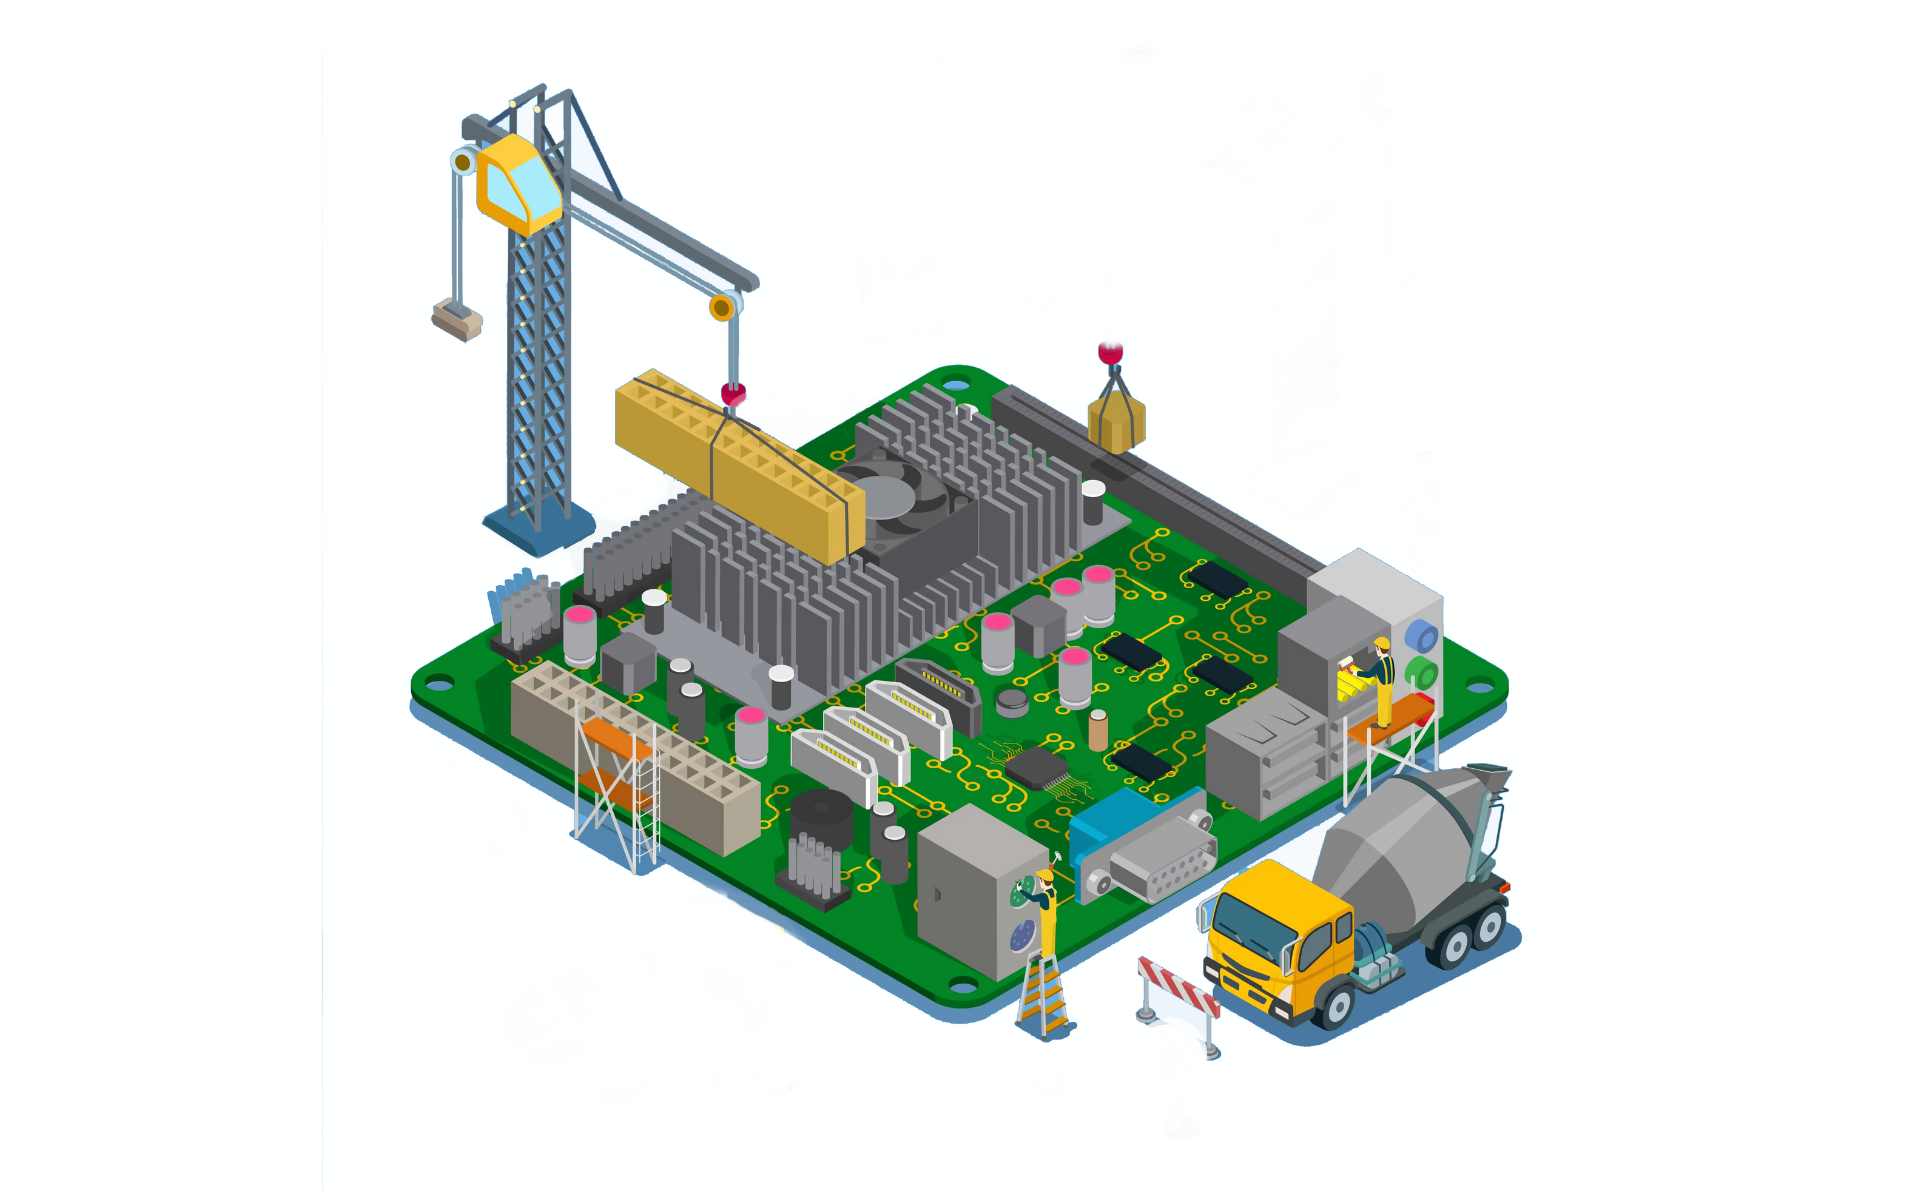
Electronic Manufacturing Services
Electronics System Design and Manufacturing (ESDM) Industry
Understanding Electronics System Design and Manufacturing Value Chain Analysis of ESDM Market Industry wise segmentation and growth opportunities Product/Service in ESDM Market Growth Drivers-Why is it right time for India? Industry Players Key Monitorable Factors Research Analyst - Karan Sanwal (karan.sanwal@niveshaay.com) Why does the industry look interesting to us? India has been importing huge quantities of
Research Analyst- Karan Sanwal (karan.sanwal@niveshaay.com)
Why does the industry look interesting to us?
India has been importing huge quantities of electronic products since decades. In fact, import of electronic products accounts for the second highest import bill. Multiple reasons like lack of infrastructure, technical know-how, cost competitiveness, etc., were responsible for low domestic manufacturing. However, there has been a paradigm shift where decades of hardship faced by electronic manufacturing companies has finally been converted to significant opportunities. Lots of factors have converged in the recent past that we are now standing at an inflection point. In modern-day India, when opportunity knocks the door, we grab it with both hands. What’s even more interesting is that if any company needs to achieve scale, they would want the entire electronics manufacturing ecosystem to develop. This would lead to simultaneous growth of multiple players, easy availability of advanced electronic products and a lower import bill. Win-win for everyone!
ESDM involves a process of conceptualization, design, prototyping, manufacturing, testing, and providing after-market services for electronic systems and components. The Original Equipment Manufacturer (OEMs) around the world are increasingly outsourcing their electronic product manufacturing to the ESDM players to focus on their core business of serving the end-user.
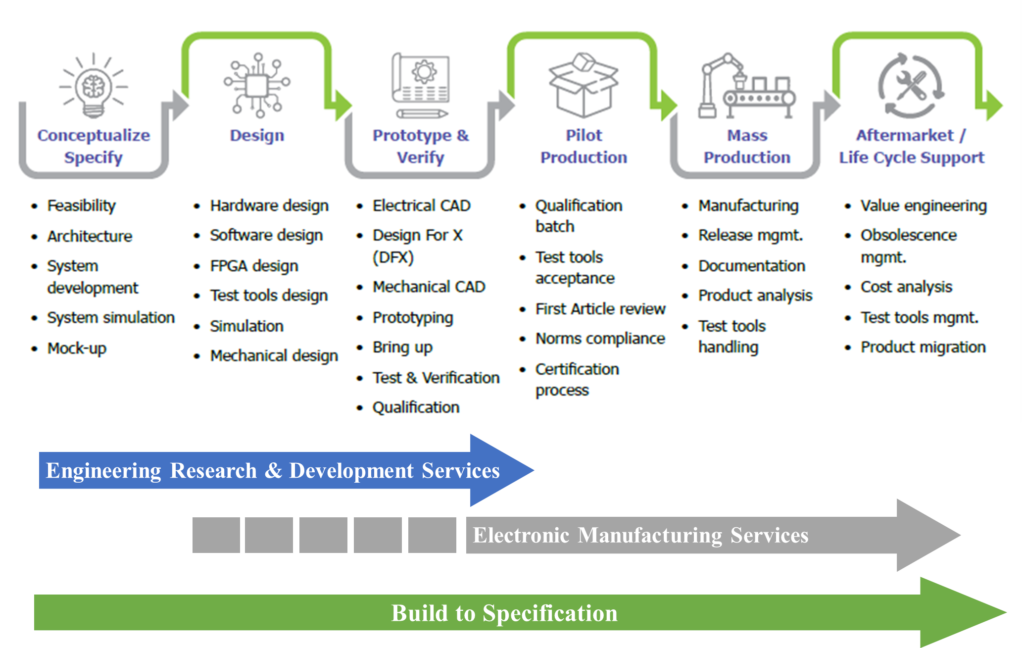
The ESDM company, which has a presence in all parts of the value chain, enjoys high margins due to higher operating leverage, economies of scale, and preference over competitors. The value chain of an ESDM industry can be divided as follows:
The global ESDM industry is expected to grow at a CAGR of 5.4% from CY21 to CY26E as opposed to 3.4% CAGR recorded from CY17 to CY21.
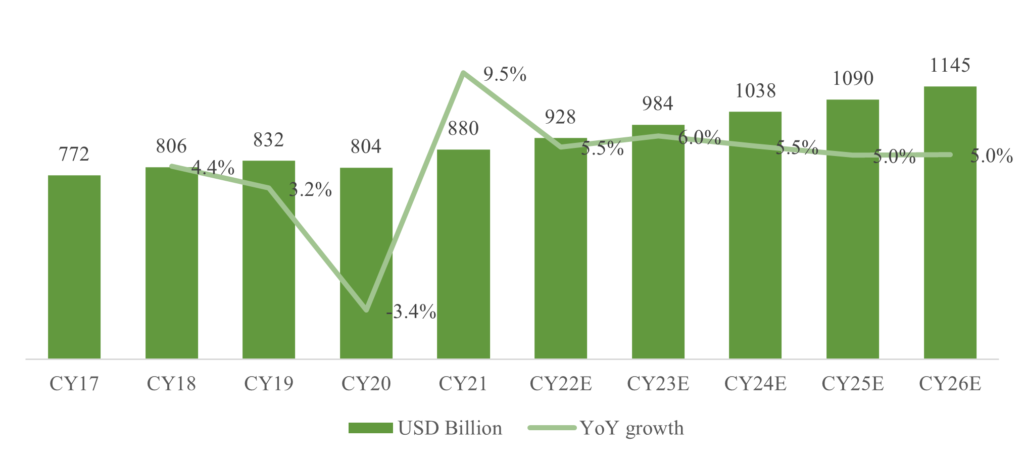
Even though the global ESDM market is expected to grow at a low single digit CAGR, India is going to outperform the market. The Indian ESDM industry is expected to grow at a CAGR of 32.5% from FY22 to FY27 as opposed to 22.2% CAGR recorded from FY17 to FY22.
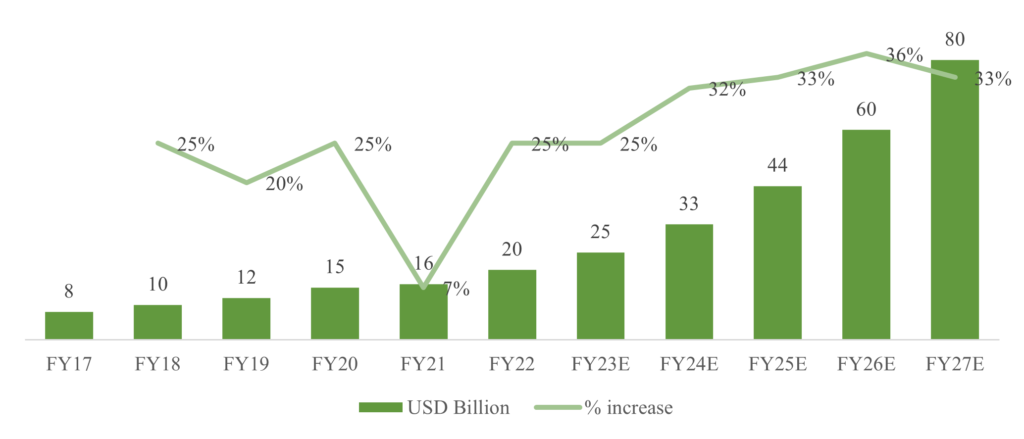
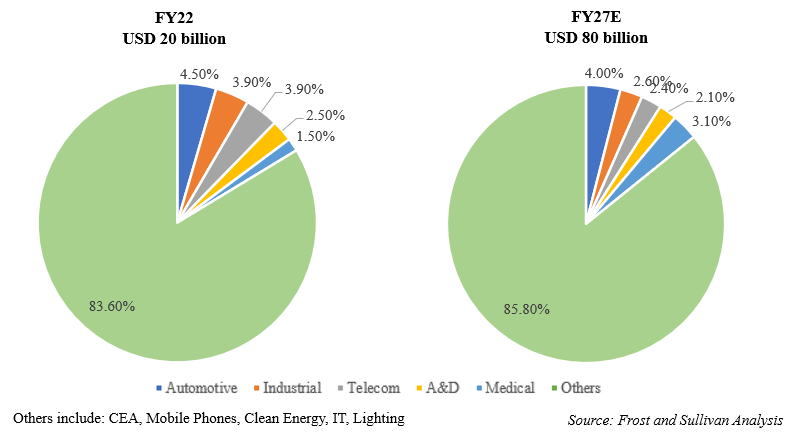
The advancement in technology and integration with artificial intelligence, machine learning, internet of things, etc., have increased the electronic content in products across various sectors. Some sectors like Aerospace & Defence, medical devices, etc., have high margins but could encounter problems related to higher gestation period and customer delays which puts pressure on working capital management. So, there are different models applicable for different sectors which are highlighted as below:
High Volume Low Margin (HVLM) model: Companies manufacturing highly automated electronics, mobile phones, or consumer electronics would be using the HVLM model. Companies try to grow volume with limited product range. Overstocking of inventory could be a problem.
Low Volume High Margins (LVHM) model: Companies manufacturing using the LVHM model would have low production volume with a wide product range. They must be able to quickly switch between different product types to accommodate customer demand. E.g., Clean Energy, Medical/ Healthcare, Aerospace & Defence, etc., have customized products with higher margins.
Low Volume Low Margins (LVLM) model: It involves companies with low production volumes and limited product mix. This could be beneficial in niche markets with high customization like Automobiles. It could also be used for prototype development
High Volume High Margin (HVHM) model: This model is prevalent in industries where products are customized and a wide variety of products are needed to meet customer demand. Effective inventory management is essential to manage a wide variety of products while avoiding stock-outs or overstocking. E.g., Internet of Things.
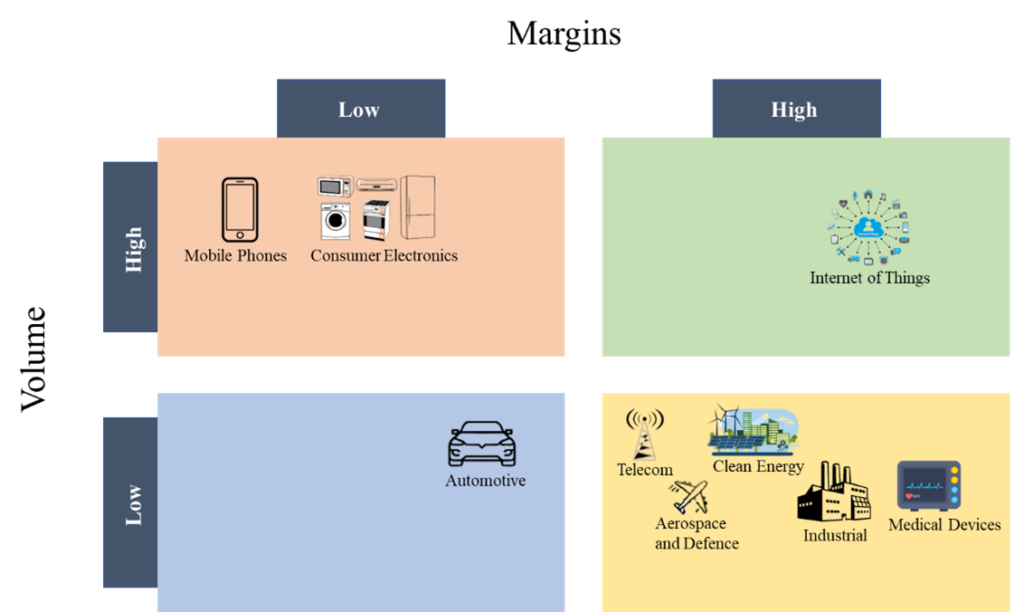
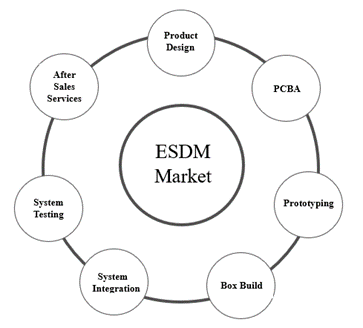
The ESDM market can be divided based on the process that starts from an idea and transitions through conceptualization of that idea along with mass scale manufacturing and after sales services.
It focuses on conceptualization of an idea based on customer requirements. Market research may also be conducted to understand the requirements of the end-users. Indian companies have started providing these services to penetrate the value chain.
A proof of concept is created to test the functionality of the product. A prototype is manufactured before mass-production. Changes could be easily made while products are at prototype stage to avoid major future challenges.
PCB is the core product in any electronic item. It has copper lines which electrically link connectors and components to each other. The electronic components are attached with either Surface Mount Technology (SMT) or Through-Hole Mounting (THM) which is known as PCBA. Due to inadequate domestic manufacturing of PCB, 80-90% are imported and only PCB Assembly is done in India. The bare PCB contributes to around 8-10% in the overall product cost in the majority of the industry. Gradually, the ESDM players are expected to manufacture bare PCB in-house to have more control over the process (better working capital management) and better margins through backward integration.
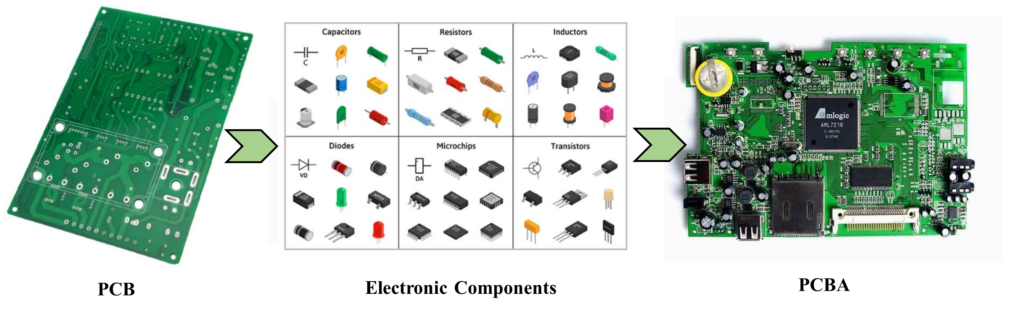
The board on the left side is the bare PCB. Various automated and manual processes are done to solder components on it based on the product requirements. Some of the domestic manufacturers of bare PCB include Shogini Technoarts Pvt. Ltd., AT&S India Pvt. Ltd., Ascent Circuits Pvt. Ltd, Epitome Components, etc.
It is a higher value-added product which constitutes a PCB in a small enclosure. An ESDM company needs to have a robust manufacturing infrastructure or an outsourcing vendor for components like Wire & Harness, Magnetics, Sheet Metals & Plastics Molding, and other electromechanical components that go in a box build. Indian companies are receiving more box builds orders which highlights the increasing vertical integration. This helps in better margins and long-term relationships with clients.
The Box builds are part of a sub-system. These subsystems are combined to form a system to operate it as a single unit. This process of combining the sub-system into a single system is known as system integration. For e.g., A car contains different sub-system for braking, engine, fuel management, etc.
The electronic products are tested at every stage i.e., from prototyping to dispatching to ensure that problems are not encountered by the end-user. Some sectors like aerospace, defence, railways, etc. have higher quality requirements leading to additional tests being conducted. Companies having better testing infrastructure are preferred by OEM.
After sales services like repair, rework, and maintenance are provided so that the product is functioning efficiently. It is also done to extend the life of the component. In high value items used in railways, aerospace, defence, etc., these services are of major importance as the cost of replacements are high.
The import of electronic goods accounts for the second highest import bill after oil. According to an industry report, the Indian ESDM market, which contributed to 2.2% of the global market in CY2021, is expected to contribute around 7% in CY2026.
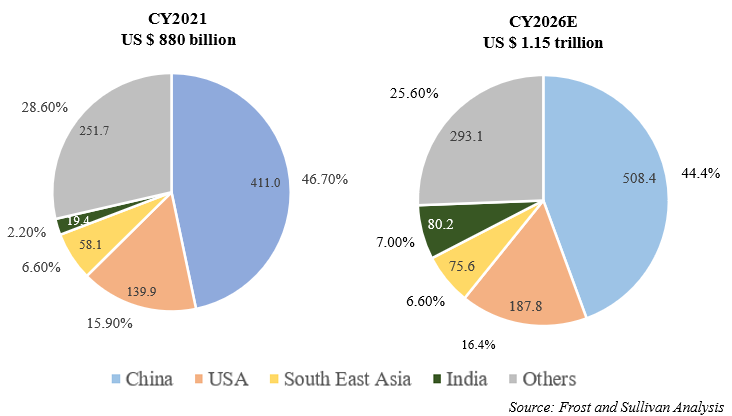
The global ESDM market is expected to grow at a CAGR of 5.40% over CY2021-CY2026. The major players in the global market are expected to grow at following CAGR:
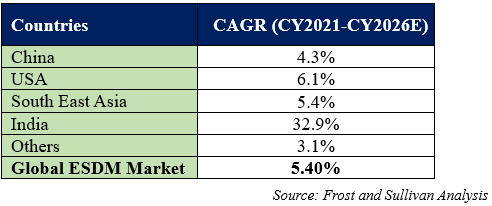
The substantial increase in India’s share is expected to come with contribution from multiple factors.
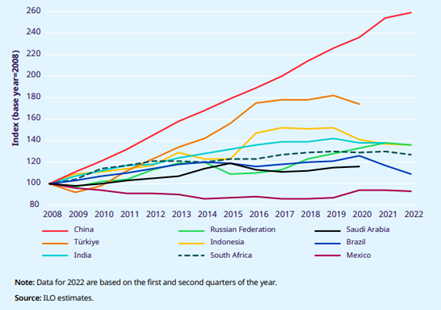
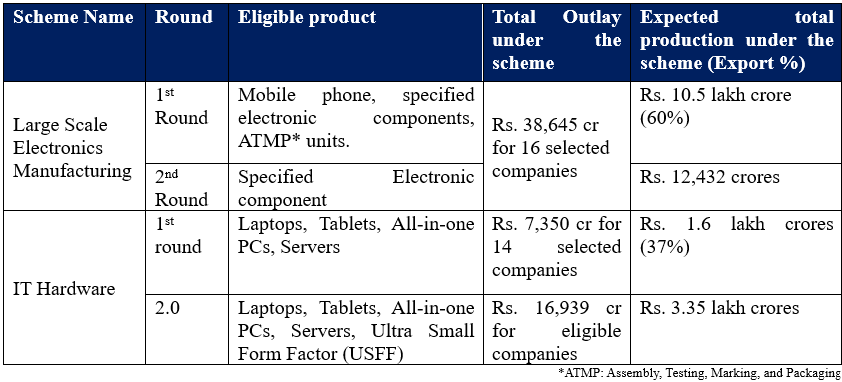
According to the industry report, all sectors in the Indian ESDM market are expected to outperform the sectoral growth in the global ESDM industry by a significant margin.
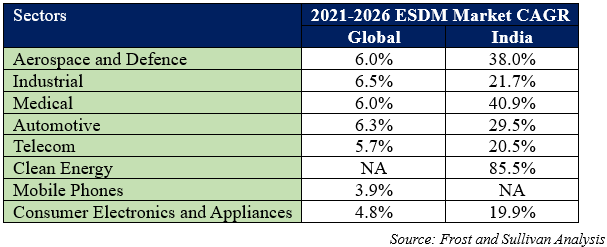
For any company, it is difficult to cater to all segments or sectors as the machinery, volume, and complexity of the products are different. So, companies develop a niche to focus on particular segments/industries. They make efforts to establish long term relationships with clients through timely execution of orders. The ultimate goal is to increase the scale of business, which helps in improving margins, revenue contribution, sourcing ability and negotiations.
Companies in the industry can be compared based on the sectors they serve, order book position, working capital management, timely execution, and profitability.
The below table highlights the industry players and the respective sector they serve:
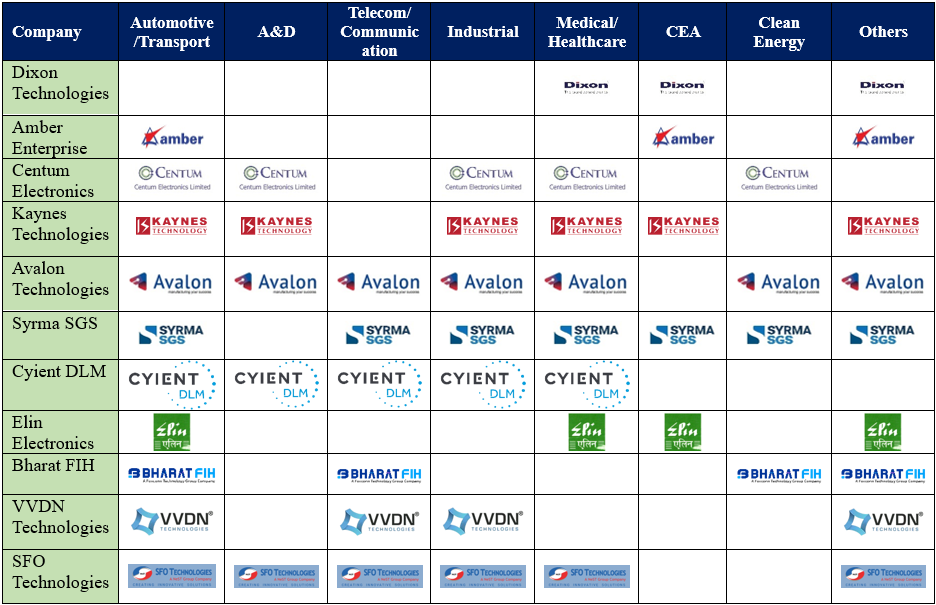
The ESDM industry has significant demand for multiple players to co-exist. The order book position of various companies and market forecasts highlights the upward trajectory. Though the industry is poised for significant growth, following parameters should be monitored:
Disclaimer:
Investment in securities market are subject to market risks. Read all the related documents carefully before investing.
Registration granted by SEBI, membership of BASL and certification from NISM in no way guarantee performance of the intermediary or provide any assurance of returns to investors.
The securities quoted are for illustration only and are not recommendatory.
Disclaimers and Disclosures
SEBI Registration No. :INH000017338, IN/AIF3/24-25/1571, IN/AIF2/24-25/1607 | BASL Membership ID: 6276
Investment in Securities Market are subject to market risks. Read all related documents carefully before investing. The securities quoted are for illustration only and are not recommendatory. Registration granted by SEBI, membership of a SEBI recognized supervisory body (if any) and certification from NISM in no way guarantee performance of the intermediary or provide any assurance of returns to investors.

Electric Vehicle & Ancillaries
Niveshaay’s Green Energy Smallcase journey since inception
Green Energy Smallcase Performance – Niveshaay launched the Green Energy Smallcase in March 2021, and since then, this portfolio has delivered 3x return. The portfolio primarily consists of three themes: Renewable Energy, Electric Mobility, and Recycling. These themes have performed exceptionally well in recent years, driven by the ambitious goal of achieving net-zero carbon emissions worldwide. GREEN ENERGY
Green Energy Smallcase Performance – Niveshaay launched the Green Energy Smallcase in March 2021, and since then, this portfolio has delivered 3x return. The portfolio primarily consists of three themes: Renewable Energy, Electric Mobility, and Recycling. These themes have performed exceptionally well in recent years, driven by the ambitious goal of achieving net-zero carbon emissions worldwide.
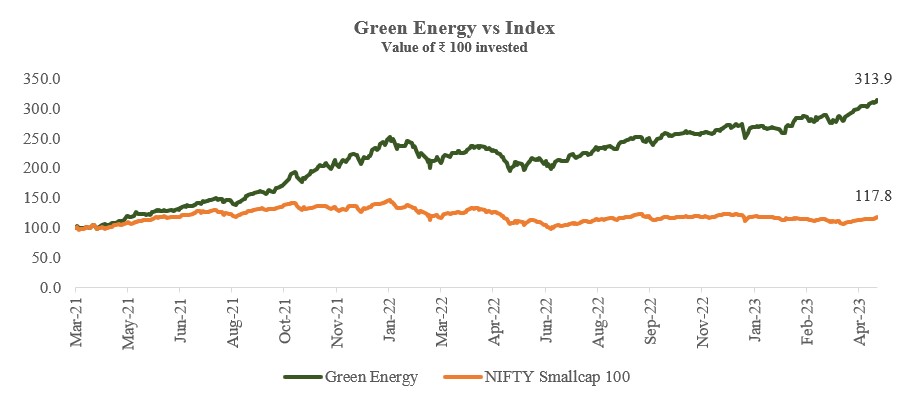
GREEN ENERGY BEGINNING
The portfolios were deep red in 2020, but our hustle to make them green eventually led us to uncover the "Green Energy" portfolio. We hopped around the city to meet a few entrepreneurs across several industries, and our visit to Navitas Solar, a leading solar module manufacturer, caught our attention regarding the changing dynamics of the solar industry. The discussions progressed, and it was quite shocking yet equally attractive to see how solar glass prices were continuously skyrocketing.
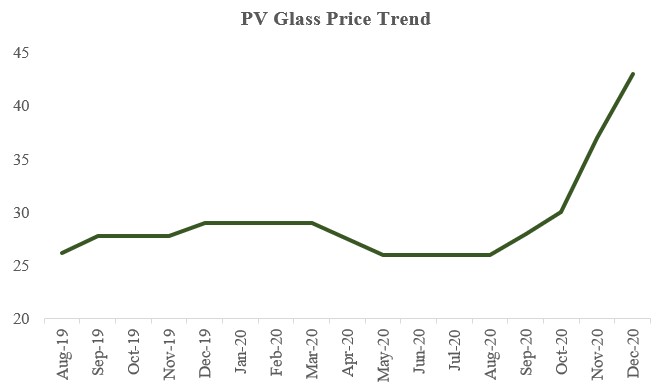
This led us to the sweet discovery of "Borosil Renewables." The excitement didn't make us forget our roots, and we began our research process for the same. We studied global markets, particularly China, which leads the solar market. We found that the Clean Energy Index and Solar ETF were consistently outperforming the benchmarks. The commitment of capital towards cleaner energy and ESG norms was significant.
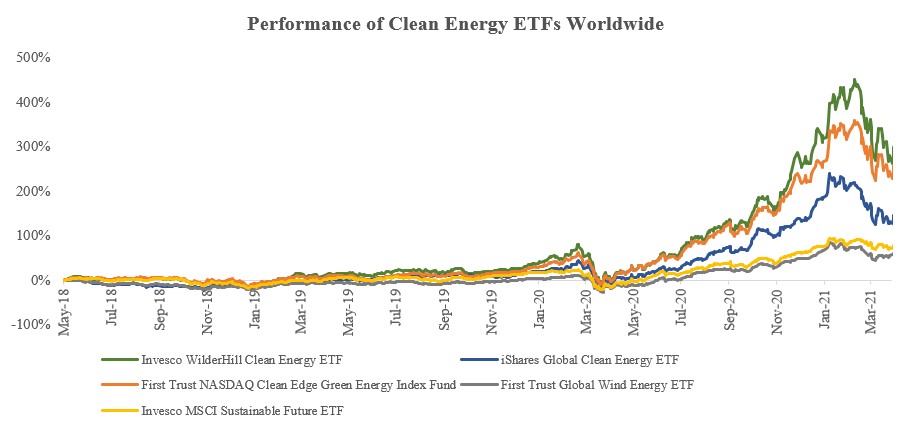
All major companies in the sector SunRun Inc (US:RUN), Xinyi Solar (HK:968), Flat Glass (HK:6865), Longi (CN:601012), Canadian Solar (CSIQ) and Jinko Solar (JKS) has given a return of 150-500% in last 1 year (Dec 19 – Dec 20).
While it was conclusively evident that “Borosil Renewables” is a story in making but the bigger picture was the renewable energy sector. Looking at all these trends, we really wanted to put our hands deep into this but faced a lot of difficulty in finding appropriate companies.
After identifying Borosil Renewables and observing the global green energy trend, we began exploring how to capitalize on the green energy theme in India. A few data points have supported our Green Energy portfolio thesis. Spending on renewable energy was on the verge of becoming the largest area for spending in the energy sector.
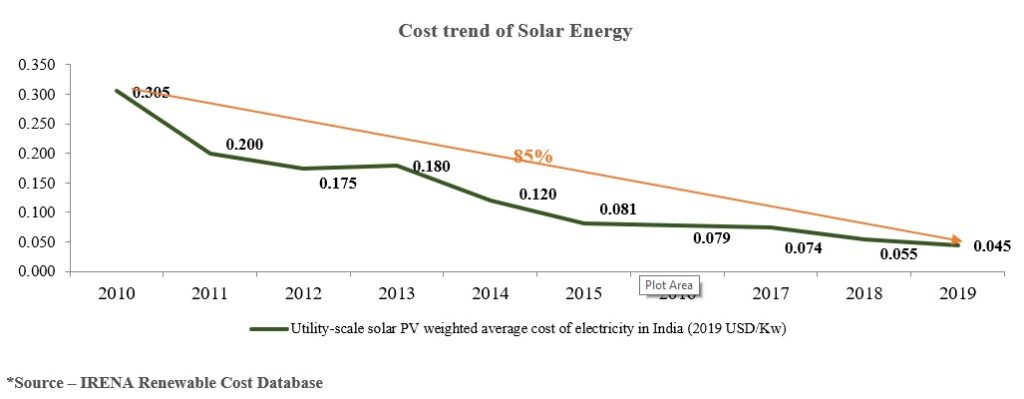
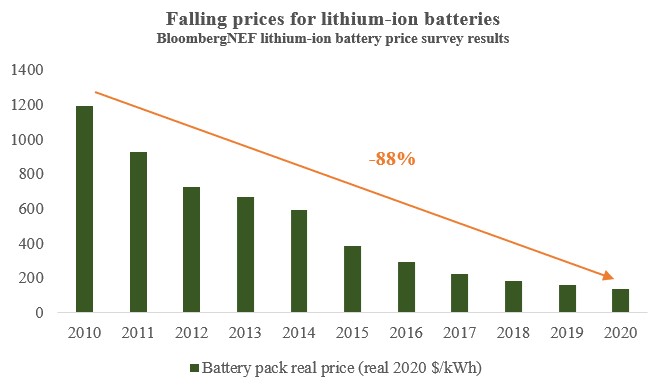
After examining various data and recognizing the government's focus on this sector, we made the decision to launch the Green Energy portfolio.
OUR STRATEGY FOR GREEN ENERGY PORTFOLIO
Selecting companies in the Indian market for the Green Energy sector posed significant challenges due to the absence of profitable and strong players. Rather than directly investing in EV manufacturers, battery manufacturers, and renewable energy generation companies, we opted to invest in indirect beneficiaries of the green energy theme.
We placed our focus on companies that demonstrated strong cash flow generation and maintained a debt-free status. This strategy has proven to be highly effective, resulting in a remarkable threefold return since our launch in March 2021 over the past two years. Our approach was simple yet effective: to avoid significant losses and ensure a better margin of safety by investing in companies with robust cash flow generation and reasonable valuations.
OUR TOP PERFORMERS IN LAST 2 YEARS
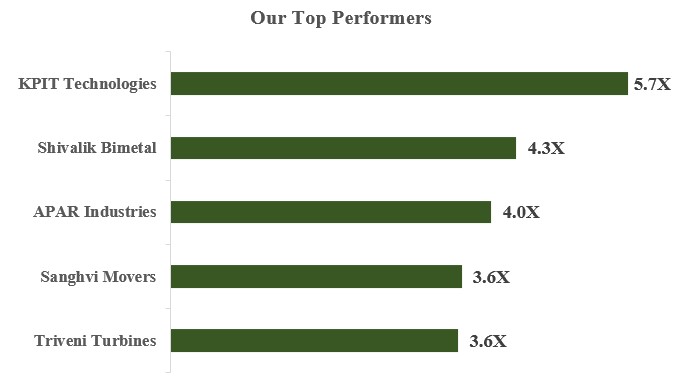
The company is a prominent supplier of critical components for Electric Vehicles, Energy Storage Devices, Switchgear, Electrical Appliances, and Smart Meters. It specializes in manufacturing shunt resistors, which are electrical components responsible for regulating the flow of electrical current within a circuit. These resistors are utilized for measuring and sensing current flow, as well as providing a low-resistance path for electric current.
Shunt resistors find applications in Electric Vehicles, Energy Storage, Smart Meters, and Power Modules. The manufacturing of these resistors necessitates expertise in specialized welding techniques. The company serves a highly specialized market segment.
Smart meters contribute to 45% of the overall shunt resistor business, while battery management systems (BMS) make up the remaining 55%.
Shivalik Bimetal Controls is classified as a tier 3 player in the EV supply chain. The company has directly benefited from the global trend towards electric vehicles, as evident from its revenue growth.

2. KPIT Technologies Limited
The company generates revenue primarily from the automotive sector. It actively participates in emerging technologies, including autonomous driving, vehicle connectivity, and electric vehicles. The company has established strong relationships with top global automotive original equipment manufacturers (OEMs).
Its continuous high growth in automobile engineering is supported by the increased research and development (R&D) expenditures from both the OEMs and tier-1 suppliers, focusing on emerging technologies such as autonomous vehicles and electric vehicles.
Indeed, KPIT Technologies has a diverse customer base that includes all major global original equipment manufacturers (OEMs) in the automotive industry. This wide range of clients ensures that the company is not reliant on the success of any single player in the electric vehicle (EV) industry. Regardless of which player emerges as the leader in the EV race, KPIT has significant potential for revenue growth due to its strong customer relationships and broad market presence.
According to McKinsey, the global automotive software and electronics market is anticipated to reach $462 billion by 2030, reflecting a compound annual growth rate (CAGR) of 5.5 percent from 2019 to 2030. In contrast, the overall automotive market for passenger cars and light commercial vehicles (LCVs) is projected to experience a more modest compound annual growth rate of 1 percent during the same period.
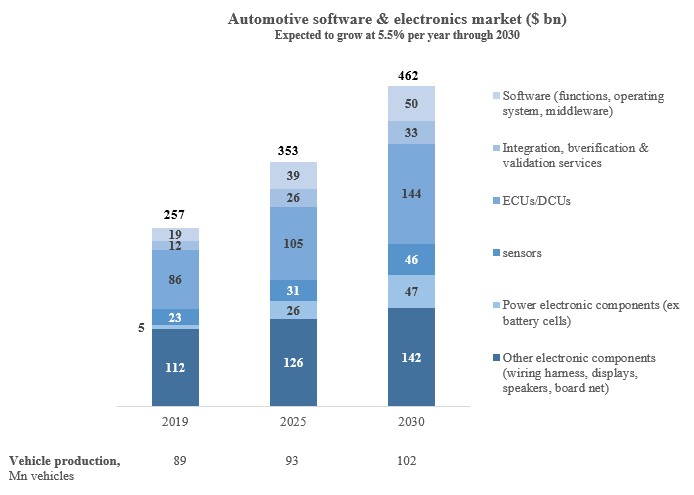
The impact of these trends is clearly evident in the recent growth of KPIT Technologies.

3. Apar Industries Limited
APAR Industries is a prominent global manufacturer specializing in conductors, cables, specialty oils, lubricants, and polymers. It stands among the top three producers worldwide for conductors and specialty oils, and it holds the position of the largest cables manufacturer for renewables in India. The company's three divisions—cables, conductors, and oil—are all benefiting from the push towards renewable energies.
The cables business has demonstrated robust growth in the export market and is projected to sustain a growth rate of 25-30% over the next five years. This growth has the potential to drive the share of cables to exceed 50% within the next five to seven years, resulting in an overall margin-enhancing impact on the business.
The company's favourable valuations, coupled with the increased global focus on renewable energy infrastructure, have fueled a strong momentum in its business growth. As a result, the company has experienced a re-rating of its valuations.

4. Sanghvi Movers Limited
The company is the largest crane rental company in India and holds the 6th position globally in terms of size. It boasts a fleet of 389 cranes with lifting capacities ranging from 40 tons to 800 tons. Additionally, the company owns and operates 17 depots strategically located throughout the country.
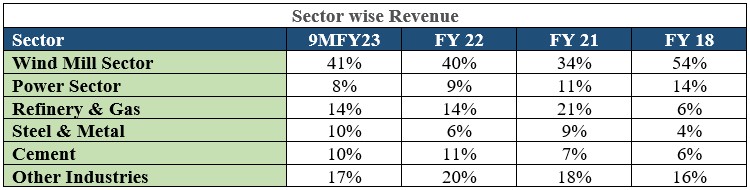
The Wind Mill and Power sectors are the primary industries for the company, and it specializes in owning a significant number of high-tonnage cranes. In the windmill sector, where installations are carried out at greater heights, larger tonnage cranes are essential to meet the requirements.

The average blended yield has increased to 2.15% in Q3 FY23, driven by high demand.
The company's attractive valuations, coupled with its strong earnings growth momentum and visibility of future growth, have led to a re-rating of the company.

OUR MISTAKES
Sona BLW Precision Engineering specializes in manufacturing precision forged bevel gears, differential assemblies, starter motors, and traction motors for automotive applications. The company has made substantial strides in the Battery Electric Vehicle (BEV) segment, increasing its presence from 1% in FY19 to 25% in FY22. Around 52% of its revenue is derived from gears and sub-assemblies that can be utilized in both internal combustion engines and EVs.
While the company experienced growth, a slower-than-expected growth rate and higher valuations contributed to the correction of its share price from its peak level. We exited the company with a profit; however, there was still a significant correction from its peak due to the higher valuation.
A similar situation occurred with C.E. Info Systems Ltd, where we entered at higher valuations, and slower growth than expected resulted in some correction. We exited this position with a loss of 17%.
TAPPING SOME UNLISTED OPPORTUNITIES
We constantly dwelled our efforts into finding companies which are benefitting through the transition happening across the green energy sector. To understand the competition and industry dynamics better, we even researched about private companies and their growth plans going forward.
We came across Waaree Energies Ltd. during our journey of managing Green Energy Smallcase. With a current capacity of 11 GW, it is India’s largest solar PV module manufacturing company. Considering it had only 2GW capacity in 2021 i.e., 2 years back, it has exponentially increased its capacity because of rising demand and healthy order book.
We participated in the fund raise of when Waaree Energies Ltd. did a private round of funding. It has turned out to be significant outperformer with its valuation more than double.
The company is now vertical integrating into cell manufacturing which will further expand operating margins of the business by 5%. It is also expected to further increase the capacity to 16 GW by 2025.
GOING FORWARD
Our journey with the Green Energy portfolio over the past two years has been fantastic. Throughout this period, we have conducted extensive research on the industry and continue to believe that there is immense potential in this sector. The green energy industry is still in its early stages of development, and we foresee significant opportunities in the next decade. We are optimistic about the future and excited to explore the many prospects that lie ahead in the field of green energy.
Disclaimer:
Niveshaay is a SEBI Registered (SEBI Registration No. INA000017541) Investment Advisory Firm. Our research expresses our opinions which are based on available public information, field research, inferences and deductions through our due diligence and analytical process. To the best of our ability and belief, all information contained here is accurate and reliable and has been obtained from public sources, which we believe to be accurate and reliable. We make no representation, express or implied, as to the accuracy, timeliness, or completeness of any such information or with regard to the results obtained from its use. This report does not represent investment advice or a recommendation or a solicitation to buy any securities.
Disclaimers and Disclosures
SEBI Registration No. :INH000017338, IN/AIF3/24-25/1571, IN/AIF2/24-25/1607 | BASL Membership ID: 6276
Investment in Securities Market are subject to market risks. Read all related documents carefully before investing. The securities quoted are for illustration only and are not recommendatory. Registration granted by SEBI, membership of a SEBI recognized supervisory body (if any) and certification from NISM in no way guarantee performance of the intermediary or provide any assurance of returns to investors.

Consumer Durables, Services & Consumption
Frequently Asked Questions by Niveshaay Subscribers
Q1. Which Niveshaay smallcase should we invest in? The choice of smallcase for investment depends on your investment horizon, risk tolerance, and financial goals. Each smallcase is designed with a specific investment objective and strategy in mind. It's essential to evaluate your own investment horizon and risk appetite before deciding which smallcase aligns best with
Q1. Which Niveshaay smallcase should we invest in?
The choice of smallcase for investment depends on your investment horizon, risk tolerance, and financial goals. Each smallcase is designed with a specific investment objective and strategy in mind. It's essential to evaluate your own investment horizon and risk appetite before deciding which smallcase aligns best with your financial objectives.
We offer six smallcases and you can learn more about them here. To start with the investing journey, one can consider strategy-based portfolios such as Mid and Small Cap Focused Portfolio Fundamental, Trends Trilogy Fundamental, which are our diversified portfolios and cater to multiple sectors. You may also explore our thematic portfolios, such as Green Energy Theme, Niveshaay Consumer Trends Portfolio Theme, Make in India Theme. Recently we have also launched our Niveshaay IPO Basket Fundamental which provides a unique opportunity to invest early in companies set to become future industry leaders.
Q2. Is there any minimum investment requirement for your portfolio?
The minimum investment amount is calculated based on the underlying stocks and their weights, based on the current market price. Once this amount is invested, the SIP amount will be fixed.
The SIP amount is calculated based on your Minimum Investment Amount (MIA). If the investment amount is less than INR 12,000, then the minimum SIP amount equals the investment amount. If the investment amount is more than INR 12,000, then the minimum SIP amount is twice the value of the highest-valued stock rounded up to the next 1000.
To maintain an optimal expense ratio, we suggest a minimum investment of Rs. 4–5 lakhs in our Smallcase. Click here to learn more about achieving the ideal expense ratio.
Q3. How should one deploy funds?
We recommend investing in a SIP (Systematic Investment Plan), as it enables accumulating cash gradually for lump-sum investments when needed.
Q4. What duration is optimal for investing?
At Niveshaay, our investment strategy is oriented towards the long term, with focus on sectors and industries poised for high growth in terms of revenue, earnings, and cash flow. This could be due to industry-wide healthy tailwinds or the turnaround of a particular company. Given the inherent volatility of markets, we always recommend keeping an investment horizon of 3–5 years to reap the maximum benefits.
Q5. How much return can we expect?
We advise investors to uphold long-term investments to maximize returns, particularly given the market’s volatility. It’s important to note that, in accordance with SEBI regulations, we refrain from making any commitments or assurances of guaranty or risk-free returns to investors.
Q6. How frequently does rebalancing happen?
Our dedicated research team consistently monitors the portfolio, tracking each company and its developments. We swiftly rebalance whenever there are significant shifts in fundamentals or market sentiment or when new company-specific opportunities arise. Furthermore, we typically rebalance after the quarterly results season. We'll keep you informed via email and WhatsApp whenever a rebalancing occurs.
Q7. How do I execute a rebalance?
Steps to apply rebalance
Please note:
Your smallcase will be rebalanced only when you confirm and place the order; it will not be done automatically.
Q8. Where can we find the rationale behind the rebalance?
We offer our research analysis in the rebalance rationale report.
Steps to find the rebalance rationale report:
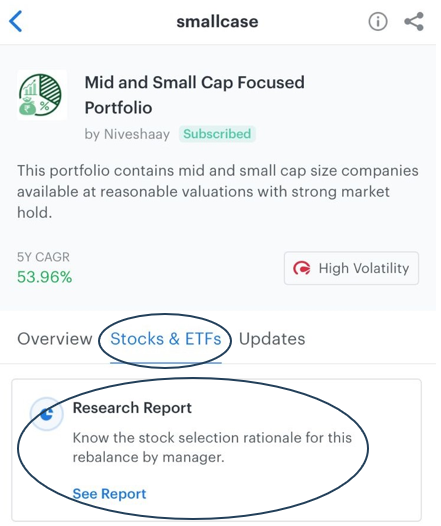
Q9. How should one respond when stocks reach the upper or lower circuits?
You might have noticed this error during rebalancing. This situation arises when stocks get stuck in circuits, either upper or lower, preventing buying or selling until they exit circuits. When stocks hit the upper circuit, it indicates a shortage of sellers, while hitting the lower circuit implies a shortage of buyers. This halts trading, potentially causing the rebalance order to not execute. In such cases, we request not to archive the order. Instead, once stock exits the circuit, we kindly request that you go to your Smallcase account and execute a 'REPAIR ORDER'.
If you mistakenly archived the order, you can reverse it by emailing support@smallcase.com. If you executed the order directly through your broker, please email support@smallcase.com and smallcase@niveshaay.com, providing the stock's name, price, quantity, and date of transaction from your registered email ID to facilitate order reconciliation.
Q10. How do I access the manager updates sent by Niveshaay?
To explore the manager update section, please navigate to the Smallcase application and follow these steps:
Q11. What are LiquidBees/Liquidcase ?
LiquidBees, an exchange-traded fund (ETF), functions as a cash equivalent within smallcase, a portfolio where full fund deployment is required. This strategy allows for maintaining liquidity, particularly during times when market valuations are high and holding cash enables quick liquidation as needed, facilitating taking positions in equities.
Q12. The stocks listed in my broker account differ from those in my Smallcase App.
This occurs when transactions are conducted directly through a broker account, resulting in discrepancies in holdings and returns. You can easily reconcile your holdings by simply dropping us a mail at support@smallcase.com and smallcase@niveshaay.com, providing the stock's name, price, quantity, and date of transaction from your registered email ID.
Q13. Where can we find the original composition of smallcase?
You can find the original composition by following these steps:
Q14. What are your charges above subscription fees?
We prioritize your trust and satisfaction and do not levy any extra charges beyond our subscription fees. However, it's essential to acknowledge that, apart from subscription fees, there are transaction charges imposed by smallcase, along with brokerage and STT, applicable each time you trade shares through your broker. Nevertheless, the primary expense remains the subscription fees, with these supplementary charges kept minimal on the platform to enhance your investment journey.
Q15. Can we add or remove stocks from Smallcase?
You have complete control over adding or removing stocks at any time.
Please Note: If you manage smallcase then it will deviate from the original idea, and we do not recommend doing the same. However, if you still wish to continue, you will continue to receive rebalance updates, and your SIP (if active) will also be updated accordingly.
Q16. What is an expense ratio, and how much should be the ideal expense ratio?
The expense ratio is the ratio of the subscription fee to your total investment value.
Expense Ratio = Annual Subscription Fee / Total Planned Investment by Year
For example, if the expense ratio is 20%, it means you're paying 20% of your total investment value as a subscription fee. That means you need to earn a minimum of 20% returns just to break even with your investment value.
It's advisable to keep your expense ratio minimal for any investment. We recommend aiming for an expense ratio between 2–3% for Niveshaay smallcase. Considering our subscription fees, we suggest investing a minimum amount of Rs. 4–5 lakhs to maintain the desired ratio.
Note: Subscription fees are a major expense, and all other expenses are very minimal compared to others.
Disclaimers and Disclosures
SEBI Registration No. :INH000017338, IN/AIF3/24-25/1571, IN/AIF2/24-25/1607 | BASL Membership ID: 6276
Investment in Securities Market are subject to market risks. Read all related documents carefully before investing. The securities quoted are for illustration only and are not recommendatory. Registration granted by SEBI, membership of a SEBI recognized supervisory body (if any) and certification from NISM in no way guarantee performance of the intermediary or provide any assurance of returns to investors.

Metals & Mining
Elecon Engineering Ltd.
Inside the report What led us to research on this industry? Understanding the product Why Gear Industry can do well? Competitive Scenario Niveshaay Scuttlebutt Analysis Elecon Engineering Ltd Key Risks Financials Conclusion Research Analyst - Gunjan Kabra (gunjankabra@niveshaay.com) What led us to research this industry? We did a top-down analysis at macro level and analyzed that Indian
Inside the report
Research Analyst - Gunjan Kabra (gunjankabra@niveshaay.com)
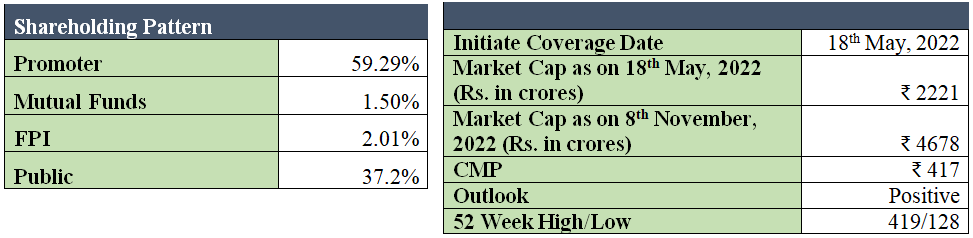
We did a top-down analysis at macro level and analyzed that Indian capex cycle can rebound. India’s capex cycle has been muted since last 10 years as private capex was flat. It was only the government capex that had supported infrastructure spending with 13% CAGR over FY10-20. What has changed now?
Government spending is the first to revive in any capex cycle. This gives confidence to private players to make expansion. Hence, we see an upsurge in capital expenditure. Order Flows for capital goods companies are growing. For instance, Thermax Limited is engaged in the business of manufacture and sale of boilers, heating and cooling equipment, industrial chemicals, and water and waste management equipment. The following table highlights the order book trend.

JSW Steel, for instance, plans to spend around ₹28,000 crore to expand steel-making capacity from 24.5 million tones (MT) to 36.5 MT by March 2024,
Tata Motors is investing ₹28,900 crore in subsidiary Jaguar Land Rover and hydrogen fuel cell vehicles in FY2022.
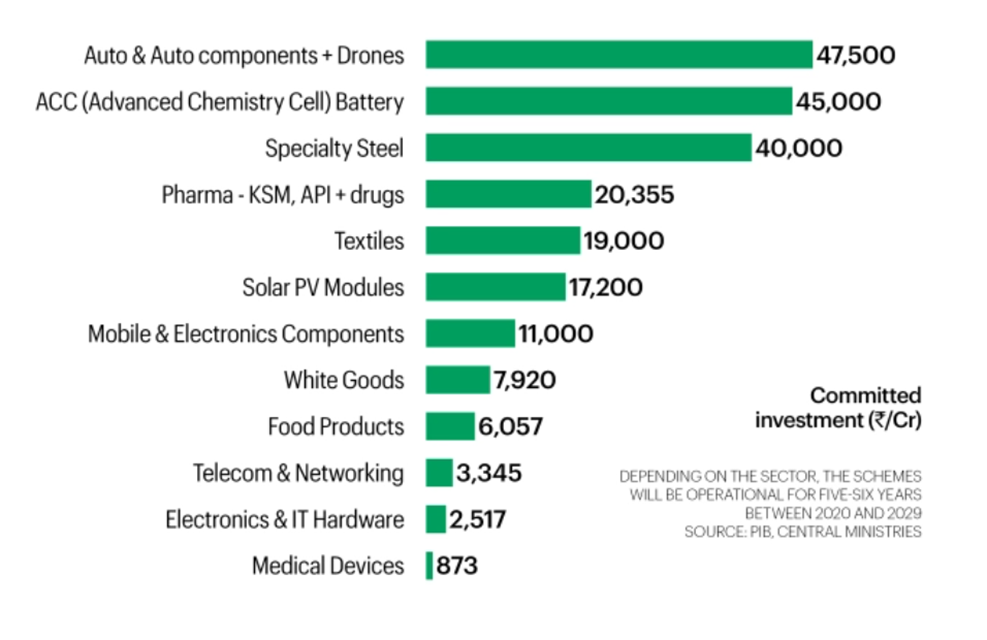
PLI Scheme will be a key driver of Private Sector Investments
Sticking to our investment style, we have chosen a company whose product is irreplaceable, plays a pivotal role in the capex cycle. Interestingly, the product looks simple and yet the industry is dominated by 2-3 players.
The sector is Gears/Gearbox industry.
An industrial gearbox is a system in which the mechanical energy is transferred from one device to another and is used to alter torque (force) and speed. It is used in conjunction with electric motor.
Types of Gear:
Classification of gears:
How is it used ?
Can the gears be manufactured interchangeably?
Industries Served:
Gears are used in automotive and industrial sector. Here, we’ll be discussing gears used in industrial space only.
Value Chain
Loose Gears >> Gearbox
Gearbox – Not all gear companies make gear box. It is essentially an assembly work.
Before, we go further and discuss Elecon in detail, wanted to highlight few things. In the previous two reports on RHI Magnesita and Usha Martin Ltd., we discussed whether the product is investment or a consumable to visualise the scope of growth.
As an investor, you and we at Niveshaay, would prefer consumable products. Repeat orders, short manufacturing cycle helps us to visualise scope of growth. Here, replacement cycle is very long. But as they say, always have a fresh perspective while investing to overcome previous biases. Ruling out a company should have proper reasoning. Visiting gears and grinding expo in Pune, some more dig down into the sector helped us to understand the industry composition and structure in great detail.
What made us consider this industry?
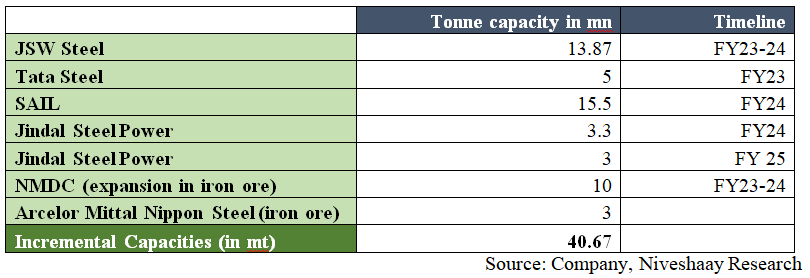
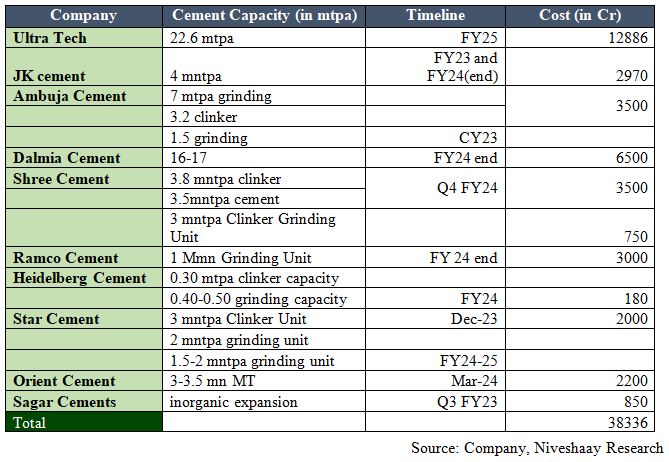
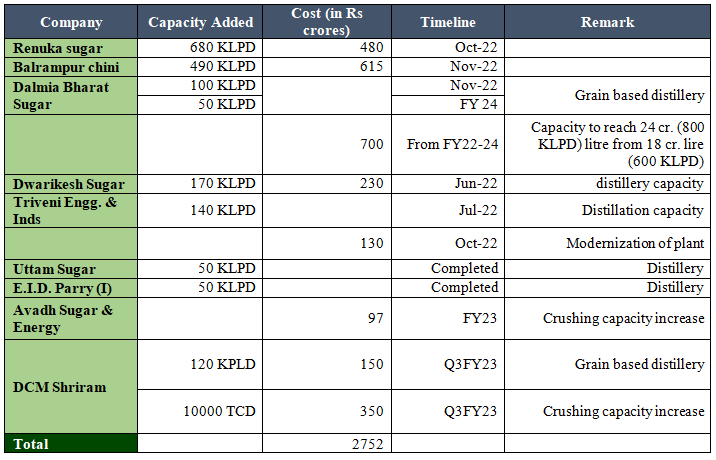
2. Healthy Order Book
They are witnessing healthy order book after a very long time as guided by the management.
3. Operating Leverage Play
Industry has been operating at low-capacity utilisation and both of these companies have doubled their capacities in the last decade. With any growth in the order book, company can easily ramp up their existing capacities.
4.Export Focus
Indian engineering components exports grew by 37% when compared to 2019 and grew to $ 111 billion in 2022, a rise of 50% from 2021 levels. Acceptance of any product increases when one gets an opportunity to try and experience new products. India just got that and few companies totally grabbed these favourable opportunities to provide to international as well as domestic clients. This is also happening in the case of gears business. Interestingly, Elecon’s management also highlighted in one of the conference calls that how with word of mouth and recommendations, exports for them are increasing.
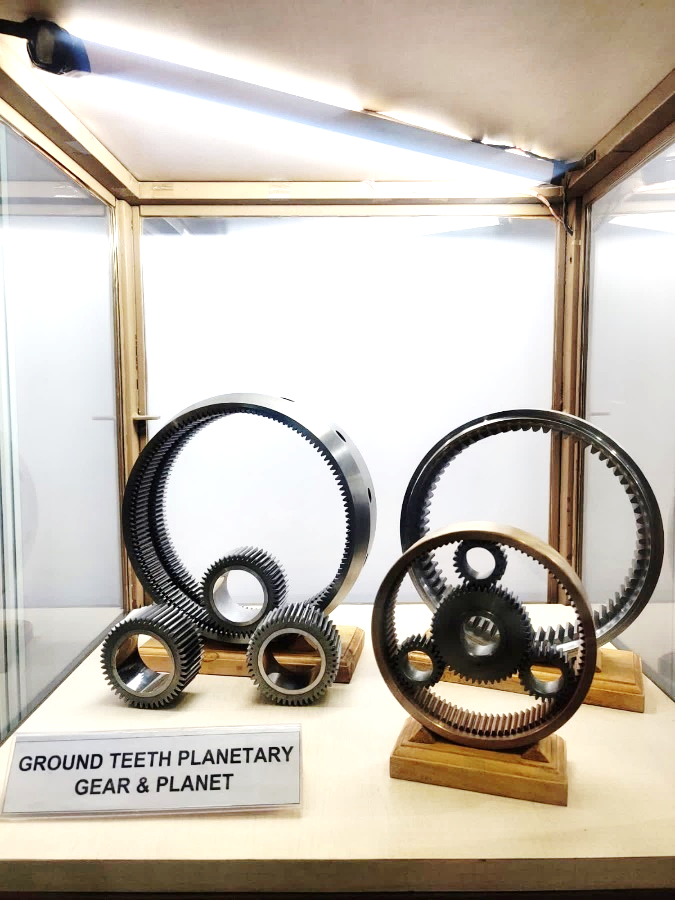
3. Worm Gears are little less efficient and priced lower when compared to Helical and Bevel Gears. Geared Motors work in a similar way.
4. Interacting with various exhibitors, got quite positive feedback of gears manufactured by Elecon Engineering and Shanthi Gears.
5. Also, got an idea about the orderbook visibility. Many companies exhibited there guided about good traction in orders and enquiries.
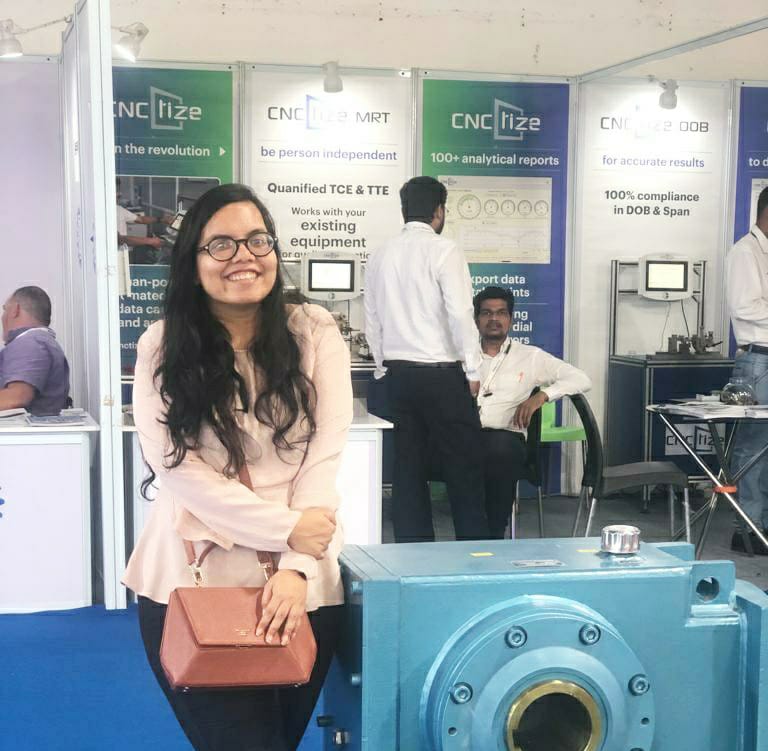
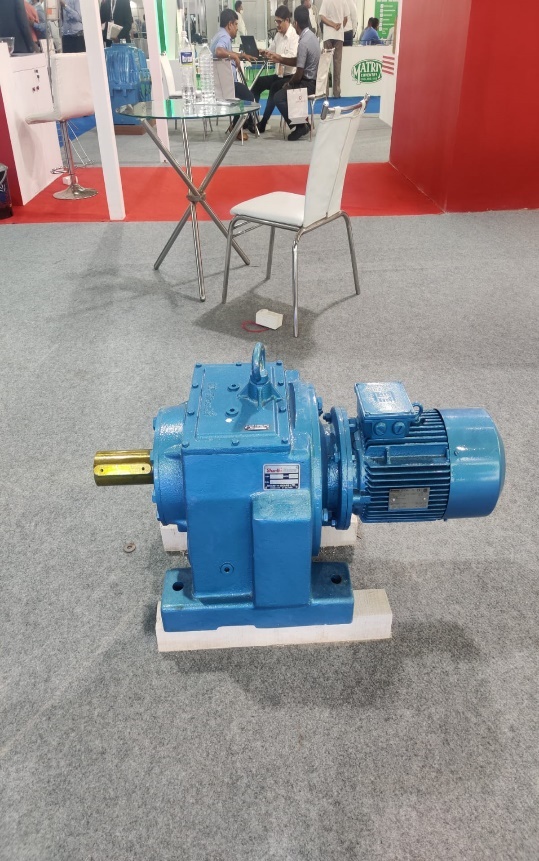
The company has strong presence in standard gears. Here, orders are placed from catalogues by customers.
The company is operating at 60% capacity utilisation and can easily ramp up the capacity. With higher utilisations, margins can also improve. During the last decade, company almost doubled its capacity. As utilisation of asset increases, fixed costs will go down. Hence, it can improve EBITDA margins.
As per the management guidelines, 20-25% is expected in FY23. Current order book stands at Rs. 605 crores in gears business and in MHE orders on hand are of Rs. 127 crores.

4. Restructuring done in MHE division, positive contribution this year onwards with improved margins Company has done away with their legacy business model (contracting). Here, expected EBITDA margins is around 15-20%.
Here, they’ve changed their strategy. Majority of the business is now, coming from after sales which is revamping or modernizing material handling plants as well as providing services and manufacturing spares and delivering to customers. These are profitable business and have healthy margins. These products have good payment terms unlike the previous model.
5.Focus on Exports
All the overseas entities have now turned profitable due to re-structuring initiatives. Interestingly, in one of the conference calls, they highlighted how acceptance of their products overseas happen when they use it once, finds out that the product is robust and reliable. This leads to repeat orders. This happened with the company in South America. With local reference, they tend to receive repeat orders. In export market, bargaining power is high. US markets prefer to buy from India and China. Europe markets prefer
local market products. Also, with lower metal prices, export products can command high margins too.
6. It aims to be net debt free by FY23.
7. It is a fantastic combination to play on a company when the following happens together:
All these points are expected to play on Elecon Engineering Ltd.
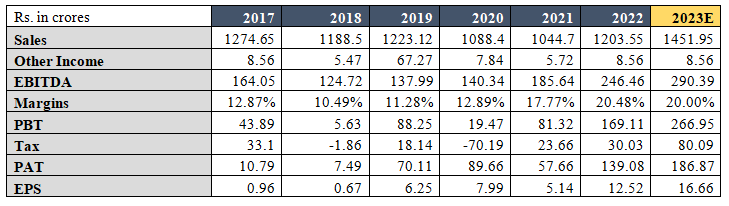
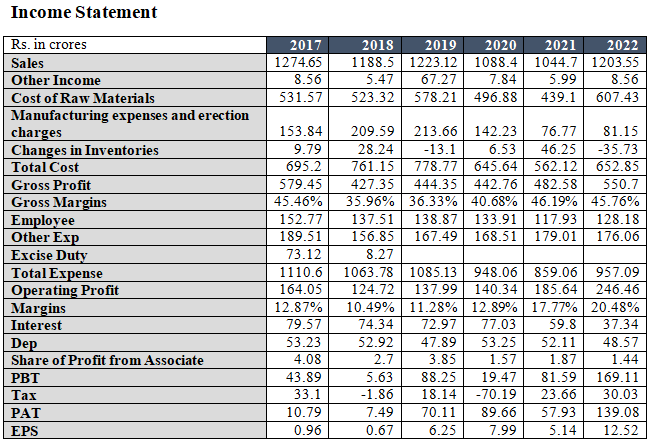

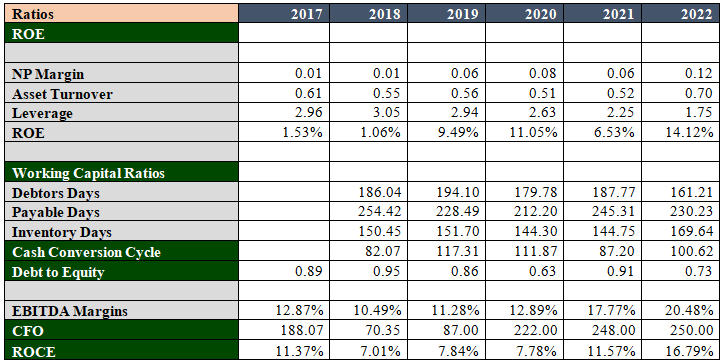
In the current scenario, we can classify Elecon Engineering Ltd. under a category where the company doesn’t require further investments to grow for a foreseeable future. Also, with revival in capex cycle expected, restructuring and operating leverage play, the company is expected to perform well in the coming quarters.
Niveshaay is a SEBI Registered (SEBI Registration No. INA000008552) Investment Advisory Firm. The research and reports express our opinions which we have based upon generally available public information, field research, inferences and deductions through are due diligence and analytical process. To the best our ability and belief, all information contained here is accurate and reliable, and has been obtained from public sources we believe to be accurate and reliable. We make no representation, express or implied, as to the accuracy, timeliness, or completeness of any such information or with regard to the results obtained from its use. This report does not represent an investment advice or a recommendation or a solicitation to buy any securities.
Disclaimers and Disclosures
SEBI Registration No. :INH000017338, IN/AIF3/24-25/1571, IN/AIF2/24-25/1607 | BASL Membership ID: 6276
Investment in Securities Market are subject to market risks. Read all related documents carefully before investing. The securities quoted are for illustration only and are not recommendatory. Registration granted by SEBI, membership of a SEBI recognized supervisory body (if any) and certification from NISM in no way guarantee performance of the intermediary or provide any assurance of returns to investors.

Metals & Mining
Rain Industries Limited – A play on the global aluminum demand
Watch the complete presentation on http://investingHub.in Rain Industries Limited is a play on the global aluminum demand. Rain Industries Limited (RAIN) is a leading vertically integrated producer of carbon, cement, and advanced materials products. The company owns and operates a total of 18 manufacturing facilities that manufacture products for its 3 business segments. These facilities are established across North
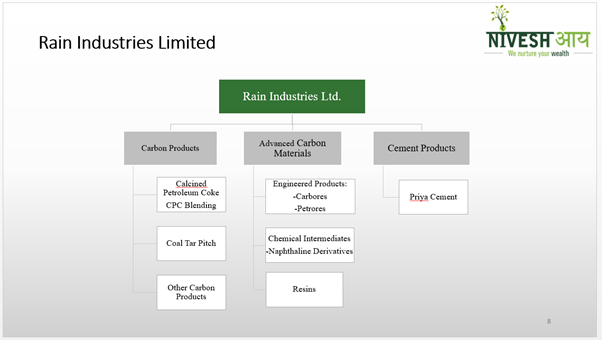
The sale of its product depends on the overall aluminium production. Aluminium, Construction, Carbon black & Graphite are the major contributors to the overall revenue of the company.
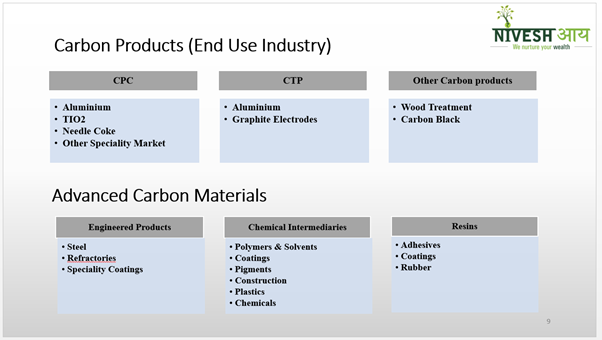
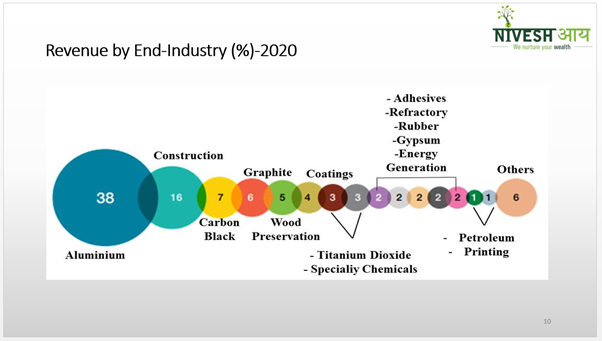
Near decade high aluminium prices – The aluminium LME prices are at high levels since the late 2018 implying higher capacity utilisation for aluminium smelters. The management also guided that ~4 million tonnes of new aluminium capacity is expected to come globally in 2021. Out of this, 3 million tonnes would come in China in the form of new capacities or re-start of idled capacities. This will increase the market opportunity for Rain Industries Ltd. as there would be less exports of CPC from China and CTP to Middle East and South Africa.
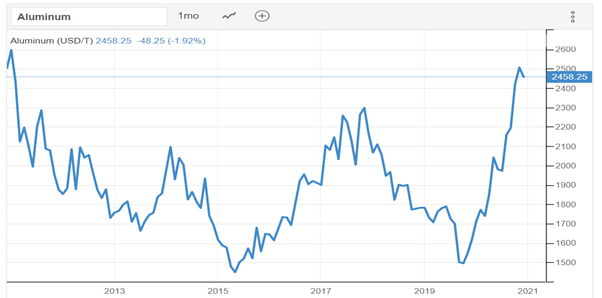
Aluminium Capacity Expansion in India – Coal India will set up specific-purpose vehicles (SPVs) for about Rs 38,000-crore the green-field aluminium project, and an about Rs 23,400-crore aluminium smelting unit with state-run National Aluminium Company Ltd (NALCO).
NALCO to invest Rs. 30,000 cr for expansion, diversification in the next 6-7 years – State-run aluminium maker Nalco will invest around Rs 30,000 crore by the financial year 2027-28 on various expansion and diversification plans. With the proposed expansion plans of both coal India and Nalco, the probability of receiving a favorable outcome from the government to Rain for the commencement of new vertical shaft calciner plant becomes higher.
Bullish CPC and CTP Price Trends in 2021 – The Company is witnessing a good demand in CPC and CTP segment. But, one needs to watch the GPC prices too. It wouldn’t be difficult to pass on the increase in price because of the higher LME aluminium prices due to shortage of scrap and primary aluminium in the global market.
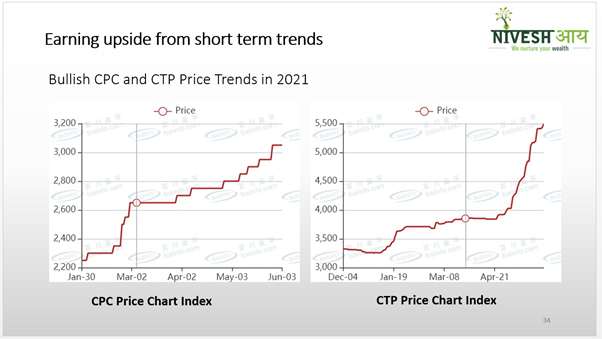
Earning upside from completion of Capex – Total Capex of $1 53( INR 1150 cr) million for Hydrogenated Hydro Carbon (HHCR) Resin, Vertical shaft & Anhydrous Carbon Pellets( ACP) Plant The EBIDTA contribution of these plants can reach $50 million on ramping up by end of 2022
Cost cutting measures
Closure of Netherland facility – The Company has closed operations of plant situated at Uithoorn, Netherlands. The division mainly catered to printing ink adhesives, which witnessed slower demand and exhibited eroding profitability.
On 31st Dec, 2020, the company sold two of its subsidiary for Rs. 637 crores. The funds would be utilised for repayment of debt resulting in Rs. 32 crores of interest savings per annum. The management has also guided that no new capex in line for some time, the focus would be on to reduce debt. They also guided on the reduction of overall interest rate from 5.5% to 4% in next one and half year.
Deleveraging – The company has high debt on its book. The management is guiding that no new capex in line for some time, the focus would be on debt reduction.
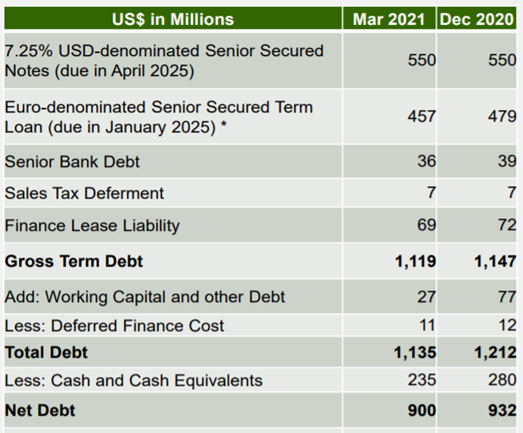
Cash profit upside in the next 2-3 years
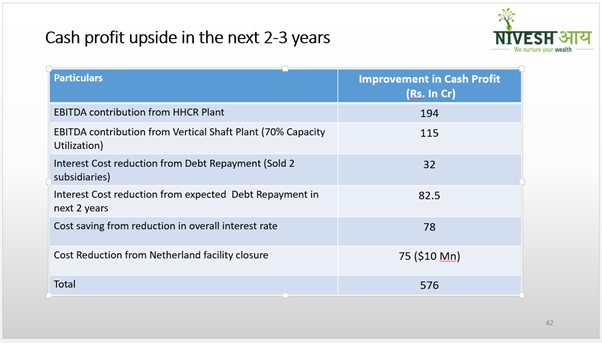
Expected free cash flow in next 2 years
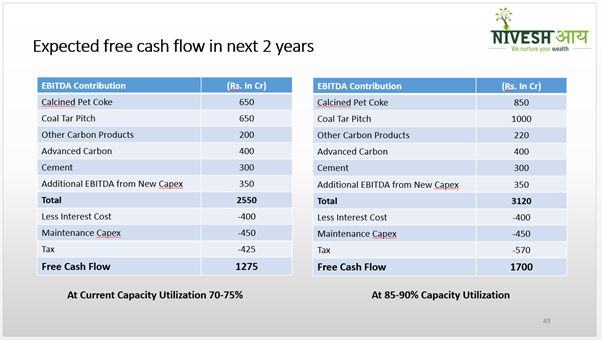
Watch our complete presentation on InvestingHub.
Use coupon code “Niveshaay” for a one-month free trial.
Disclaimers and Disclosures
SEBI Registration No. :INH000017338, IN/AIF3/24-25/1571, IN/AIF2/24-25/1607 | BASL Membership ID: 6276
Investment in Securities Market are subject to market risks. Read all related documents carefully before investing. The securities quoted are for illustration only and are not recommendatory. Registration granted by SEBI, membership of a SEBI recognized supervisory body (if any) and certification from NISM in no way guarantee performance of the intermediary or provide any assurance of returns to investors.

Electronic Manufacturing Services
RUSHIL DECOR LTD.
When promoters buy-back, it is a positive sign. But, when the competitor companies’ promoters take stake in the peer company that significantly boosts investor confidence as they are the most clued people to know about the industry prospects. This keenly watched attribute adds to the assurance factor for the investor. This scenario is being seen

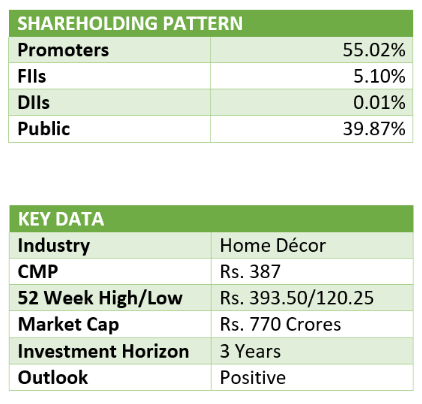
| Research Analyst: Ramswaroop Agarwal (rsa0308@gmail.com) & Kartik Mediratta (Kartikmediratta64@gmail.com) |
When promoters buy-back, it is a positive sign. But, when the competitor companies’ promoters take stake in the peer company that significantly boosts investor confidence as they are the most clued people to know about the industry prospects. This keenly watched attribute adds to the assurance factor for the investor. This scenario is being seen in the emerging MDF industry. The leading MDF players like Century Plyboards and Action Tessa have bought stake in Rushil Décor.
The strong conviction of industry leaders towards the growth of the MDF industry and their confidence in Rushil Décor is one of the many reasons why we think that this company can perform well in future. The report aims to discuss the industry and business model in great detail.
SHAREHOLDING OF PROMOTERS OF PEER GROUP (as on 30/09/2021)
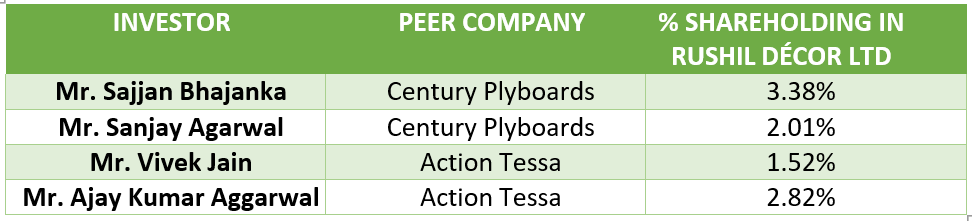
Note:
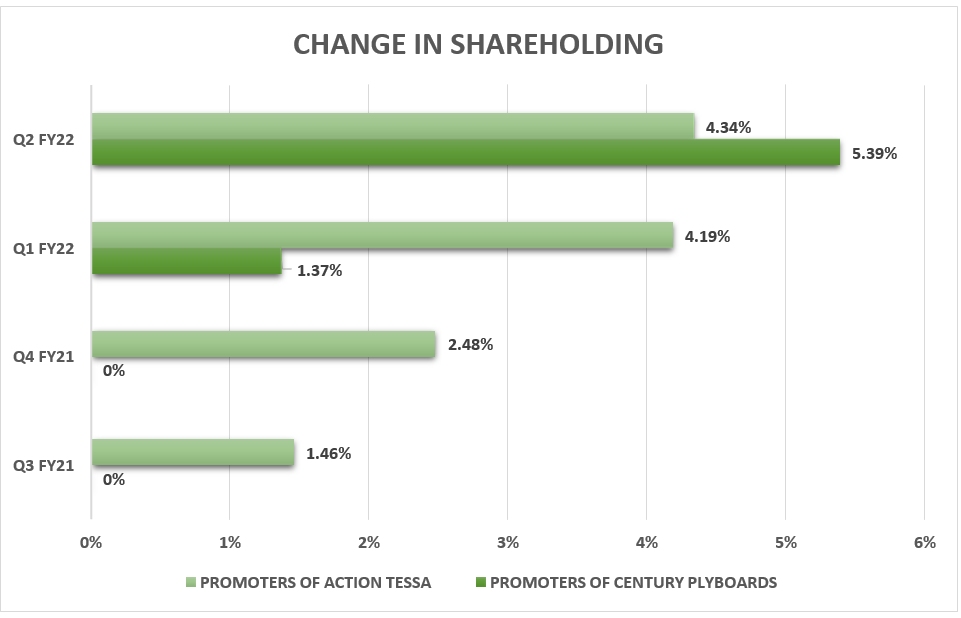
ABOUT COMPANY
Rushil Decor Ltd is the flagship company of the Rushil Group. Rushil Decor Ltd was incorporated on May 24 1993 as a private limited company with the name Rushil Decor Pvt Ltd. The Rushil product portfolio includes Laminates, Medium Density Fiber Boards (MDF), High-Density Fiber Boards Water Resistant (HDFWR), Pre- laminated Decorative MDF Boards and PVC Boards.
Rushil Décor Ltd. is one of the leading company in Laminate and MDF panel boards industry in India with a global foot print in and around 42 countries.
It has 6 manufacturing facilities across West and South India focusing on different product segments. The units are strategically located which assist in the smooth procurement of raw materials which is proved to be the significant factor in cost effectiveness.
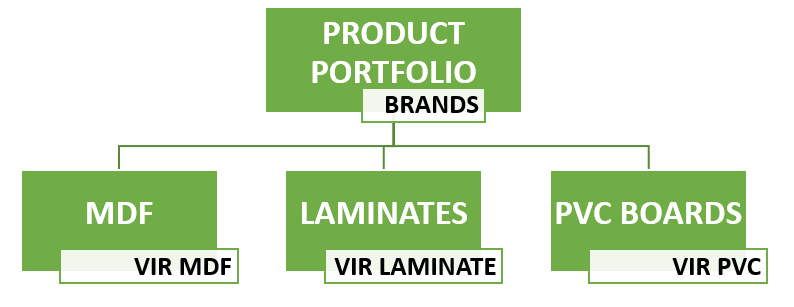
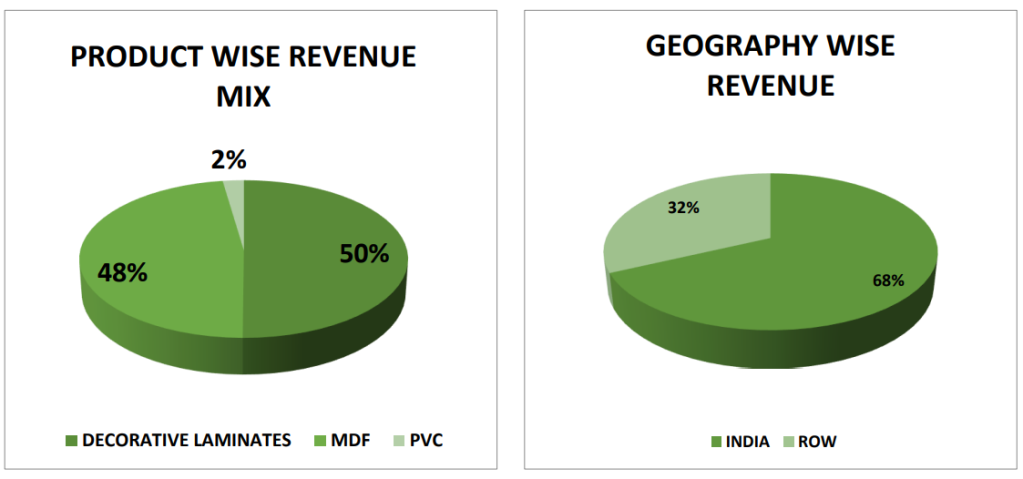
INVESTMENT RATIONALE
1. Rapid Pace of Urbanization: As a nation of 1.39 Billion people, India has demonstrated quicker recovery trends in demand as far as consumption of staple commodities, high-end necessities such as electronics, home furnishing as well as luxurious goods such as automobiles are concerned. Especially, the demand for home décor and electronics has been steadily climbing up, as people have been forced to remain within the confines of their homes due to the lockdowns and their swift adoption of the work-from-home trend. Rapid urbanization has also contributed to exponential growth in the real estate sector. It is estimated that there is a shortage of around 10 Million housing units in urban India. According to industry research, supply of additional 25 Million units by 2030 is required to meet the growing urban demand. This growth potential is expected to percolate to allied industries such as consumer goods and home décor industries.
2. Robust Demand and Entry Barriers: The MDF and PVC segments are fast growing owing to their inherent strengths and advantages. There is a huge opportunity in terms of market growth as well as import substitution. The MDF segment has high entry barriers especially in terms of required capex. Hence, there are a few unorganized players in the MDF segment and the industry is more than 90 percent organized.
3. Housing For All’ and Development of Smart Cities: Such programs will drive construction of large number of houses across India, leading to additional demand for furniture. It is estimated that India will receive investment of approx. $1.3 Trillion in housing sector over the period of next 7 years. Notably, the investment would lead to construction of new 60 Million houses.
4. Atmanirbhar Bharat: The Indian government’s commitment to encourage selfreliance is intended to develop Indian industry and reduce imports. In turn, we believe that this platform could deepen India’s industrialisation, strengthen incomes and widen the consumption play.
5. Urban Real Estate Growth: The Indian real estate growth has underperformed its retrospective average in recent years. However, the Work From Home phenomenon has increased the priority of buying into bigger and better homes, kickstarting sectorial growth from the second quarter of the last financial year, which is expected to increase the offtake of interior infrastructure products.
6. New Plant: Company has set up a new MDF manufacturing facility at Andhra Pradesh with capacity of 800 CBM per day. For this, company incurred a capex of approximately Rs. 450 crores. This will help Company to cater large set of customers which in turn will strengthen the market share of Company. The new plant is equipped with latest German technology which will consume 8-10% less raw materials thereby reducing the total cost of inputs and will lead to higher margins. According to industry experts, the Replacement Cost of Rushil Decor’s Andhra Pradesh plant is approximately Rs. 650 Crores.
7. IKEAZIZATION of Furniture Industry: IKEA is an internationally known furniture and home furnishings retailer. IKEA entered India in 2018 and is expanding since thereon. IKEA is sourcing 20% of its products which are made in India and the same is expected to reach 30% within 2-3 years. The furniture which they procure is made up of only MDF and particle boards, majorly MDF and the use of plywood is negligible. Due to more demand in MDF sector this would definitely unleash the inherent potential lying in the industry.
For a detailed understanding on Indian Furniture Industry & Indian MDF Industry, visit our blog:
Click hereMDF Production in India
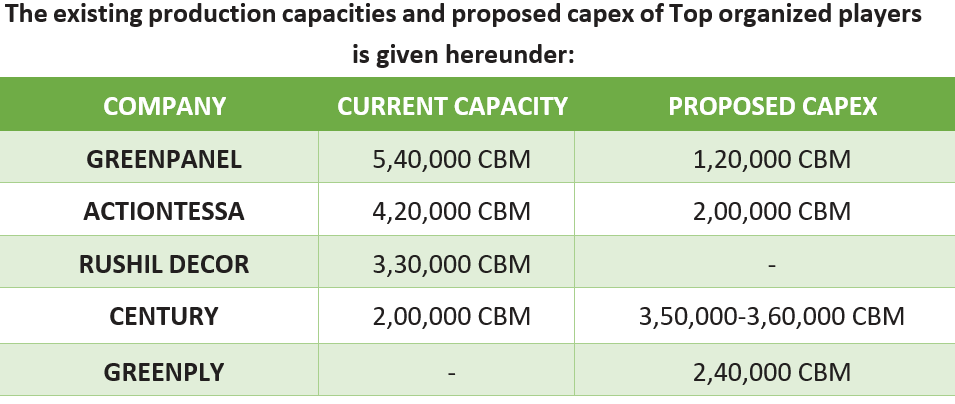
Due to sustained momentum in demand as well as prices, manufacturers are getting a clear revenue visibility, despite some price war in the market space. The capacity utilization in the industry has also gone up by 15% to 20% (i.e. 70-75% in 2021, which is expected to improve to 80-85% by 2025).
Industry experts believe that demand for MDF will match the increase in production capacity within the next couple of years. MDF’s market share will further bolster with the rising prices of Poplar Timber, a chief source of economy grade plywood in North India. It is expected to gain market share of Low & Medium grade plywood (which constitute 85% of the Plywood market in India).
MDF Segment of Rushil Décor Ltd.
Rushil décor is India’s third largest manufacturer of MDF. It has state-of-the-art manufacturing facility, one at Karnataka with total capacity of 300 CBM per day and another one at Andhra Pradesh with total capacity of 800 CBM per day. Thereby taking the total capacity to 1,100 CBM per day or 3,30,000 CBM annually. It incurred capex of Rs.450 crores for setting MDF manufacturing unit at Andhra Pradesh. The regular commercial operations were started from March’21. This plant will help Company increase market share and take care of incremental demand generated in Industry. The new plant is equipped with latest German technology which will consume 8-10% less raw materials and will play a key role in reducing total input costs therefore strengthening overall margins. Also, the company has vast network of 100+ distributors, 50+OEMs and 1000+ dealers.
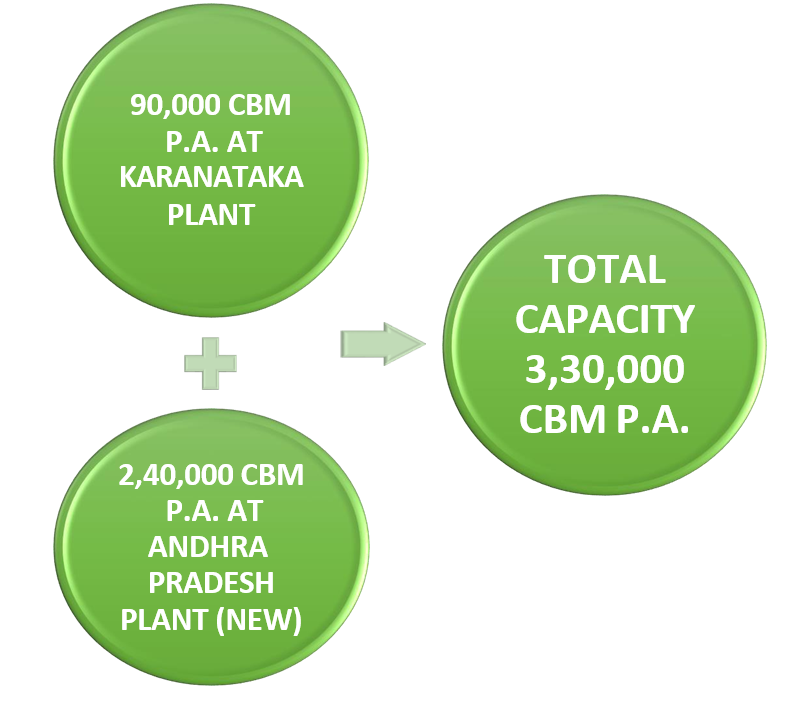
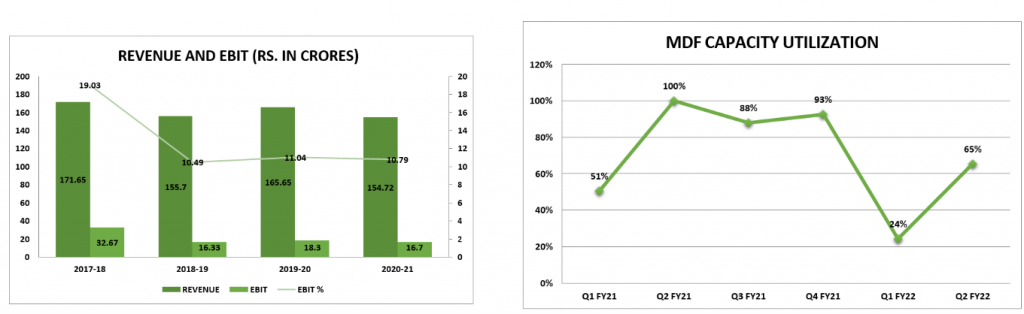
Note:Capacity Utilization has declined in Q1 FY22 as the new plant at Andhra Pradesh has commenced operations in March 2021 and is yet to achieve optimum capacity utilization. Management has guided an overall capacity utilization of 65% for FY22.
LAMINATES

Types of Laminate Sheets:

Applications of Laminate Sheets
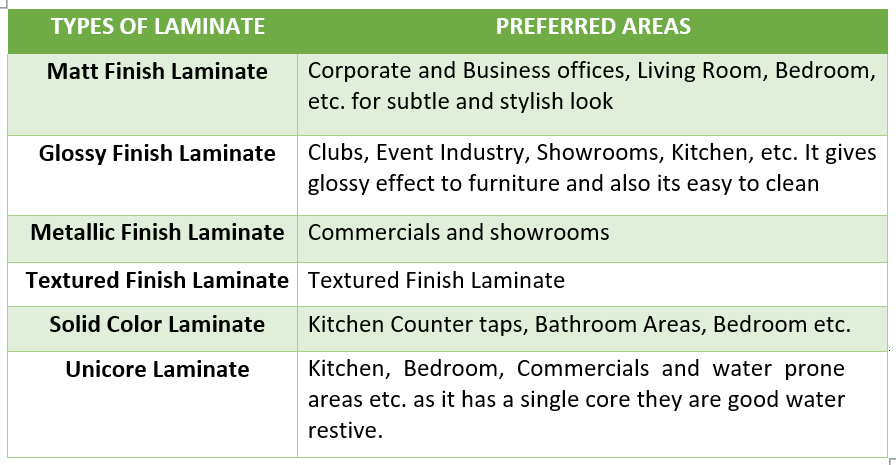
Laminates Industry
The global market size for decorative laminates is estimated to be worth USD 91,015.03 Million by 2025, registering a CAGR of 5.3%. On the global demand map for decorative laminates, China and India are leading from the front as their huge demand emanates from their enormous population base, growing urbanization and mass- scale construction activities in residential as well as commercial real estate sector. Consumption of Indian panel products has grown at CAGR of 15-20% for organized sector.
Indian Laminate market size is Rs. 5000 Crores. Major chunk of market is enjoyed by the unorganized sector due to low-capital intensive industry. Apart from voracious consumer demand, implementation of tax reforms such as GST is expected to aid the organized manufacturers capture a larger market share as against their unorganized counterparts.
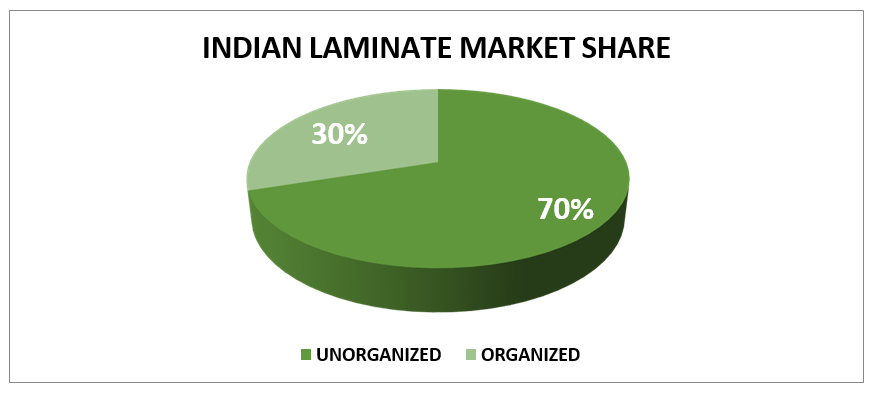
Production Capacities of Top Organized Players:

Laminates Segment of Rushil Décor Limited

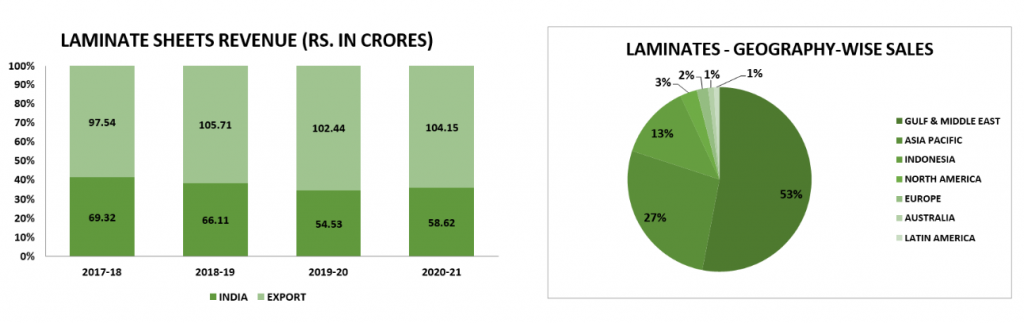
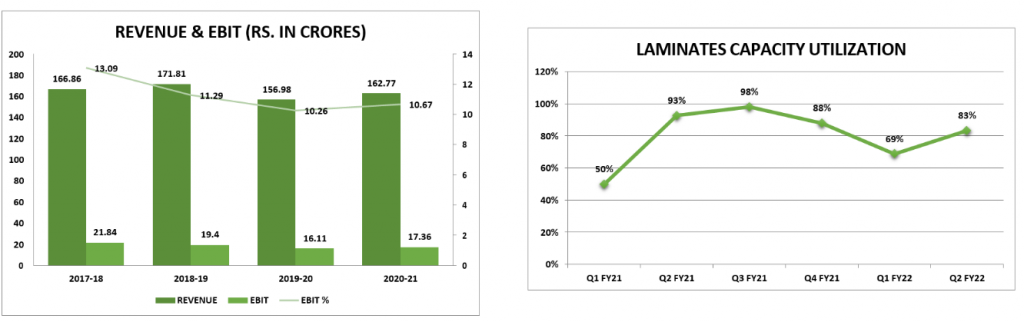
Note:Capacity Utilization is lower in Q1 FY21 and Q1 FY22 due to 1st and 2nd wave of Covid19 pandemic in Q1 FY21 & Q2 FY22 respectively.
POLYVINYL CHLORIDE (PVC)
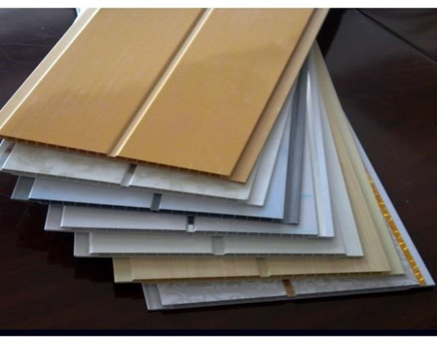
Uses of PVC Foam Sheets/PVC Foam Boards

Advantages of PVC Foam Boards
PVC Market in India
Though in fledging stage, the market for PVC boards in India is gradually expanding with the size of the market touching nearly Rs. 2000 Crores, before the pandemic of COVID-19 hit..
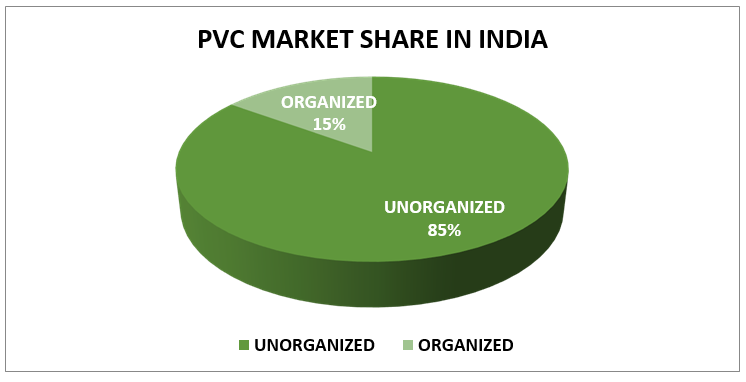
COMPANY FINANCIALS
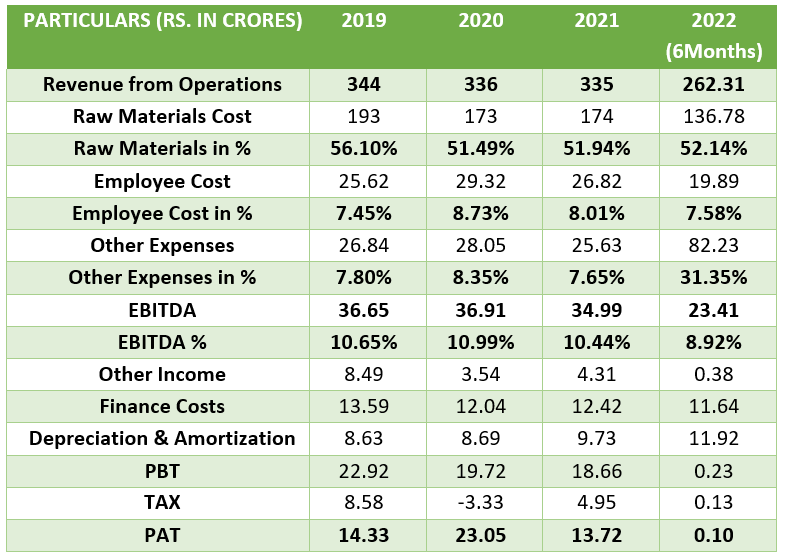
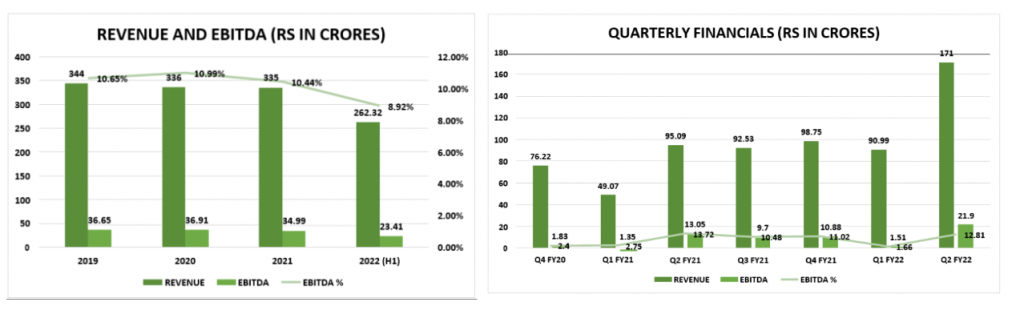
Notes:
Financial Ratios:
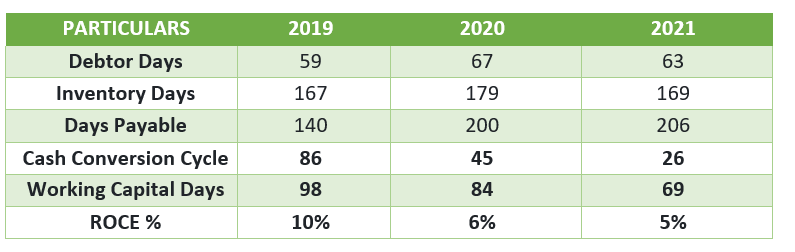
Debt Repayment Obligation:
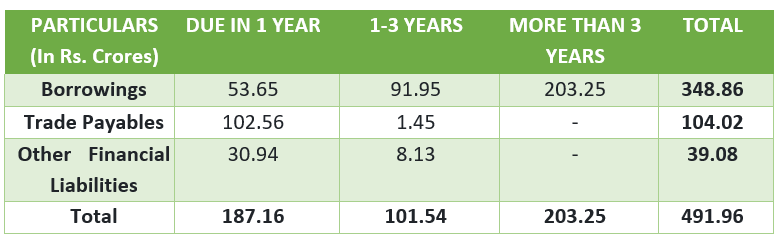
RUSHIL DECOR V/S NIFTY SMALLCAP 250:
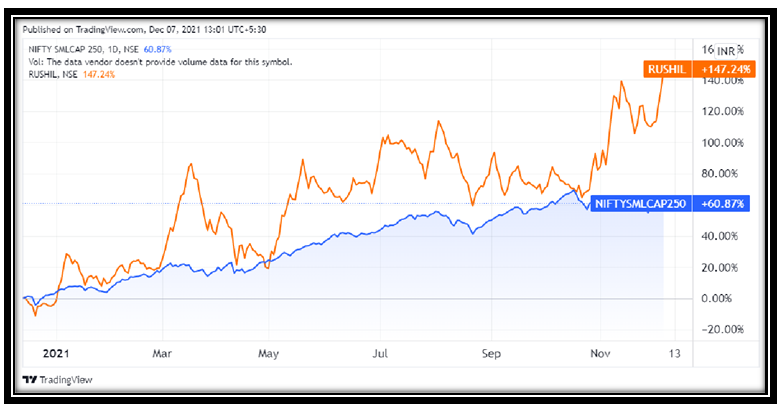
VALUATION
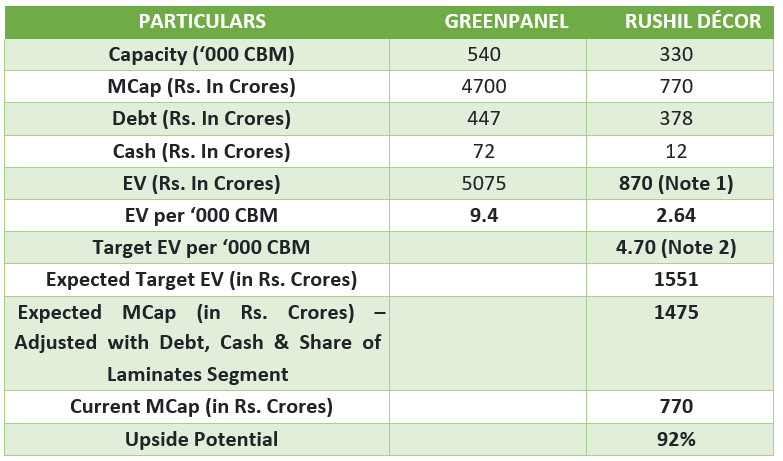
Notes:
* This should be the Fair Value based on current capacity of the company’s MDF segment. These values are subject to periodic revision based on improvement in capacity utilization of the new plant and the company’s ability to set up efficient dealer networks for its products thereby driving growth in revenue and EBITDA margins.
SCENARIO ANALYSIS
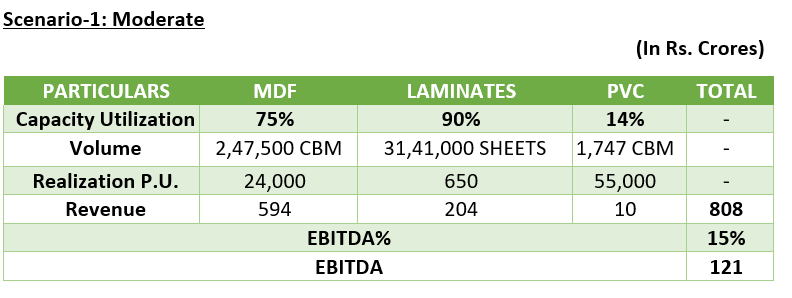
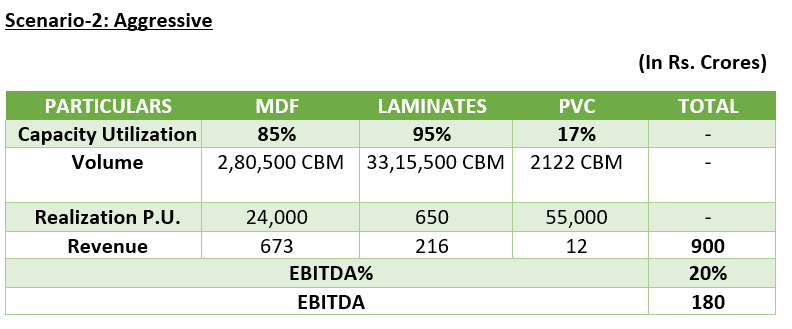
Notes:
RISKS AND THREATS
Outlook Interpretation
Positive – Expected Return of 12%+ on annualized basis in the long term
Neutral – Expected return in the range of +/- 12%
Negative – Expected return in negative
Disclaimer:
Niveshaay is a SEBI Registered (SEBI Registration No. INA000008552) Investment Advisory Firm. The research and reports express our opinions which we have based upon generally available public information, field research, inferences and deductions through are due diligence and analytical process. To the best our ability and belief, all information contained here is accurate and reliable, and has been obtained from public sources we believe to be accurate and reliable. We make no representation, express or implied, as to the accuracy, timeliness, or completeness of any such information or with regard to the results obtained from its use. This report does not represent an investment advice or a recommendation or a solicitation to buy any securities.
Disclaimers and Disclosures
SEBI Registration No. :INH000017338, IN/AIF3/24-25/1571, IN/AIF2/24-25/1607 | BASL Membership ID: 6276
Investment in Securities Market are subject to market risks. Read all related documents carefully before investing. The securities quoted are for illustration only and are not recommendatory. Registration granted by SEBI, membership of a SEBI recognized supervisory body (if any) and certification from NISM in no way guarantee performance of the intermediary or provide any assurance of returns to investors.
Recycling & Refurbishment
Indian Paper Industry – Tactical Play on JK Paper Ltd.
Inside the report Part I: Indian Paper Industry Recent Trends in Paper Industry JK Paper Why JK Paper? Part II: Indian Paper Industry Part III: How is it different from global industry? Indian Paper Companies: Classification based on Raw Materials Used Financials Research Analyst - Gunjan Kabra (info@gunjankabra.com) The Paper Industry is classified into four segments: Printing and
Inside the report
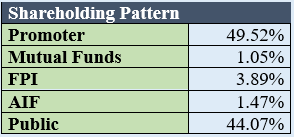
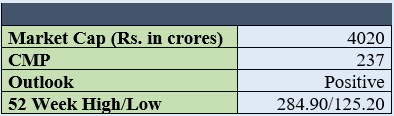
Research Analyst - Gunjan Kabra (info@gunjankabra.com)

The Paper Industry is classified into four segments:
Characteristics of the Indian Paper Industry
Paper can be produced by any of the following Raw Materials:
Raw Materials used in producing paper will help you in identifying which company to invest in based on the industry dynamics.

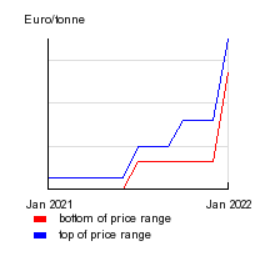
Against the background of an unprecedented rise in energy prices and other costs, paper producers have almost doubled prices for their products (fine paper grades) compared to January last year. Paper manufacturers explain that in some of their mill's production costs have risen by several hundred euro per tonne of paper.
UPM supplies Europe with about 40 percent of the backing sheets for labels.
How much paper and board does the EU export to and import from Russia and Ukraine?
Pulp and paper trade between the EU and Ukraine goes mainly one way: about 440,000 t of paper and board are imported by Ukraine from the EU. Ukraine's exports are very limited.
When it comes to Russia, around 900,000 t of paper and board are imported by Russia from the EU, while Russia exports close to 700,000 t to the EU (accounting for 50% of the Russian exports). Regarding pulp, EU-Russia trade is quite balanced with around 400,000 tonnes traded in total.
2. Rise in prices of Waste Paper/Kraft Paper, availability being an issue
3. Also, when the global wood prices are higher, Indian paper manufacturing companies tend to become competitive and are expected to perform well.
Under normal circumstances, Indian paper companies become globally competitive when the prices are beyond $650-700/tonne. The reason is discussed in detail in the later part of the report.
4. Paper Demand is back to normal with higher demand on the packaging side

Office paper demand is back to normalized levels. Also, with the opening of schools, the demand for paper is expected to resume to normalized levels.
Currently, the industry dynamics guide that wood-pulp-based paper manufacturers are expected to do well. Also, keep in mind that a vertically-integrated business model is a huge added advantage and should be given a preference.
Increased E-commerce penetration, anti-plastic sentiment, a recycled feature of the paper is leading to increased demand for paper.
5. Cost Pressure
The cost of production is increasing on all fronts, from raw material, chemicals to power and logistics.
Also, consider that the paper industry is a cyclical industry. We prefer sticking to a market leader who has been able to maintain its growth, margins and has already done capex.
6. Recent Price Trend
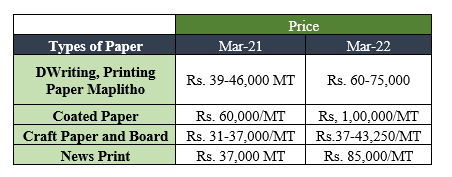
The buoyancy in the prices continues due to issues in raw material availability, rise in chemical prices, logistics prices. Mondi, a leading packaging company in Europe highlighted in its conference call on 3rd March 2022 that the prices are 20-25% higher than the average of 2021. The high-cost base remains amid favorable demand and tight supply scenarios.
With hike in prices by recycled paper manufacturers, Wood Pulp based manufacturers also took a hike even when their raw material prices remained stable.
Vertically-Integrated Business Model is a huge added advantage and should be given a preference. When wood pulp prices are higher globally, Indian companies tend to become competitive.
Hardwood: Domestic secured supply
Softwood: India is import dependent

About the Company
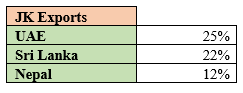

2. Capacity Expansion:
The company did an expansion by 170,000 TPA in the packaging board segment at Songadh, Gujarat to take advantage of this growing segment in the paper industry. The company also set up a pulp mill to cater to the new expansion.
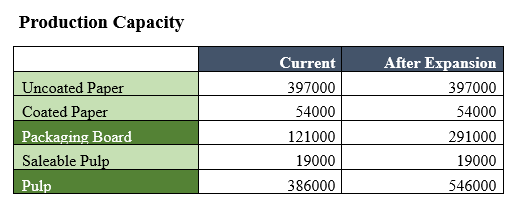
The packaging board was commissioned in Jan 2022. The plant is operating at 80% C.U. and is expected to reach 90% in the next 2-3 months. At peak capacity, it is expected around Rs. 1200-1600 crores of revenue ending on the price realization. 10-15% of the revenue from this plant is expected to be derived from exports.
Capex- Rs. 150 crores
Peak Revenue: Rs. 150-170 crores
Commencement: Q2 FY23
Revenue Target Guidance: ~Rs. 3500 crores in FY22
In Aug-2018, JK Paper had announced the acquisition of sick company Sirpur Paper Mills. It has an integrated paper and pulp mill with a capacity of 1,38,000 tonnes per annum. Currently, it is operating at 80% capacity utilization and is expected to reach 90% in Q1 FY23.
3. The company has been able to maintain sales growth and range-bound EBITDA margins

4. Rise in demand for packaging:
This segment can lead to a huge demand for paper boards. With fall in the price of waste paper and rise in the finished paper can lead to an increase in turnover and profitability for companies making Duplex Board. For example, Smruti Kappa and Mondi are the leading Packaging companies who got benefitted due to e-commerce growth, improving European Industrial production.
The growth in the paper industry is linked to the growth of the economy. More Industrial Production translates into more demand for packaging boxes.

Over years, Indian Paper Industry hasn’t been able to compete with the international players on account of the higher cost of production due to a deficit in wood pulp availability, not enough availability of waste paper, etc. According to IPMA, the cost of domestic wood in India was higher by almost $30-40 tonnes as compared to other Asian Countries. Due to this single factor, the cost of paper production in India used to be higher by $100 a tonne.
By FY2010, the paper industry was facing a supply deficit. Hence, the companies started expanding capacities. the industry saw significant capacity additions of 1.6 million MT during FY09 - FY11 (~15% of domestic paper capacity in FY09), particularly in the Printing and Writing Paper segment. This led to an over-supply scenario, build-up of inventories together with pricing pressures. Moreover, there was also an issue in sourcing wood pulp. There wasn’t enough availability of wood pulp domestically for the new capacities added. As a result, companies had to import higher expensive wood pulp. The companies were unable to pass on the higher prices to consumers and at the same time also faced stiff competition from cheap imports. Profits were severely impacted, especially for leveraged companies. After this, the industry along with government measures has taken steps to be self-sufficient in sourcing wood pulp locally.

Indian paper industry is highly fragmented: the top 3 players account for only 9% market share unlike 68% in USA, 72% in Indonesia and 21% in China. The Indian Paper Industry should also consolidate gradually

i.JK Paper (Writing, Printing and Packaging Board)

ii.West Coast Paper Ltd. (Writing, Printing and Packaging Board)

iii.Seshasayee Papers Ltd. (Writing & Printing Paper)

iv.Orient Paper & Industries Ltd. (Writing, Printing and Speciality Paper- Tissues & Chemicals)

v.Star Paper Mill Ltd. (Cultural Papers & Industrial Paper)

vi.ITC (Paper Board)

vii. Andhra Paper (Wood Pulp and Recycled Fibres: Writing and Printing Paper)

2. Waste Paper
i.South India Paper Mill (Paper Boards)

ii.Emami Paper Mills Ltd. (Newsprint, Printing & Writing Paper, Kraft Paper and Paper Board)

iii. N R Agarwal Industries Ltd. (Writing & Printing, Duplex Board)

iv.Astron Paper & Board Mill Ltd. ( Kraft Paper)

v. Shree Ajit Pulp and Paper Mill Ltd. ( Kraft Paper)

vi.Genus Paper & Boards Ltd. (Kraft Paper)

3.Agri Residue
i.Tamil Nadu Newsprint & Paper Ltd. (Paper & Paper Board)

ii.Ruchira Papers Ltd. (Kraft Paper & Writing & Printing Paper)

iii.Kuantum Papers Ltd. (Writing & Printing Paper)

iv.Yash Pakka (Speciality Packaging Products)


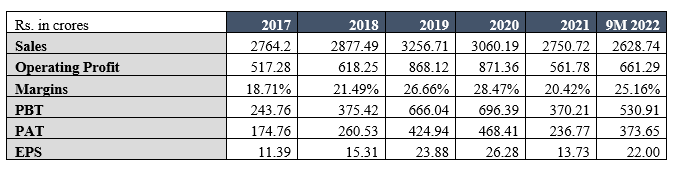


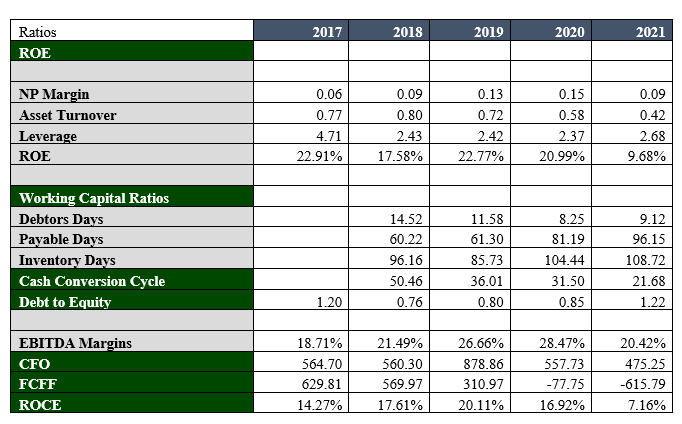
Please find the attached link for pdf file
Niveshaay JK Paper Research Report
Outlook Interpretation
Disclaimer: Niveshaay is a SEBI Registered (SEBI Registration No. INA000008552) Investment Advisory Firm. The research and reports express our opinions which we have based upon generally available public information, field research, inferences and deductions through are due diligence and analytical process. To the best our ability and belief, all information contained here is accurate and reliable, and has been obtained from public sources we believe to be accurate and reliable. We make no representation, express or implied, as to the accuracy, timeliness, or completeness of any such information or with regard to the results obtained from its use. This report does not represent an investment advice or a recommendation or a solicitation to buy any securities.
Disclaimers and Disclosures
SEBI Registration No. :INH000017338, IN/AIF3/24-25/1571, IN/AIF2/24-25/1607 | BASL Membership ID: 6276
Investment in Securities Market are subject to market risks. Read all related documents carefully before investing. The securities quoted are for illustration only and are not recommendatory. Registration granted by SEBI, membership of a SEBI recognized supervisory body (if any) and certification from NISM in no way guarantee performance of the intermediary or provide any assurance of returns to investors.

Metals & Mining
RHI MAGNESITA INDIA LTD.
Indian Refractory Industry Inside the report What led us to research this industry? Understanding the Product: Refractories Understanding the Refractory Industry in detail Explaining, why this industry can do well, going forward RHI Magnesita India Ltd. Research Analyst - Gunjan Kabra (info@gunjankabra.com)

What led us to research this industry?
We did a top-down analysis at macro level and analyzed that Indian capex cycle can rebound. India’s capex cycle has been muted since last 10 years as private capex was flat. It was only the government capex that had supported infrastructure spending with 13% CAGR over FY10-20. What has changed now?
Government spending is the first to revive in any capex cycle. This gives confidence to private players to make expansion. Hence, we see an upsurge in capital expenditure. Order Flows for capital goods companies are growing.
For instance, Thermax Limited is engaged in the business of manufacture and sale of boilers, heating and cooling equipment, industrial chemicals, and water and waste management equipment. The following table highlights the order book trend.

JSW Steel, for instance, plans to spend around ₹28,000 crore to expand steel-making capacity from 24.5 million tonnes (MT) to 36.5 MT by March 2024,
Tata Motors is investing ₹28,900 crore in subsidiary Jaguar Land Rover and hydrogen fuel cell vehicles in FY2022.
PLI Scheme will be a key driver of Private Sector Investments
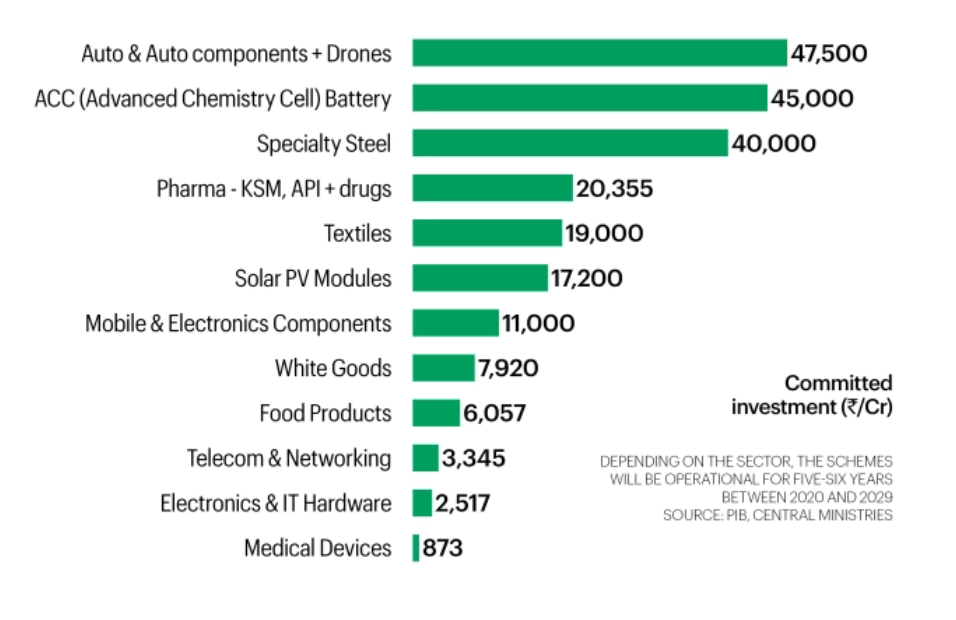
With rise in these infrastructure/construction activities, capacity utilisation of steel will increase. The share of building and infrastructure construction in overall steel consumption is 60-65%.
Staying true to our investment style, we have chosen a company whose product is irreplaceable, plays a pivotal role in the capex cycle, indirect play on the steel sector. This sector is less volatile when compared to steel with limited downside. The sector isRefractory Industry.
Understanding the Product: Refractories
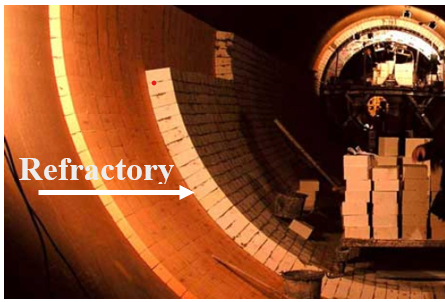
This point is explained in detail in the next points.
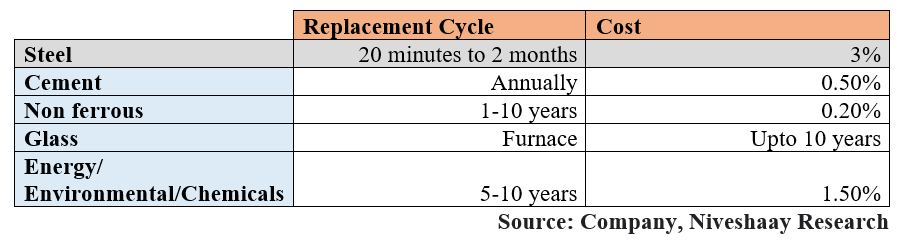
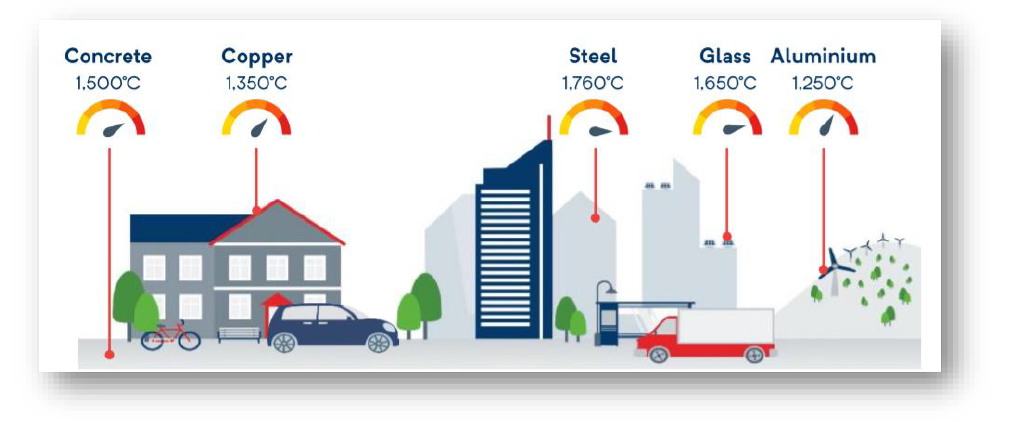
End-user Industry
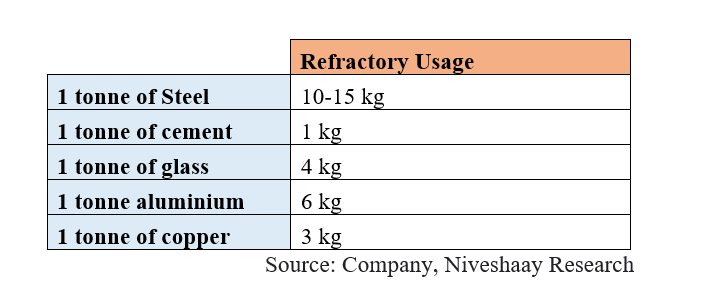
2. Types of Refractories
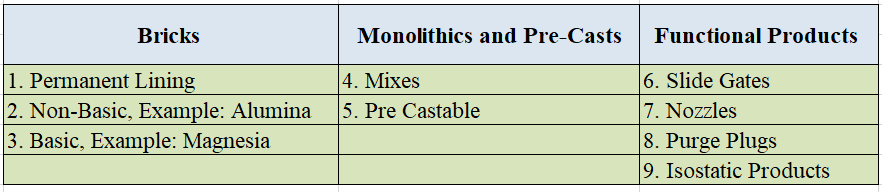
Functional/Special Refractories
This classification of refractories will help you to understand where is it used in the steel industry and also the margins vary of each product profile. This will also enable you to differentiate the product mix of refractory companies.
The focus is on iron and steel industry because the major demand and recurring demand comes from this sector.
3. Where is it used in steel industry?

In order to understand where refractories are used, it is important to understand the manufacturing process of steel. Here, I’ll be discussing the process in a broad sense to understand, how and where refractories are used while making steel.
Globally, steel products have been mainly manufactured via primary steelmaking process that constitutes two major routes. These are:
Blast Oxygen Furnace (BOF)
It is a large integrated steel making facility where primary steel is produced. It is useful in making bulk quantity and good quality. These plants are large in capacity ranging from 1to 5 million tonnes per year are spread in large areas. They can take advantage of economies of scale.
Major Raw Materials: Iron Ore (80-90%), Coking Coal
Other Materials: Limestone, Scrap Steel (10-20%)
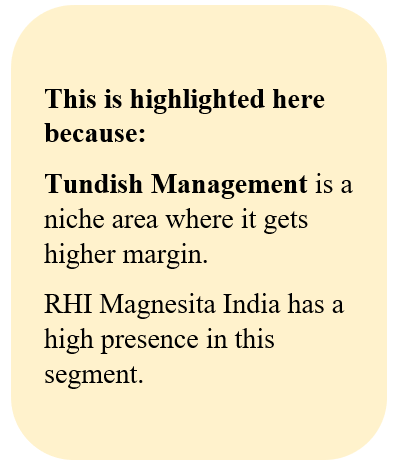
Electric Arc Furnace (EAF)
EAF have a much simpler input process.
Major Raw Materials:
EAF (Electric Arc Furnace) use electric arc with high power to generate the required heat to melt the steel scrap of recycled and transform into the desired composition of steel. The steel-making process on EAF is not dependent on the BF production since the actual input is scrap steel and certain quantity of pig iron and graphite electrodes.
The steel produced from the BOF and EAF is again refined to get the required chemical composition; these are secondary refining processes of steel making. Step iii. & iv. mentioned in the BOF section is same in both.
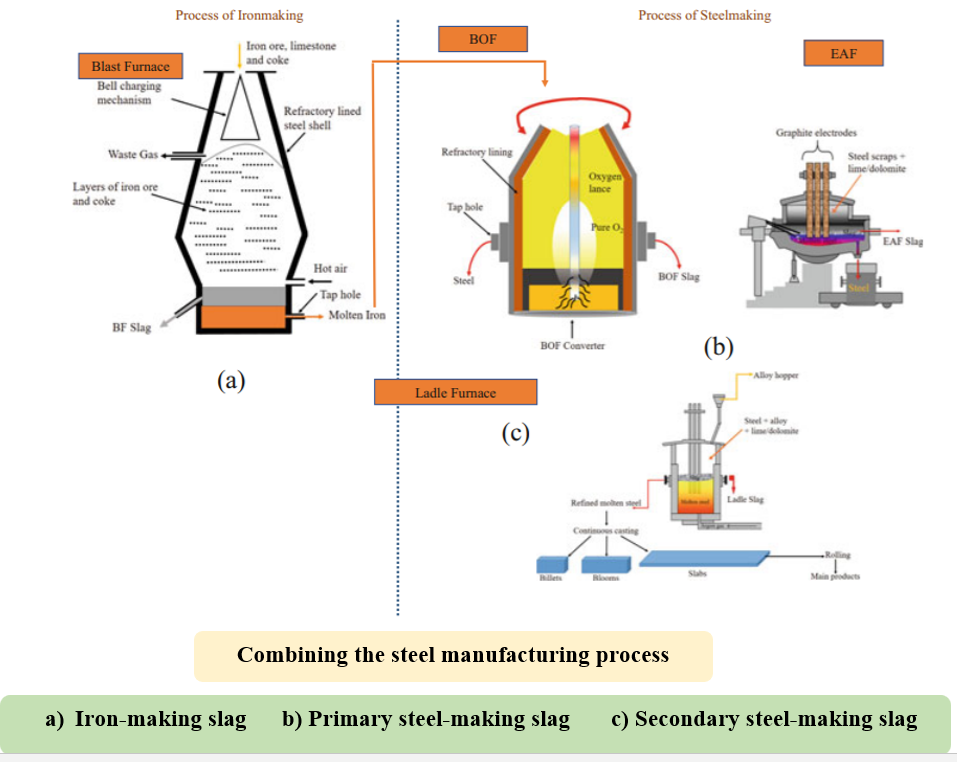
Refractory Application for Steel Ladle
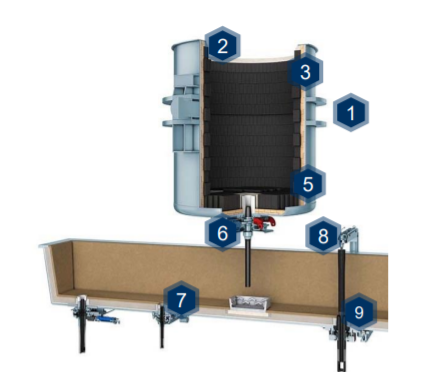
The numbers in the picture refers to the numbers mentioned in the above types of refractories table.
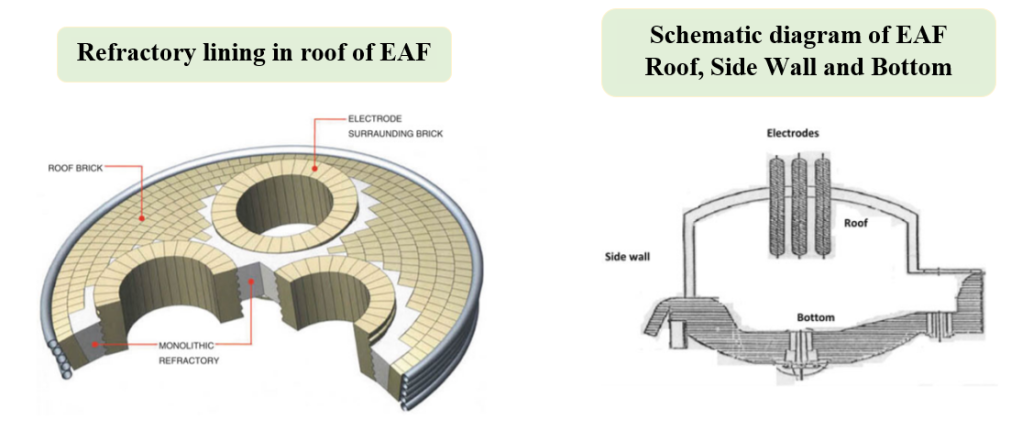

4. Raw Materials Used
Principle raw materials used in the production of refractories are:
Understanding the Refractory Industry in detail
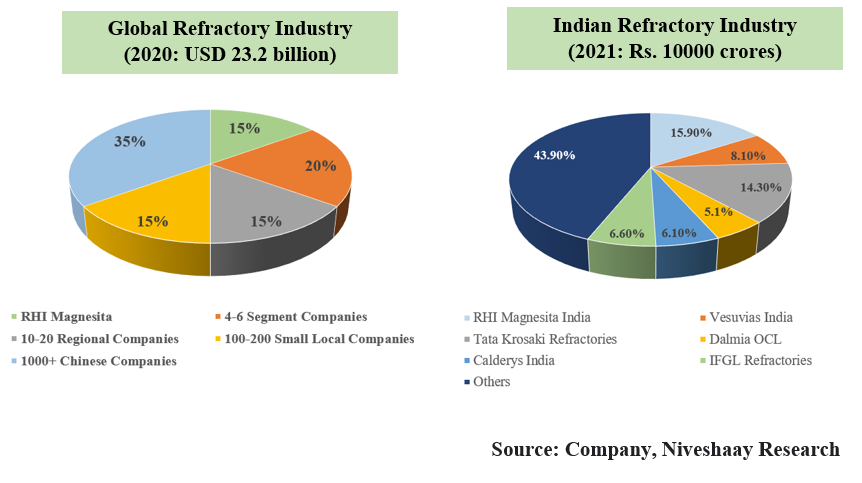
In last 6 years, IFGL Refractories have gained market share by 0.8%. While Vesuvius India and Tata Krosaki Refractories have lost market share by 3% and 5.3% The share of RHI Magnesita India remained same. 70% of the refractories consumed in India are locally produced and 30% are import dependent. Out of which 2/3rd is imported from China.
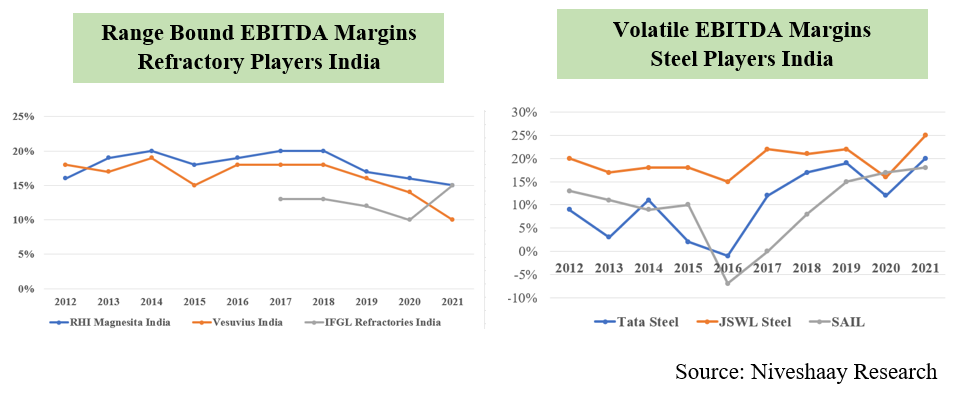

Notes:
Overall, we can say that refractory business is an indirect play on steel industry and capex cycle with less volatility.
2. Supply Side Dynamics: Understanding the Raw Material Industry
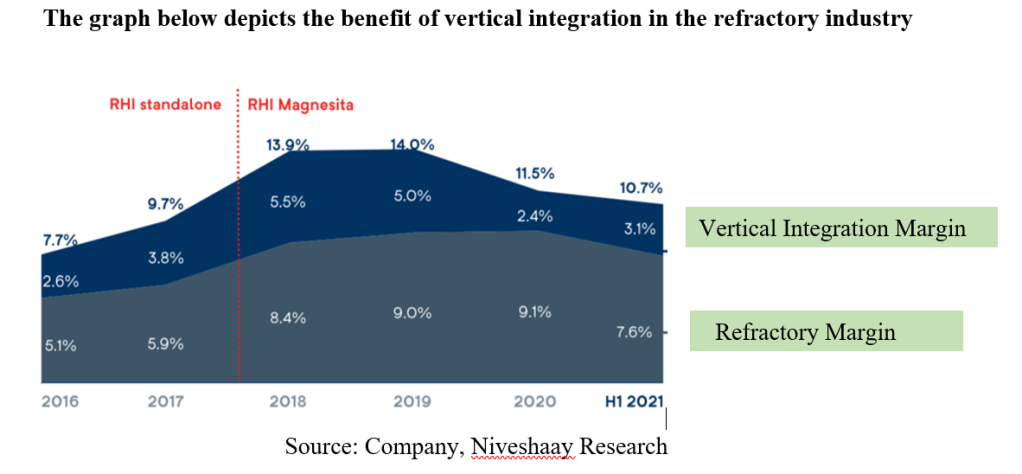
Explaining why this industry can do well, going forward
2. The industry is moving towards full line contracts under Total Refractory Management (TRM) services or complete business solution model. Steel companies prefer this model. Here, the company provide a broad range of tailored services at customer sites such as refractory installation, recycling, digital and supply chain services. These drive process efficiencies, reduce costs and generate sustainable benefits, thereby creating value for customers as well as for the companies.
RHI Magnesita, the parent company is now providing this service in India too through RHI Magnesita India. Vesuvius India and TRL are other players who provide this service.
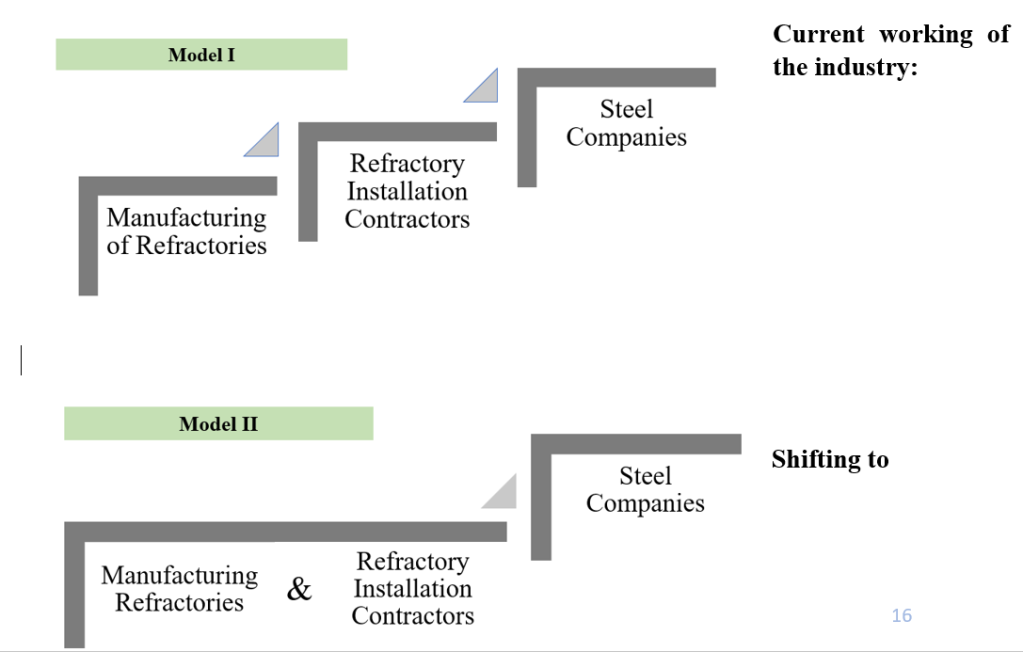
This is a big change and how will this benefit?
Refractories installation is technical. Attention to detail is crucial for a proper refractory installation. For instance, how much water needs to be mixed, temperature control while installation, adequate storage, drying out process. If the installation isn’t correct, the refractory lining will crack and weaken quickly resulting in risks to workers and refractory projects. Steel Companies would need a skilled refractory installation contractor for proper refractory installation.
Every refractory project is unique and needs customisation.
Model II: Dual benefits to Steel and Refractory companies:
Globally, refractory companies only provide complete installation to steel companies. RHI Magnesita India is trying to bring the same model to India. It would be easier for companies who has a complete basket of refractories to provide such services.
Why Refractory Maintenance Practice is important?
Refractory maintenance practice is important to maintain availability and extend campaign life. Materials for maintenance are very important as the volume of the maintenance materials consumed over a campaign may be up to two times the volume of original brick. Maintenance helps to balance the wear of refractory lining due to excessive wear in an area of repair whether the damage done mechanically or chemically
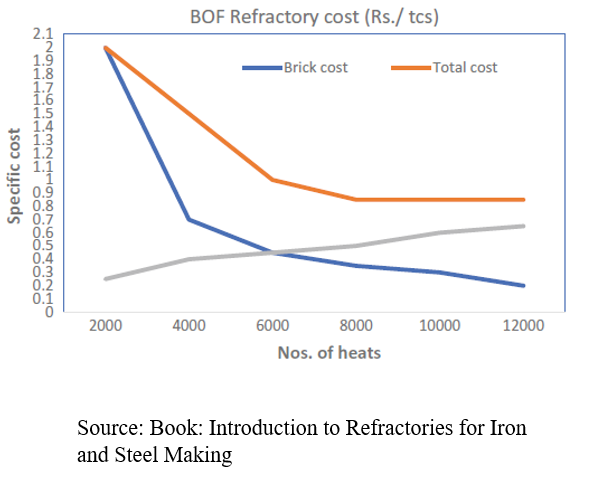
A typical cost curve is shown in the figure. The brick cost shows the cost of lining if the maintenance is not considered. Total cost is increasing from brick cost when the vessel is becoming old. There is a possible end of campaign in the absence of maintenance at a life of 4000 heats.
The life is extended to 12,000 heats by maintenance.
3. Steel Production is expected to remain high on account of:
RHI Magnesita India Ltd.
2. Installed Capacity and Planned Expansion
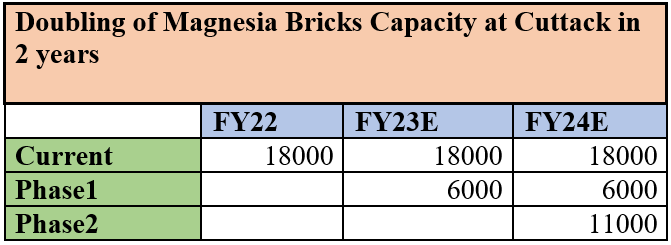

3. About the Company
RHI Magnesita India Ltd. has been incorporated in 2021 with merger of three RHI entities
In 2013, ORL was acquired by RHI, Austria. Prior to this Rajgarhia family owned and managed the company. Post the acquisition, ORL was able to improve efficiency and quality and take advantage of the strong network globally. In 2021, the company got merged with other unlisted entities in India.
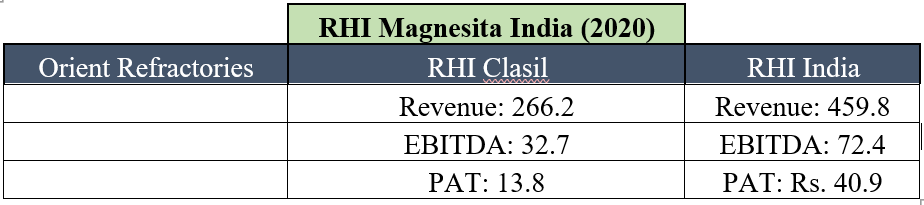
Geography Wise Revenues: India- 75% Exports- 25% The company plans to increase export share to around 30-35% in 2-3 years.
4. Key Risks
5. Management Quality
6. Competitive Scenario
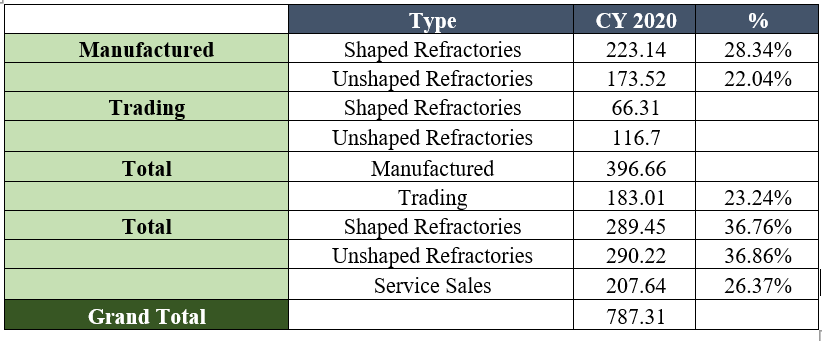

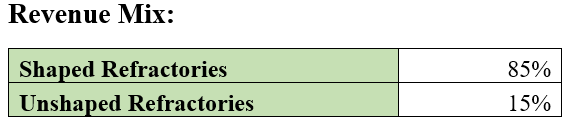
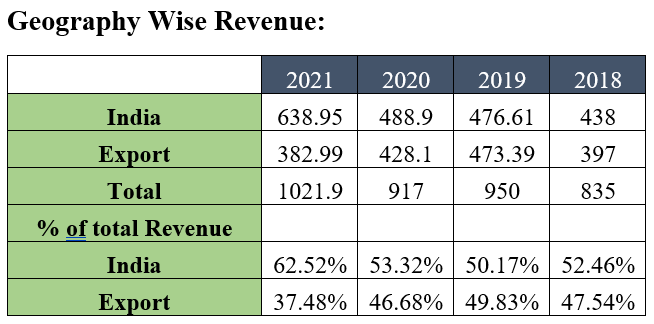
Why RHI Magnesita India over IFGL?
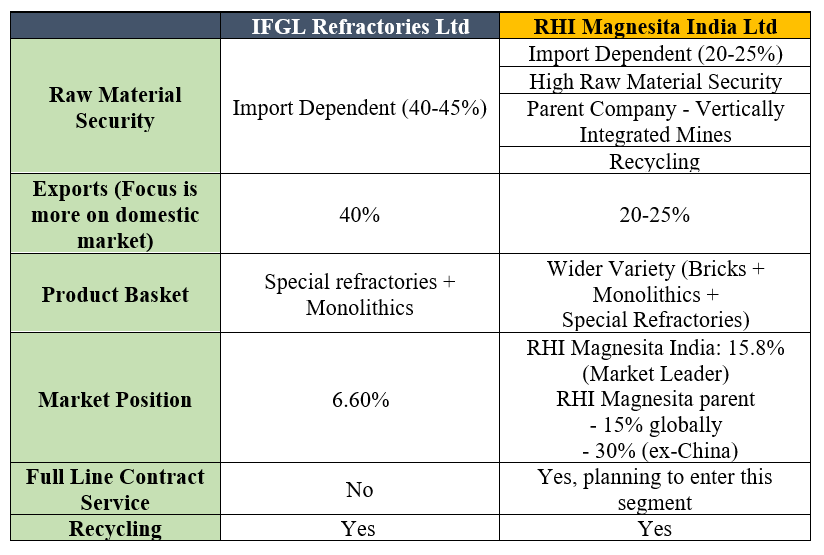

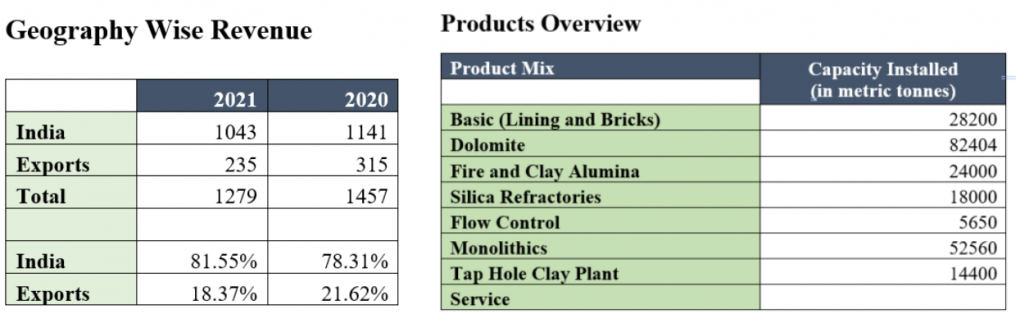
The product mix is good, focus is on domestic market with a large market presence in stainless steel market. But the same is not reflected in EBITDA Margins and the company has been losing market share since 2015.
RHI Magnesita India has a strong presence in Special Refractories.



RHI Magnesita India Ltd.– Financials
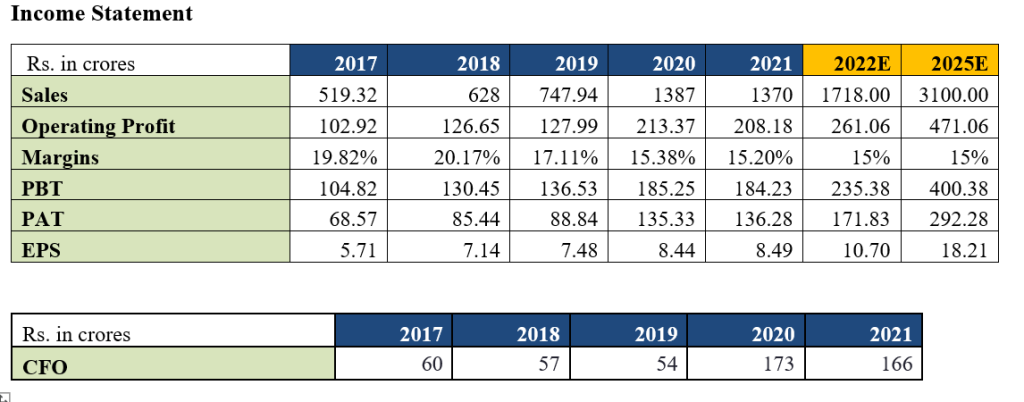
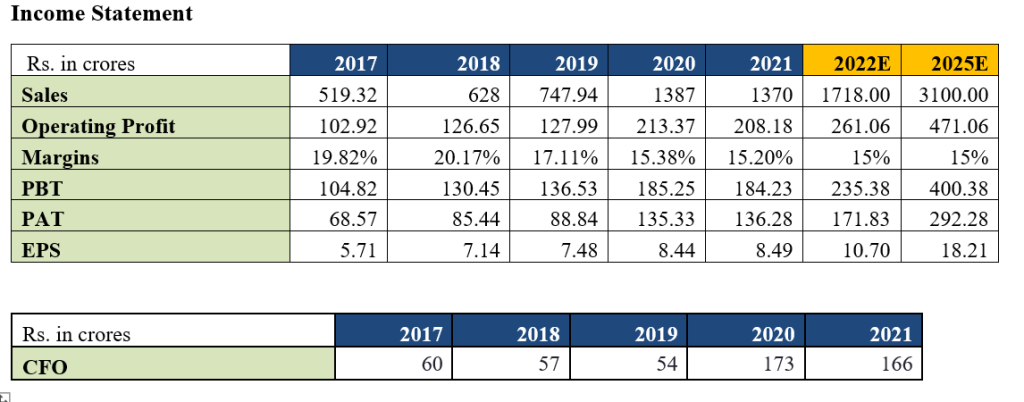
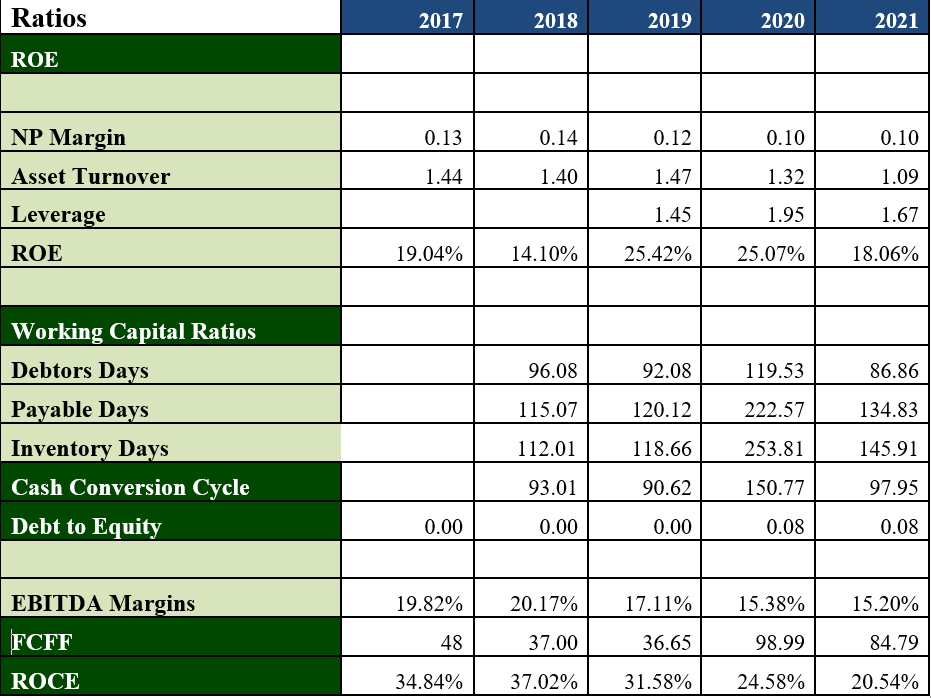
RHI Clasil Ltd: Financials

RHI India Pvt. Ltd. : Financials
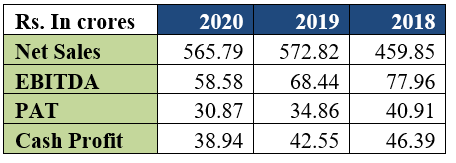
Outlook Interpretation –
Positive – Expected Return of 12%+ on annualized basis in the long term
Neutral – Expected return in the range of +/- 12%
Negative – Expected return in negative
Disclaimer: Niveshaay is a SEBI Registered (SEBI Registration No. INA000008552) Investment Advisory Firm. The research and reports express our opinions which we have based upon generally available public information, field research, inferences and deductions through are due diligence and analytical process. To the best our ability and belief, all information contained here is accurate and reliable, and has been obtained from public sources we believe to be accurate and reliable. We make no representation, express or implied, as to the accuracy, timeliness, or completeness of any such information or with regard to the results obtained from its use. This report does not represent an investment advice or a recommendation or a solicitation to buy any securities.
Niveshaay RHI Magnesita India Research Report
Disclaimers and Disclosures
SEBI Registration No. :INH000017338, IN/AIF3/24-25/1571, IN/AIF2/24-25/1607 | BASL Membership ID: 6276
Investment in Securities Market are subject to market risks. Read all related documents carefully before investing. The securities quoted are for illustration only and are not recommendatory. Registration granted by SEBI, membership of a SEBI recognized supervisory body (if any) and certification from NISM in no way guarantee performance of the intermediary or provide any assurance of returns to investors.

Digital Infrastructure & Connectivity
Indian MDF Industry

THIS REPORT COVERS
| WHY MDF INDUSTRY? | INDIAN FURNITURE INDUSTRY |
| ABOUT MEDIUM DENSITY FIBER BOARD (MDF) | MDF VS PLYWOOD |
| EXISTING PRODUCTION CAPACITIES & PROPOSED CAPEX OF TOP ORGANIZED PLAYERS | CONCLUSION |
| Research Analyst: Ramswaroop Agarwal (rsa0308@gmail.com) & Kartik Mediratta (Kartikmediratta64@gmail.com) |

The use of Medium Density Fibreboard (MDF) is increasingly finding market acceptance over plywood and India is no exception. Its global market size is estimated at 105.16 million CBM (USD 50.2 billion) in 2021. It is expected to witness a CAGR of 9.6% in the period of 2021-2026. In India, the MDF market size is estimated to be 2.8 million CBM (i.e., Rs. 3000 crores) in 2021. It is expected to grow at CAGR of 15-20% to Rs. 6000 crores by 2026.
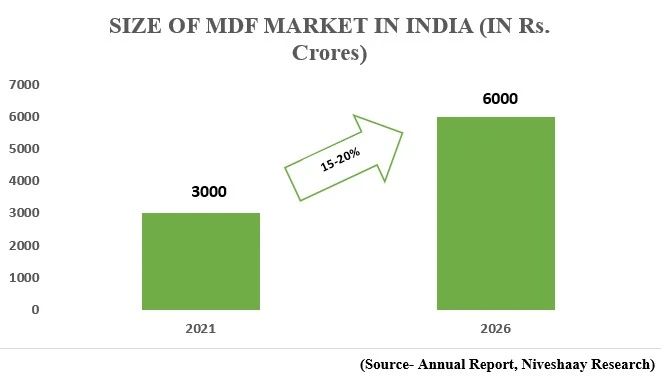
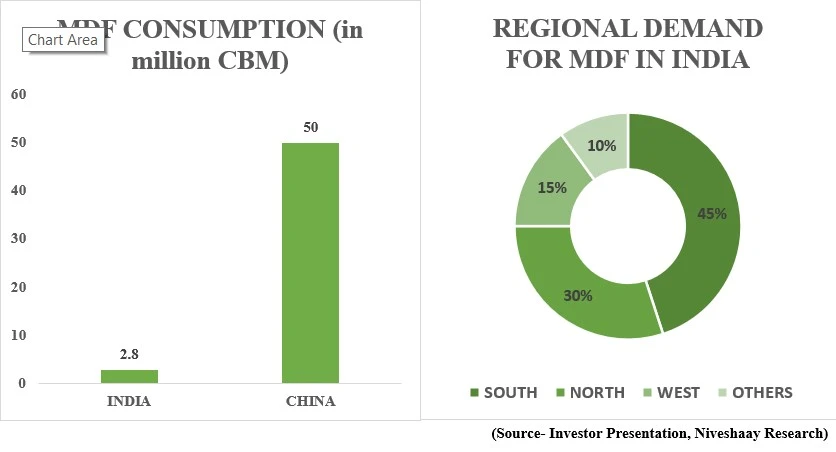
The Indian Furniture Industry (especially the residential and home furnishing segments) continues to be dominated by plywood. Globally, the MDF to plywood consumption ratio is 80:20, but in India, the ratio is skewed in favour of the plywood at 20:80. This number suggests that there is enough room for the growth of MDF in the country in the future.
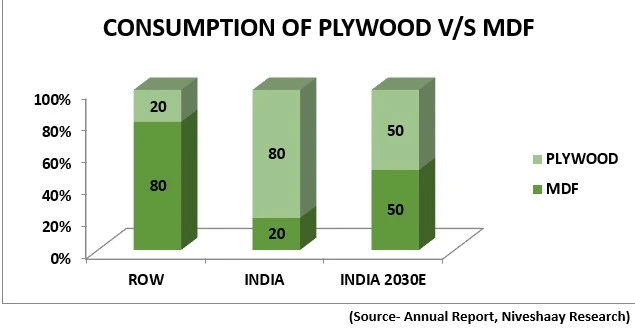
According to Industry experts, it is estimated that the MDF : Plywood ratio in India will improve to 50:50 by 2030. This presents a strong growth potential for the MDF industry in India. It is expected to gain market share of low & medium grade plywood (which constitute 85% of the plywood market in India)
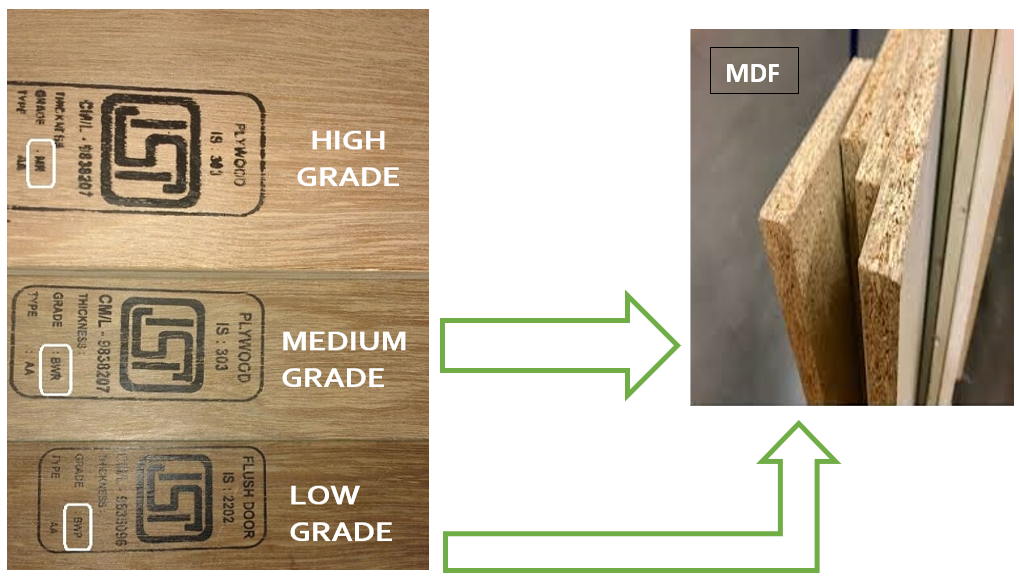
As both MDF and plywood have similar properties, both have been largely utilized in the manufacture of furniture such as tables, sofas, beds, and library shelves. MDF costs significantly lower than plywood while being devoid of particlegrain and knots in its structure. Owing to these properties, this fiberboard proves to be an excellent alternative toplywood for application in areas wherein moisture and impact resistance are not the primary requirements.
Moreover, MDF has proved to be an excellent material for the formation of partitions in office spaces to ensure privacy and social distancing between the employees, which has been a key reason behind the sustenance of the material demand in the time of coronavirus. As many companies have taken up projects to renovate the offices to provide a homely feel to the returning employees after the reduction of lockdown restrictions, the industry is expected to stay healthy in the near future.
MDF’s market share is further expected to increase with the rising prices of Poplar Timber, a chief source of economy grade plywood in North India.
In India, MDF has penetrated all the regions in terms of market presence and is rapidly advancing in terms of both consumer demand as well as production capacity. The production capacity has grown by more than 12x from 0.15 million CBM in 2010 to 1.8-1.9 million CBM in 2021. Further, it is expected to witness a CAGR of 20-25% in the period 2021-2030.
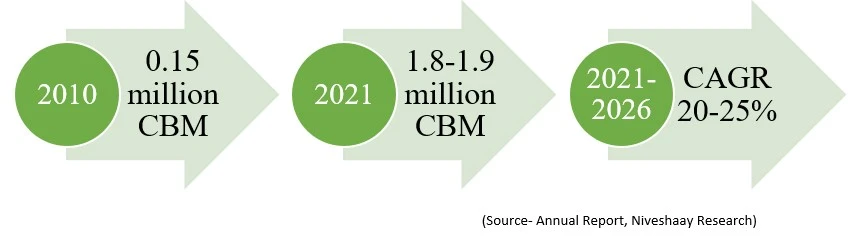
Due to this, it less likely to face competition from the unorganized segment, resulting in larger market share for the organized players and higher growth potential.


The size of the Indian furniture market is estimated to be around USD 25-30 billion. It is expected to grow @ CAGR of 12% in 2021-26.
The Furniture industry can be classified into many segments based on materials used
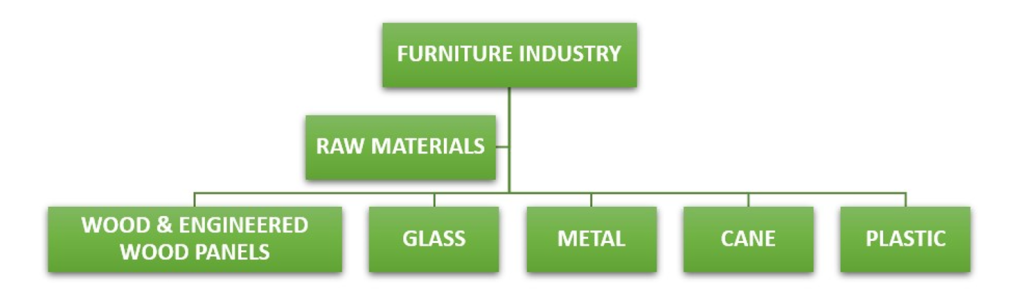
Out of the above, Wood and wood based products (which include engineered wood panels such as Medium Density Fiberboards (MDF), plywood, particle boards- all processed from raw timber) garner a larger market share.
The wood panel industry is on the cusp of healthy expansion as the principal component for furniture manufacturing in India. As per Televisory report, the size of the wood panel industry in India is Rs. 28,000 Cr. and is estimated to grow at CAGR of 10% to 12%.
COMPONENTS OF WOOD PANEL INDUSTRY
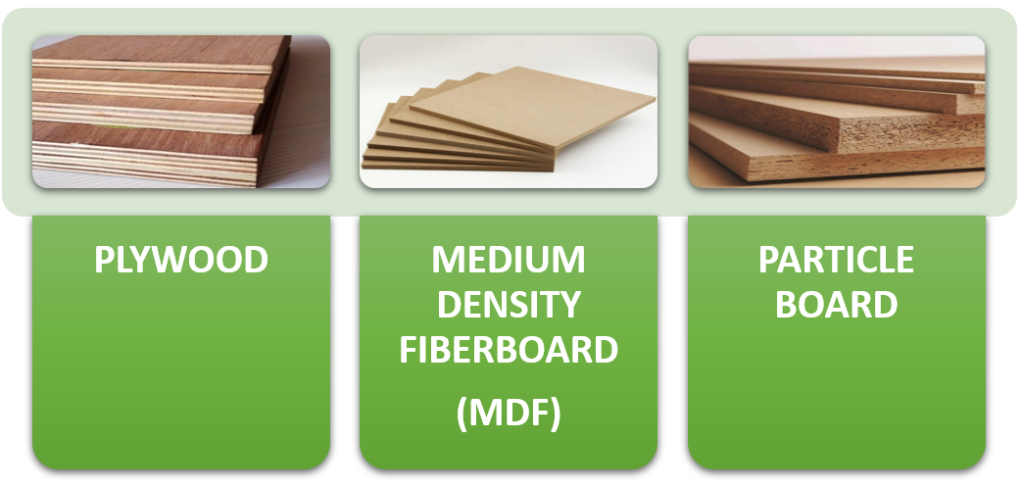
These are also known as ‘engineered wood’, as they are processed from raw timber. As a cheaper, more durable, and eco-friendly alternative to wood, these products are gaining traction in the market. They are highly suitable to cater to the market demands of light weight, multipurpose furniture that confirms to the up-market style

Medium-density fiberboard (MDF) is an engineered wood panel that is formed by coalescing wood fibers obtained from breaking down hardwood and softwood in a defibrillator. It has a non-directional grain structure, making it an ideal wooden material for cutting, machining drilling processes without the production of chips or splinters. Furthermore, the absence of knot makes it easier for finishing, making it suitable for application in the interior decoration of houses and offices. MDF are usually denser than plywood, along with being considerably inexpensive. These factors make it an excellent alternative material for application wherein moisture resistant and very high impact resistance are not obligatory attributes. For instance, MDF is largely utilized in the assembly of furniture cabinetry and wood flooring subsurface.
MDF is typically made up of 82% wood fibre, 9% urea-formaldehyde resin glue, 8% water, and 1% paraffin wax
Rising trend in the cost of raw materials is a cause of worry for the MDF manufacturers. In the last 6 months, cost of chemicals/resins has increased by 70-80% due to sharp rise in Brent crude oil price which has gone up by 70% in last 6 months. Raw material prices are also impacted by higher container freight rates, strong dollar and price increase in origin countries.
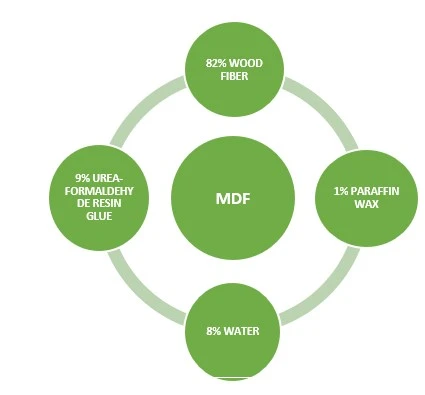
Recent spurt in raw material prices and strong demand condition have encouraged the MDF manufacturers to go for price hike in the last few months. For example, Greenpanel hiked prices by 3% in South India and 6.5% in the rest of India between December 2020 and January 2021 due to an increase in raw material cost. Similarly, other manufacturers, including Century Ply, have hiked prices by 3-8% in last few months.


| PARTICULARS | MDF | PLYWOOD |
| Finish | Smooth and homogeneous in cross-section. | Smooth surface and a cross-section will show different layers or plies. |
| Cost | Cheaper than plywood | More expensive |
| Environmental impact | Eco-friendly, as it re-uses waste wood products | Less eco-friendly, as it uses wood veneers |
| Workability | Can be shaped or moulded, and grooves can be cut. Using a router, smooth decorative edges can be created | Cannot be shaped or moulded, and grooves cannot be cut in the plywood. Cut edges are likely to be rough and have splinters |
| Water resistance | Unless sealed on all sides and edges with primer, paint, laminate or membrane, etc, it will soak water and swell up | More resistant to water than MDF. However, all cut edges and surfaces should be well sealed |
| Screw holding capacity | Lower screw holding capacity than plywood as the particles are very fine. If nailed at the edge of the board, it will split | Holds screws well. Can be nailed even at the edges |
| Consistency of the board | Homogeneous, consists of fine particles | Consists of layers of wood veneer with the grains on each layer running in a different direction |
| Strength | Less strong than plywood | The layers give additional strength |
| Durability and Resilience | Durable when finished well. However, less durable than plywood | Durable when finished well. |
| Maintenance | Should not be exposed to water. Need maintenance according to the surface finish: for example, laminates should be wiped clean, veneers can be polished | Should not be exposed to water. Needs maintenance according to the surface finish: for example, laminates should be wiped clean, veneers can be polished |
| Weight-bearing capability | Sags under heavy weight as it is not stiff | Do not sag. Holds weight well if there are enough layers |
| Flexibility | Inflexible board | Flexible in thin sheets |

| COMPANY | YEAR OF COMMENCEMENT OF MDF PLANT | MCAP (in Rs. Crore) | CURRENT CAPACITY (in CBM p.a) | PROPOSED CAPEX (in CBM p.a) |
| GREENPANEL | 2010 | 4,775 | 5,40,000 | 1,20,000 |
| ACTION TESA | 2010 | UNLISTED | 4,20,000 | 2,00,000 |
| RUSHIL DÉCOR | 2012 | 737 | 3,30,000 | – |
| CENTURY | 2017 | 14,180 | 2,00,000 | 3,50,000 -3,60,000 |
| GREENPLY | Mar, 2023E | 2,633 | – | 2,40,000 |
Due to sustained momentum in demand as well as prices, manufacturers are getting a clear revenue visibility, despite some price war in the market space. The capacity utilization in the industry has also gone up by 15% to 20% (i.e. 70-75% in 2021, which is expected to improve to 80-85% by 2025).
Industry experts believe that demand for MDF will match the increase in production capacity within the next couple of years.

There is a huge growth expected in the MDF industry for the abovementioned reasons. However, growth is only possible with the synchronized play of the underlying factors such as capacity expansion, efficient use of resources, quality improvements and growth in demand. Whether, any company would be able to capitalize such opportunities is dependent on how they outperform their peers.
Disclaimers and Disclosures
SEBI Registration No. :INH000017338, IN/AIF3/24-25/1571, IN/AIF2/24-25/1607 | BASL Membership ID: 6276
Investment in Securities Market are subject to market risks. Read all related documents carefully before investing. The securities quoted are for illustration only and are not recommendatory. Registration granted by SEBI, membership of a SEBI recognized supervisory body (if any) and certification from NISM in no way guarantee performance of the intermediary or provide any assurance of returns to investors.
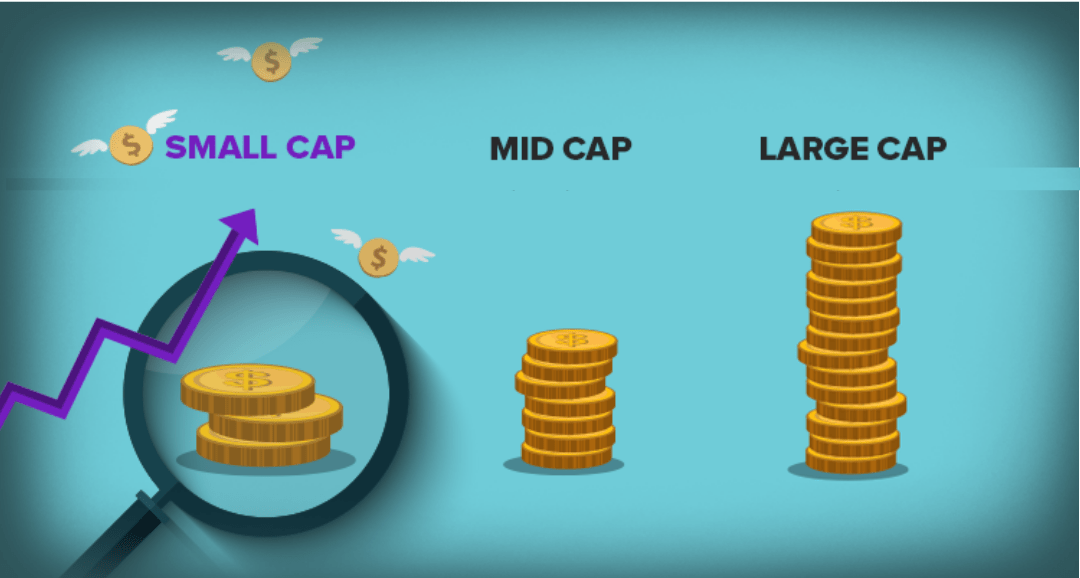
Metals & Mining
TrailBlazing Small Caps!
Small caps have been on fire recently. They have been such great out-performers and have been the talk of the town within the Indian Financial markets. People just can't stop talking about them. With a long period of muted performance, the smallcap stocks have now performed exceptionally well in the last one year. To make
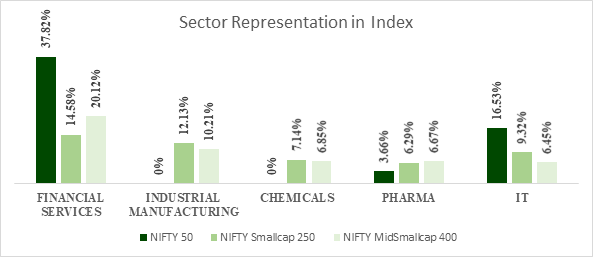
Now, if we dig one step further and analyse the top constituents of the NIFTY SMLCAP 250, we can deduce that the high growth technology platform companies like IEX, CDSL and Tanla Platforms Ltd. have also performed well in the past year. This also explains the rise in small-cap indices.
Top constituents by weightage in Nifty Smallcap 100 –
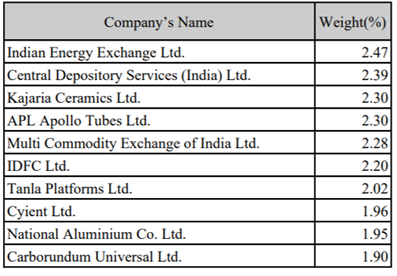
ii. A Historical Perspective- It’s interesting but things change beyond our expectations at times
Cyclicity is the fundamental nature of equity markets: Small and Mid-cap had a tough ride before
If we look at the charts of small and midcap companies, they were all beaten down from their peaks of 2018. This paved the way for good upside potential.
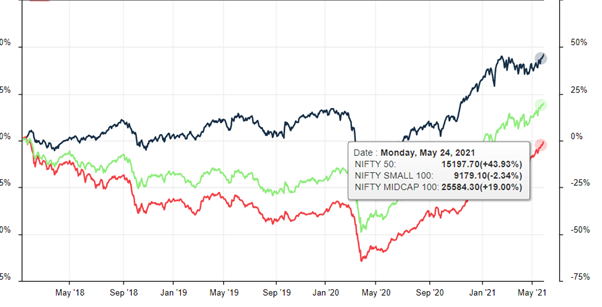
Similar scenario was observed from April 2012-2014 when the small and mid-cap indices under-performed the large cap index. This was followed by a good rally from May-2014 to Jan-2018 in small and mid-cap generating 33% CAGR returns.
iii. Multi-fold increase in market participants
Active retail and HNI participation also explains the rally in small and mid-caps. The number of demat accounts at CDSL stood at 2 crores in Jan-2020. The number grew to 3.34 crores in March-2021. Around 98.4% of the total new accounts opened comes from retail investors.
This resulted in inflow of liquidity into smaller stocks. In a rising market, small-cap tends to grow faster than large cap which is generally preferred by institutional investors.
2. Small caps have been giving some exceptional returns after a period of muted performance. What could be the reason for this?
Liquidity, low interest rate and currency stability in the past year explains a good rally in small and mid-cap index after a muted performance.
Small sized companies rely on external capital for their growth as compared to large companies. Higher interest rates means higher cost of capital. This results in growth becoming more expensive. If the interest rate is lower, that means the denominator while estimating the valuation is lower resulting in higher estimated valuations for small companies.
Also, low interest rates create liquidity. This resulted in more money coming into equity markets.
Small and Mid-Cap trading at attractive valuations
The small and mid-cap indices are far more volatile than large cap. During the March lows, many good quality small cap companies were trading at attractive valuations. Ample liquidity in the market combined with government’s effort to revive the economy, positive FPI inflows boosted the investor sentiments and took markets to higher levels including the small and mid-cap stocks.
Last One Year Performance Chart of NIFTY 50, NIFTY SML 100 & NIFTY Midcap 100
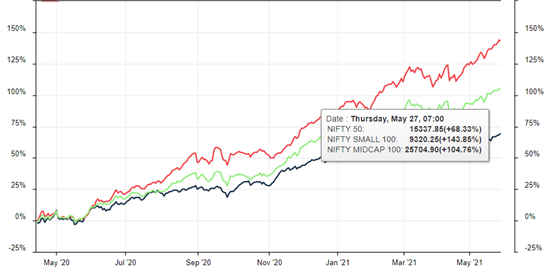
3. What are the risk factors that need to be taken into account before investing in smallcaps?
Investment Horizon: The time horizon should be around 3-5 years to generate meaningful returns.
Volatile and Illiquid Nature: Small cap stocks are more prone to market fluctuations and take time to recover from market recessions making them volatile in nature. Also, it offers less liquidity to investors. Sometimes, it becomes difficult to sell.
Change in macro factors and market fluctuations: An increase in interest rate can change the sentiment of investors. Any reversal in bond yields could lead to a sharp correction in the global equity markets. Small caps correct faster than the large indices. Growth stocks valuations are more sensitive to change in interest rates. The lower growth rate in GDP than expectations also can hurt small caps.
One should do thorough research in these stocks before considering them as an investment avenue.
4. What does the trend for smallcaps look like moving forward and how long can this last?
Recovery in the earning cycle – Generally, a favourable cycle for small caps sustains for 3-5 years. It is necessary to move down one level to find out which sectors in particular can do well in the coming years. Sectors such as pharma, chemicals and capital goods continue to perform well. Companies should have good earnings visibility, exhibit demand recovery after the unlocking of the economy.
Corporate profit to GDP ratio hits a 10-year high of 2.63% in FY21 – The combined net profit of the listed companies was up 57% to 5.31 trillion in FY 21. Improvement in operating margins and lower cost of capital boosted companies’ profits to a decade high. The corporate profit share in India’s GDP hit a 10 year high of 2.63% in FY 21, it was at a record low of 1.6% in FY 20.
Large blue-chip companies were already earning well and were not much impacted in previous years. Major growth in FY 21 ratio came from cyclical, mid and small-size companies.
Nifty 50 vs Nifty 500 EPS Growth in the last 1 year
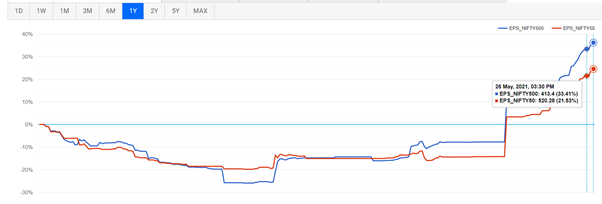
The increase in earnings ratio signals that the unlisted or unorganized players were affected the most during the lockdown.
The shift from unorganized to organized sector– In 2017, after demonetization and GST, many small and mid-cap companies increased in the hope of the shift from unorganized to organized sector, but the shift was not meaningful at that time.
Sectors such as apparel, tiles and sanitaryware, plywood, textile, footwear, logistics, electrical equipment, and plastics form a higher composition in the unorganised sector. After unlocking the lockdown, this shift seems clearer and also visible in earnings of the last few quarters. Some of them may see erosion in profits while the others might fail to survive. This will help listed mid and small companies to gain market share in the sector.
Government Policies – Large companies have a strong product portfolio and a competitive advantage over the peers. These companies are generally less dependent on government policies and competition from outside India. The focus of the government on Make in India, PLI Scheme and the imposition of duties on import of products and other initiatives to support domestic business will help mid and small-cap companies in expansion, improving competitiveness and margins.
Higher GDP growth expectation on a low base – The RBI has projected FY’22 GDP growth at 10.5 percent, while IMF puts it at 12.5 percent. The World Bank sees 2021-22 growth at 10.1 percent. Higher growth expectation scenarios help more mid and small-cap companies.
5. What could be the easiest way for investors to have a share of the pie with heavy returns?
Niveshaay is a SEBI Registered Investment Advisory Firm with a Dedicated Research Team specializing in unearthing high quality undervalued stocks. We are focused on mid and small cap companies.
At Niveshaay, we have continuously invested in stocks that are available reasonably and have huge earning potential upside.
We have designed ‘Mid and Small Cap Focused Portfolio’ on smallcase
It is a portfolio which constitutes more than 70-80% allocation in quality small-cap stocks.
Our portfolio is perfectly suitable for an investor with a time horizon of 3-5 years, and strongly looking for long-term investments.
We have been live on the smallcase platform since Sep 2019. The unprecedented COVID crisis was the most stringent stress test that one could have applied on their portfolio companies. We have proved our strategy on the platform by outperforming the index returns with good margins.
Live Performance of Niveshaay’s Smallcase Vs Equity Small Cap Index
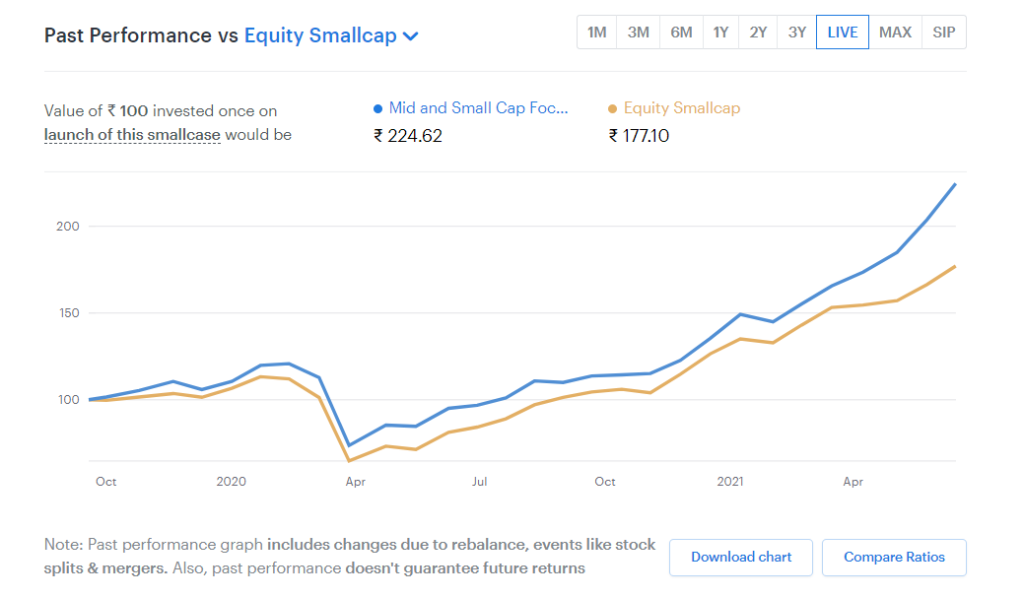
Live Performance of Niveshaay’s Smallcase Vs NIFTY Index
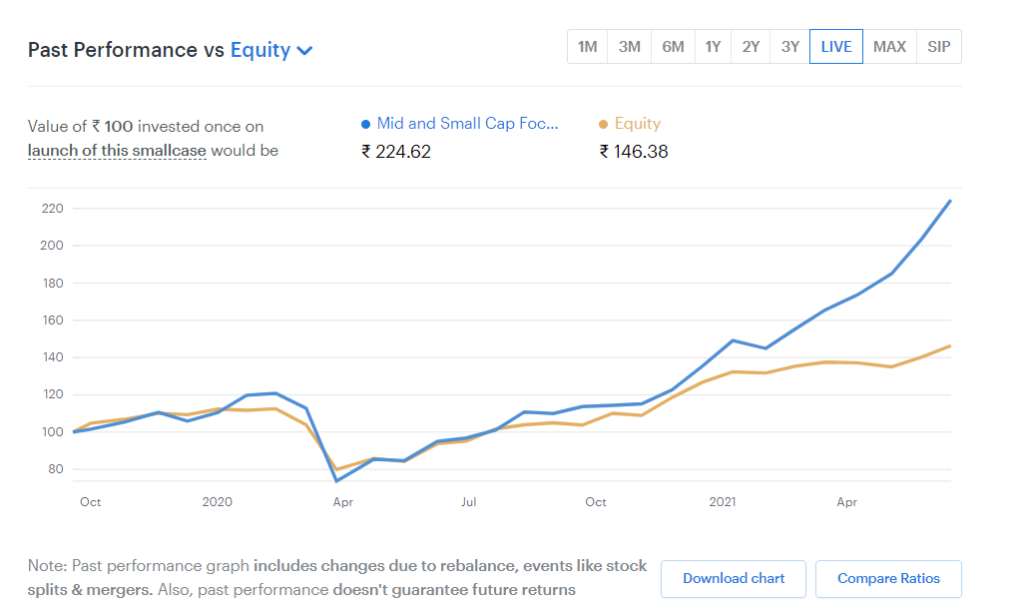
You can checkout Niveshaay’s very own mid and smallcap smallcase here – https://niveshaay.smallcase.com/smallcase/NIVMO_0001
Disclaimers and Disclosures
SEBI Registration No. :INH000017338, IN/AIF3/24-25/1571, IN/AIF2/24-25/1607 | BASL Membership ID: 6276
Investment in Securities Market are subject to market risks. Read all related documents carefully before investing. The securities quoted are for illustration only and are not recommendatory. Registration granted by SEBI, membership of a SEBI recognized supervisory body (if any) and certification from NISM in no way guarantee performance of the intermediary or provide any assurance of returns to investors.