

Textiles
Niveshaay Invests in Design-First Fashion Brand : Theater
Niveshaay Sambhav Fund leads Theater’s ₹75 Cr fundraise with a ₹48 Cr investment, backing its next phase of growth in Indian fashion.
At Niveshaay, we look for businesses that are not just participating in a category, but reimagining it.
We are excited to announce our investment in Theater through the Niveshaay Sambhav Fund, leading its ₹75 Cr fundraising round with a ₹48 Cr investment, at an entry valuation of ₹340 Cr.
From our very first interaction, Theater stood out as a design-first fashion house reimagining shoes, stockings, bags and accessories for Modern India. Its commitment to category-defining design, quality and deep consumer resonance makes it a compelling brand in the direct-to-consumer space.
We are thrilled to partner with Sarthak Aggarwal, Karan Jain, Vikram Jain, Shruti Agarwal and the entire team at Theater as they scale the brand and build one of India’s most compelling fashion and lifestyle businesses.
Congratulations to the entire team on this milestone. We look forward to being part of the exciting journey ahead.
Electronic Manufacturing Services
This Industry Has Almost Zero Competition.
Steam House India supplies steam to 202 Gujarat factories via a 57-km pipeline — and no rival has matched it in a decade. Here's why.

Ten years ago, walk into a chemical or pharma unit in Vapi, Ankleshwar or Sarigam, and you’d have found a boiler sitting somewhere on the plot – a squat, coal-fed structure behind the main building, with its own coal yard, its own ash pit, and its own file of paperwork for the boiler inspector. The plant made its own steam because there was no other way to get it.
Today, walk into 202 of those same factories, and the boiler is gone. The steam still arrives – hissing through a pipe that enters from outside the compound wall, metered at the gate like electricity or water.
Every one of those pipes traces back to the same company. Not because a licence bars competitors. Because in ten years, nobody else has managed to lay a second one.
That’s the strange part worth sitting with. Steam is about as basic a product as industry makes – hot water, essentially. There is no patent on it, no rare ingredient, nothing exotic. And yet an entire industrial region in Gujarat gets it from exactly one supplier, and pays that supplier 30 to 45 percent more than it used to cost them to make it themselves.
This is the story of how a commodity turned into something only one company could sell – and why that’s about to matter well beyond Gujarat.
What’s Actually Being Sold
Steam sounds unglamorous because it is unglamorous – water, heated under pressure, piped somewhere and used to run a reactor, dry a fabric, or sterilise a vial.
But it is also non-negotiable.
Pharma companies cannot sterilise without it. Textile units cannot dye without it. Food plants cannot pasteurise without it.
In FY26, India’s factories needed roughly 2,03,472 tonnes of steam every hour, a number expected to climb at a 9.4% yearly pace to cross 3,20,000 TPH by FY31.
Three industries drive most of that need:
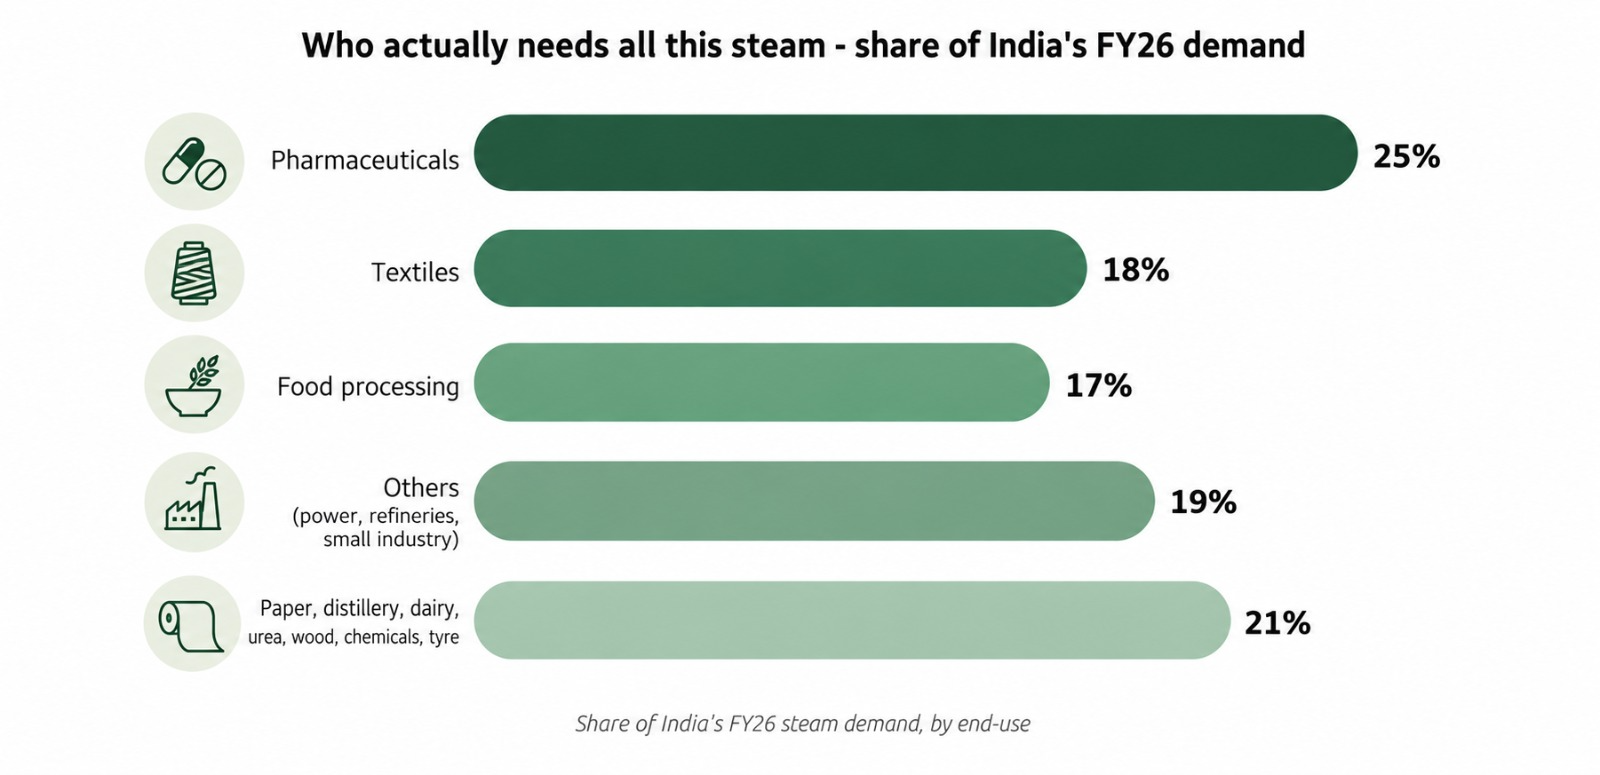
Somebody has to generate all of that steam. Historically, that somebody was the factory itself. Since 2014, a company called Steam House India has been building a case that it shouldn’t be.
Its founder spent close to three decades in industrial operations before betting that boilers – like power or water – could be run as a shared utility instead of two hundred separate, badly-utilised private ones.
A decade on, Steam House runs seven community boilers and two trading units, supplying 202 factories across seven Gujarat industrial estates through a dedicated 57-kilometre pipeline – up from 91 customers just three years ago, with over 90% of its revenue now coming from repeat buyers.
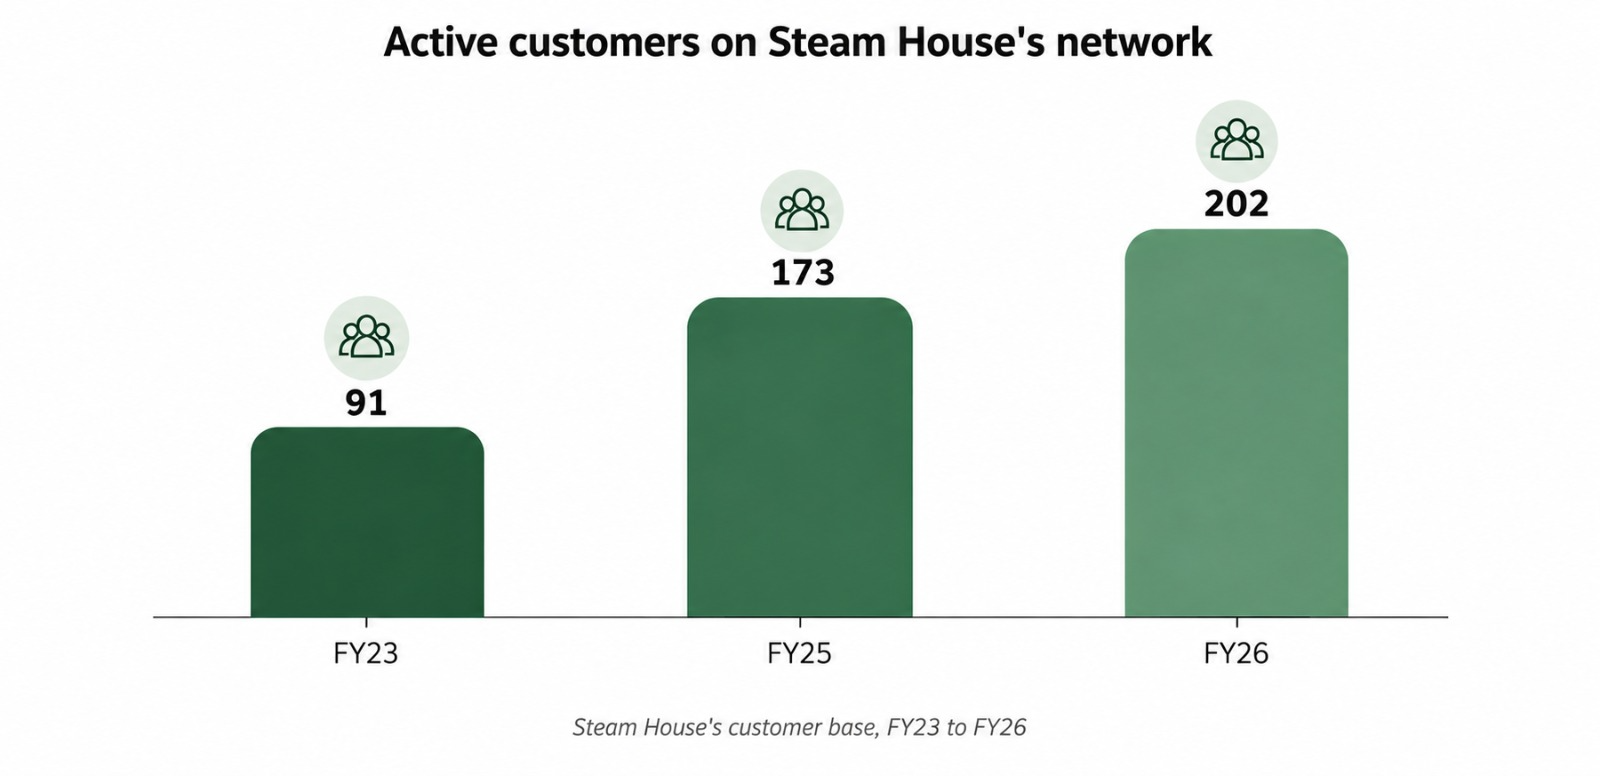
That kind of loyalty is unusual for a supplier charging above-market prices. Which brings us to the part of this story that doesn’t add up on first read.
The Premium Nobody’s Hiding
A factory that used to burn its own coal pays Steam House roughly Rs 3.30-3.80 for every kilogram of steam – against the Rs 2.30-2.80 it used to cost them to make it in-house. That’s 30 to 45 percent more, for the identical output. A factory that used to run on gas, by contrast, pays the same Rs 3.30-3.80 – but was previously paying Rs 4.80-6.25, so for them it’s a straightforward saving.
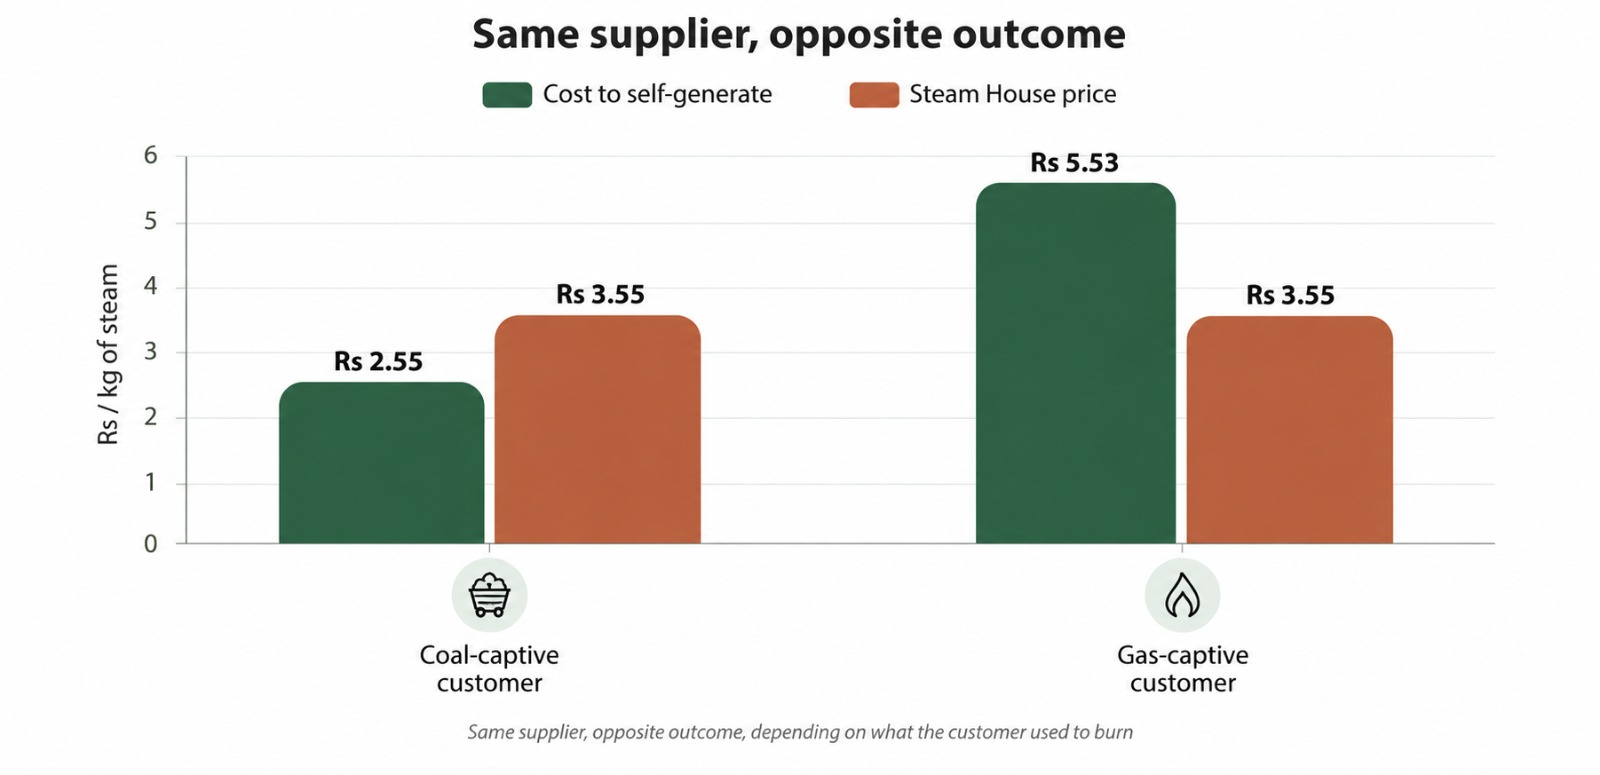
The gas-fired factory’s decision is easy – cheaper steam, no debate. The coal-fired factory paying a premium is the more interesting case, and the bigger one: coal-route steam alone makes up close to three-quarters of the company’s revenue.
So if the coal-fired customer isn’t switching to save money, what exactly is it buying with that extra 30 to 45 percent?
What The Premium Is Actually Buying
Run a captive coal boiler yourself, and the steam price on your own ledger is the smallest part of the real cost. Ownership quietly hands you six other jobs you never signed up for:
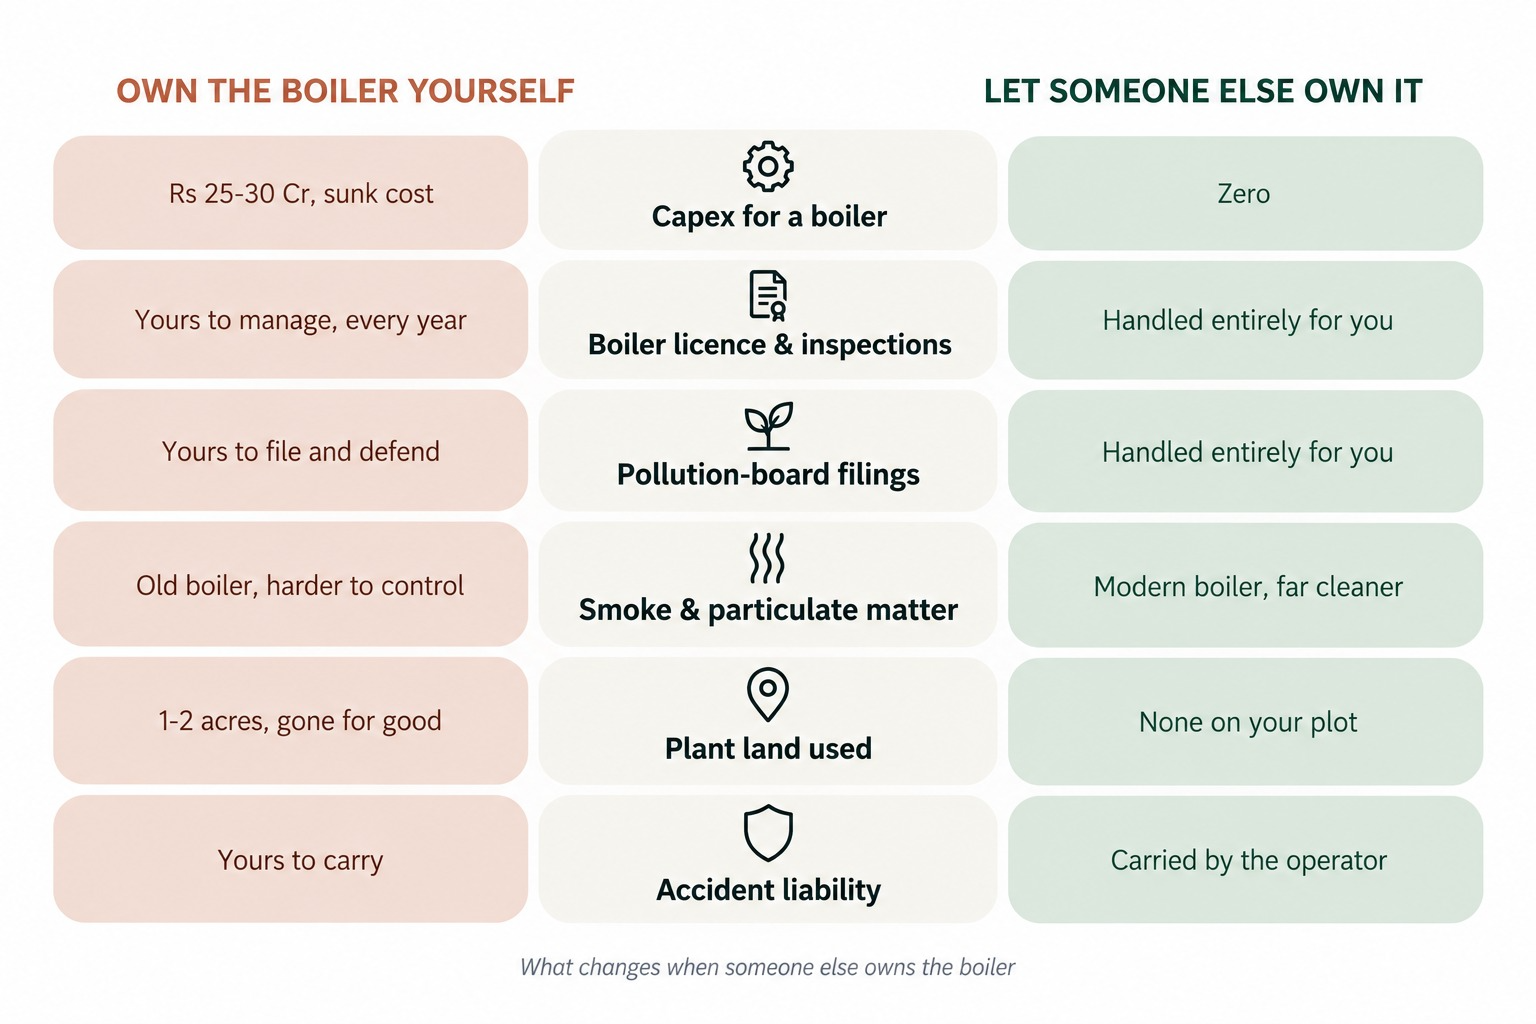
Line up all six of those rows, and the invoice a coal-fired factory receives every month stops looking like a steam bill. It starts looking like an exit fee – the price of no longer being, in effect, a boiler company on the side of whatever it actually manufactures.
Regulation has been quietly pushing in the same direction. Surat’s own clean-air plan and the National Clean Air Programme now list community boilers explicitly as an approved pollution-mitigation route, and any factory exporting to the EU or US is increasingly required to disclose its emissions – numbers a captive coal boiler makes considerably worse.
None of this explains, though, why a rival can’t simply set up next door and undercut the premium. That answer sits underground.
The Real Barrier to Entry
No licence or rule is keeping rivals out. It’s simply not a business you can buy your way into – there’s little spare capacity to trade, and not much room to undercut on price. Getting in seems to mean clearing the same three hurdles, factory by factory, that took Steam House the better part of ten years. That’s what a barrier to entry can look like: not a wall someone built, but years of unglamorous work nobody else has put in yet.
Strip the business down to its value chain, and the shape of the moat becomes obvious:
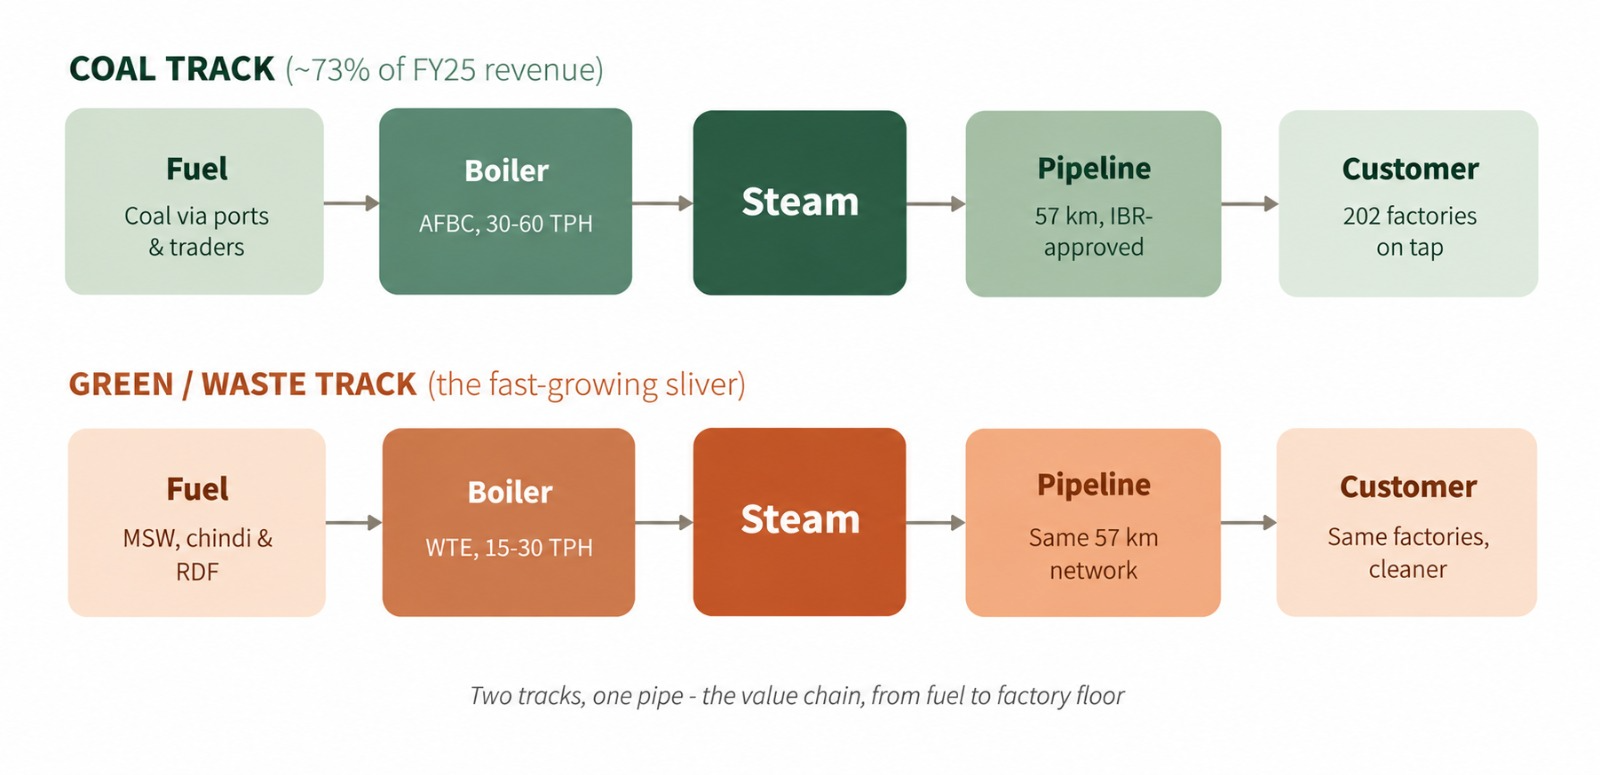
Steam itself – the middle box – is the commodity link. Anyone with capital can boil water. Everything hard sits in the pipeline that follows it. Every one of those 57,041 metres required a Right-of-Use clearance from the industrial estate – crossing plant boundaries, drainage corridors, roads – an approved pressure-vessel design signed off by a statutory inspector, and a physical landing inside a working factory.
A rival trying to copy this doesn’t just need capital. Copying it means clearing three hurdles, one after another:
Ten years, five sequential cluster builds – Vapi in 2017, Ankleshwar in 2018, Ankleshwar Phase-2 with Sarigam in FY23, Nandesari in FY24, Panoli in FY26 – and a fast, repeatable connection process built on an in-house pipeline design team and a dedicated fabrication workshop.
That head start isn’t something a well-funded new entrant can shortcut simply by writing a bigger cheque. It’s the quiet reason this market has one real player instead of several – not a rule keeping others out, just physics and paperwork that reward whoever got there first.
A moat like that only matters if there’s a bigger pond to build it in next. And that’s exactly what’s under construction.
Building The Next Decade
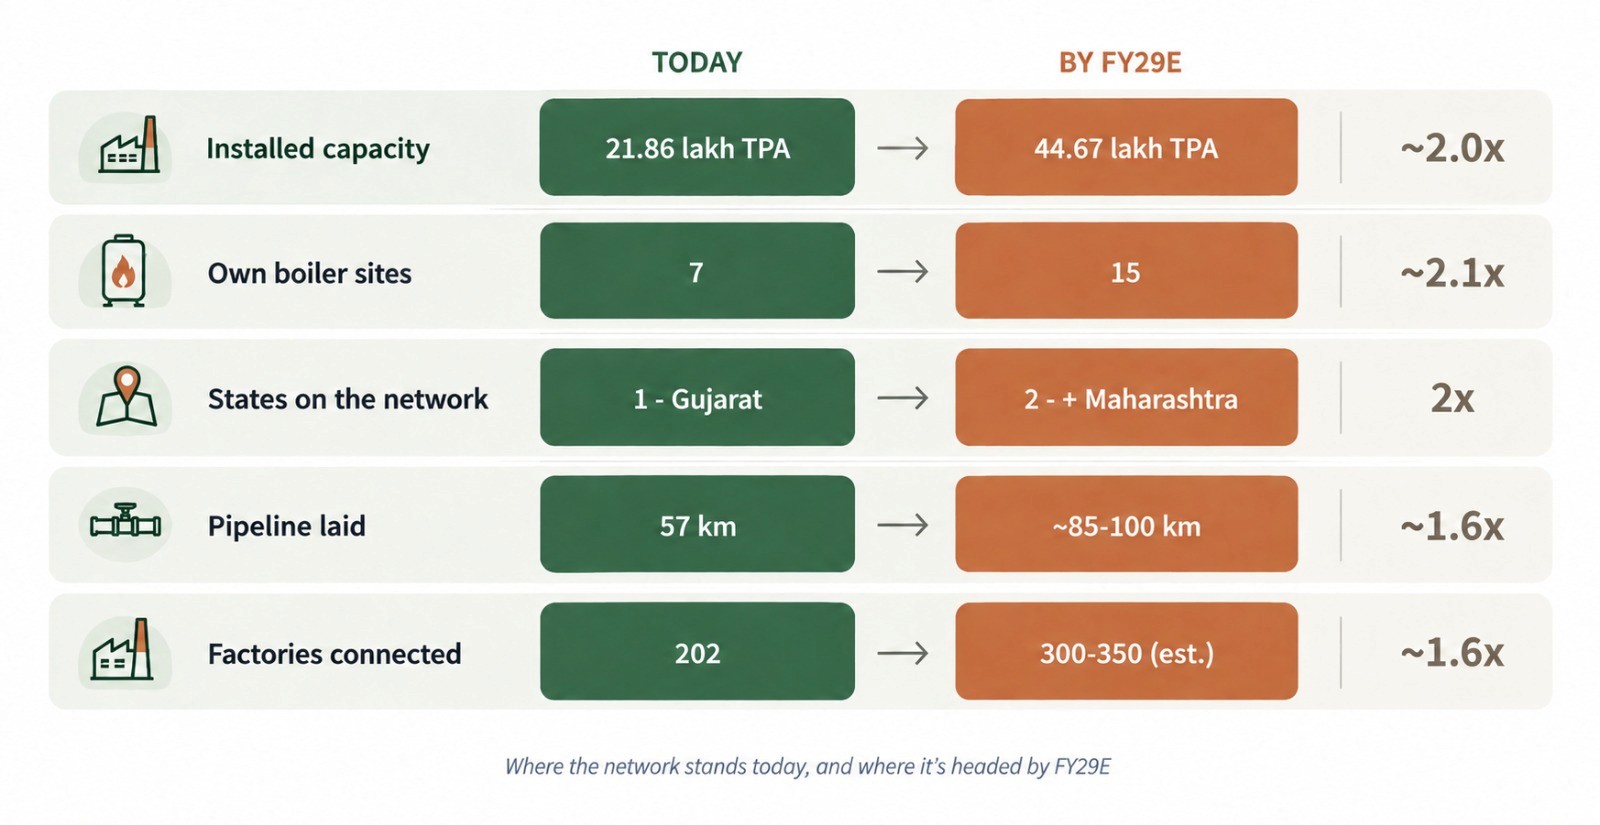
This build-out isn’t happening in a policy vacuum. Government programmes are increasingly writing the community-boiler model directly into how new industrial infrastructure gets designed – textile parks, bulk drug parks and industrial corridors are now being planned with a shared boiler as a default feature, not an afterthought, backed in Gujarat by a capex subsidy of 35-50% on every new unit.
This isn’t an abstract policy tailwind.
On 13 June 2026, the Himachal Pradesh Bulk Drug Park at Una floated a public tender for exactly this model: a 300 TPH boiler steam generation and distribution system, an estimated project cost of about Rs 3 crore, and a 24-month build window. It’s the same common-utility-boiler blueprint Gujarat has run for a decade – now being tendered out in a state where Steam House doesn’t operate yet.
Roadmaps and tenders point to how far this could travel. What’s worth asking next is how far it’s already proven – and where the model could still stumble.
What Could Slow This Down
None of this is a one-way story, and it’s worth saying plainly where it could go wrong. Utilisation across Steam House’s own facilities has historically stayed on the lower side, which means a slowdown in chemicals demand shows up quickly in how efficiently the network is used. Several new plants still have to be built and ramped up over the next few years – a meaningful share of the growth story sits in capacity that doesn’t exist yet.
Customer contracts here are also structurally lighter than the take-or-pay agreements typical of regulated utilities; cluster density makes switching expensive for any one factory, but a single large customer walking away can still be felt. And the regulatory playbook perfected over a decade in Gujarat – right-of-way permits, approval timelines, road-crossing rules – has to be relearned from scratch in Maharashtra, and wherever the next Bulk Drug Park or textile park tender leads.
The Reframe
Nobody in this story is really buying steam. The coal-fired factory is buying an exit from owning a boiler’s compliance and liability. The gas-fired factory is buying a cheaper input. The pollution board is buying a lower emissions number it can report upward. And in the middle of all three sits a company that spent a decade laying pipe that nobody else has managed to lay beside it.
The steam story belongs to Gujarat today.
The blueprint – compliance handed over, capex avoided, land freed up, a government subsidy attached – is now being tendered out state by state, industrial park by industrial park. The interesting question from here isn’t whether community boilers work. It’s whether the next state gets a second player – or the same answer Gujarat did.
Niveshaay Investment Management Private Limited
SEBI Reg No: IN/AIF3/24-25/1571, IN/AIF2/24-25/1607, INP000009506
Registered Office: 610, SNS Platina, Vesu, Surat – 395007
Investment in securities market are subject to market risks. Read all the related documents carefully before investing. Registration granted by SEBI, and certification from NISM in no way guarantee performance of the intermediary or provide any assurance of returns to investors. The securities quoted are for illustration only and are not recommendatory.

Space Ecosystem
Backing Mokobara: Building a Global Consumer Brand from India
Niveshaay participates in Mokobara’s Series C, backing its journey to build a design-led global consumer brand from India.
Today’s consumer wants products that work beautifully, where function and design aren’t trade-offs but the starting point. That’s exactly the space @my_mokobara
has made its own. SangeetAgrawal (@sangeet89) and Navin Parwal took a category India treated as purely utilitarian and built a brand around thoughtful design, obsessive product quality, and an aesthetic people genuinely connect with. From 50 stores across India to a growing presence in the UAE, Mokobara is quietly becoming what we’ve long believed India can produce – a global consumer brand, built from here.
Niveshaay is glad to participate in Mokobara’s Series C alongside @SauceVc, who have backed the company since the idea stage, @peakxvpartners and AYRA Ventures.
Proud to be associated with this team and this journey.
Niveshaay Investment Management Private Limited
SEBI Reg No: INIAIF3/24-25/1571, INIAIF2/24-25/1607, INP000009506
Registered Office: 610, SNS Platina, Vesu, Surat – 395007
Investment in securities market are subject to market risks. Read all the related documents carefully before investing. Registration granted by SEBI, and certification from NISM in no way guarantee performance of the intermediary or provide any assurance of returns to investors. The securities quoted are for illustration only and are not recommendatory.
Electric Vehicle & Ancillaries
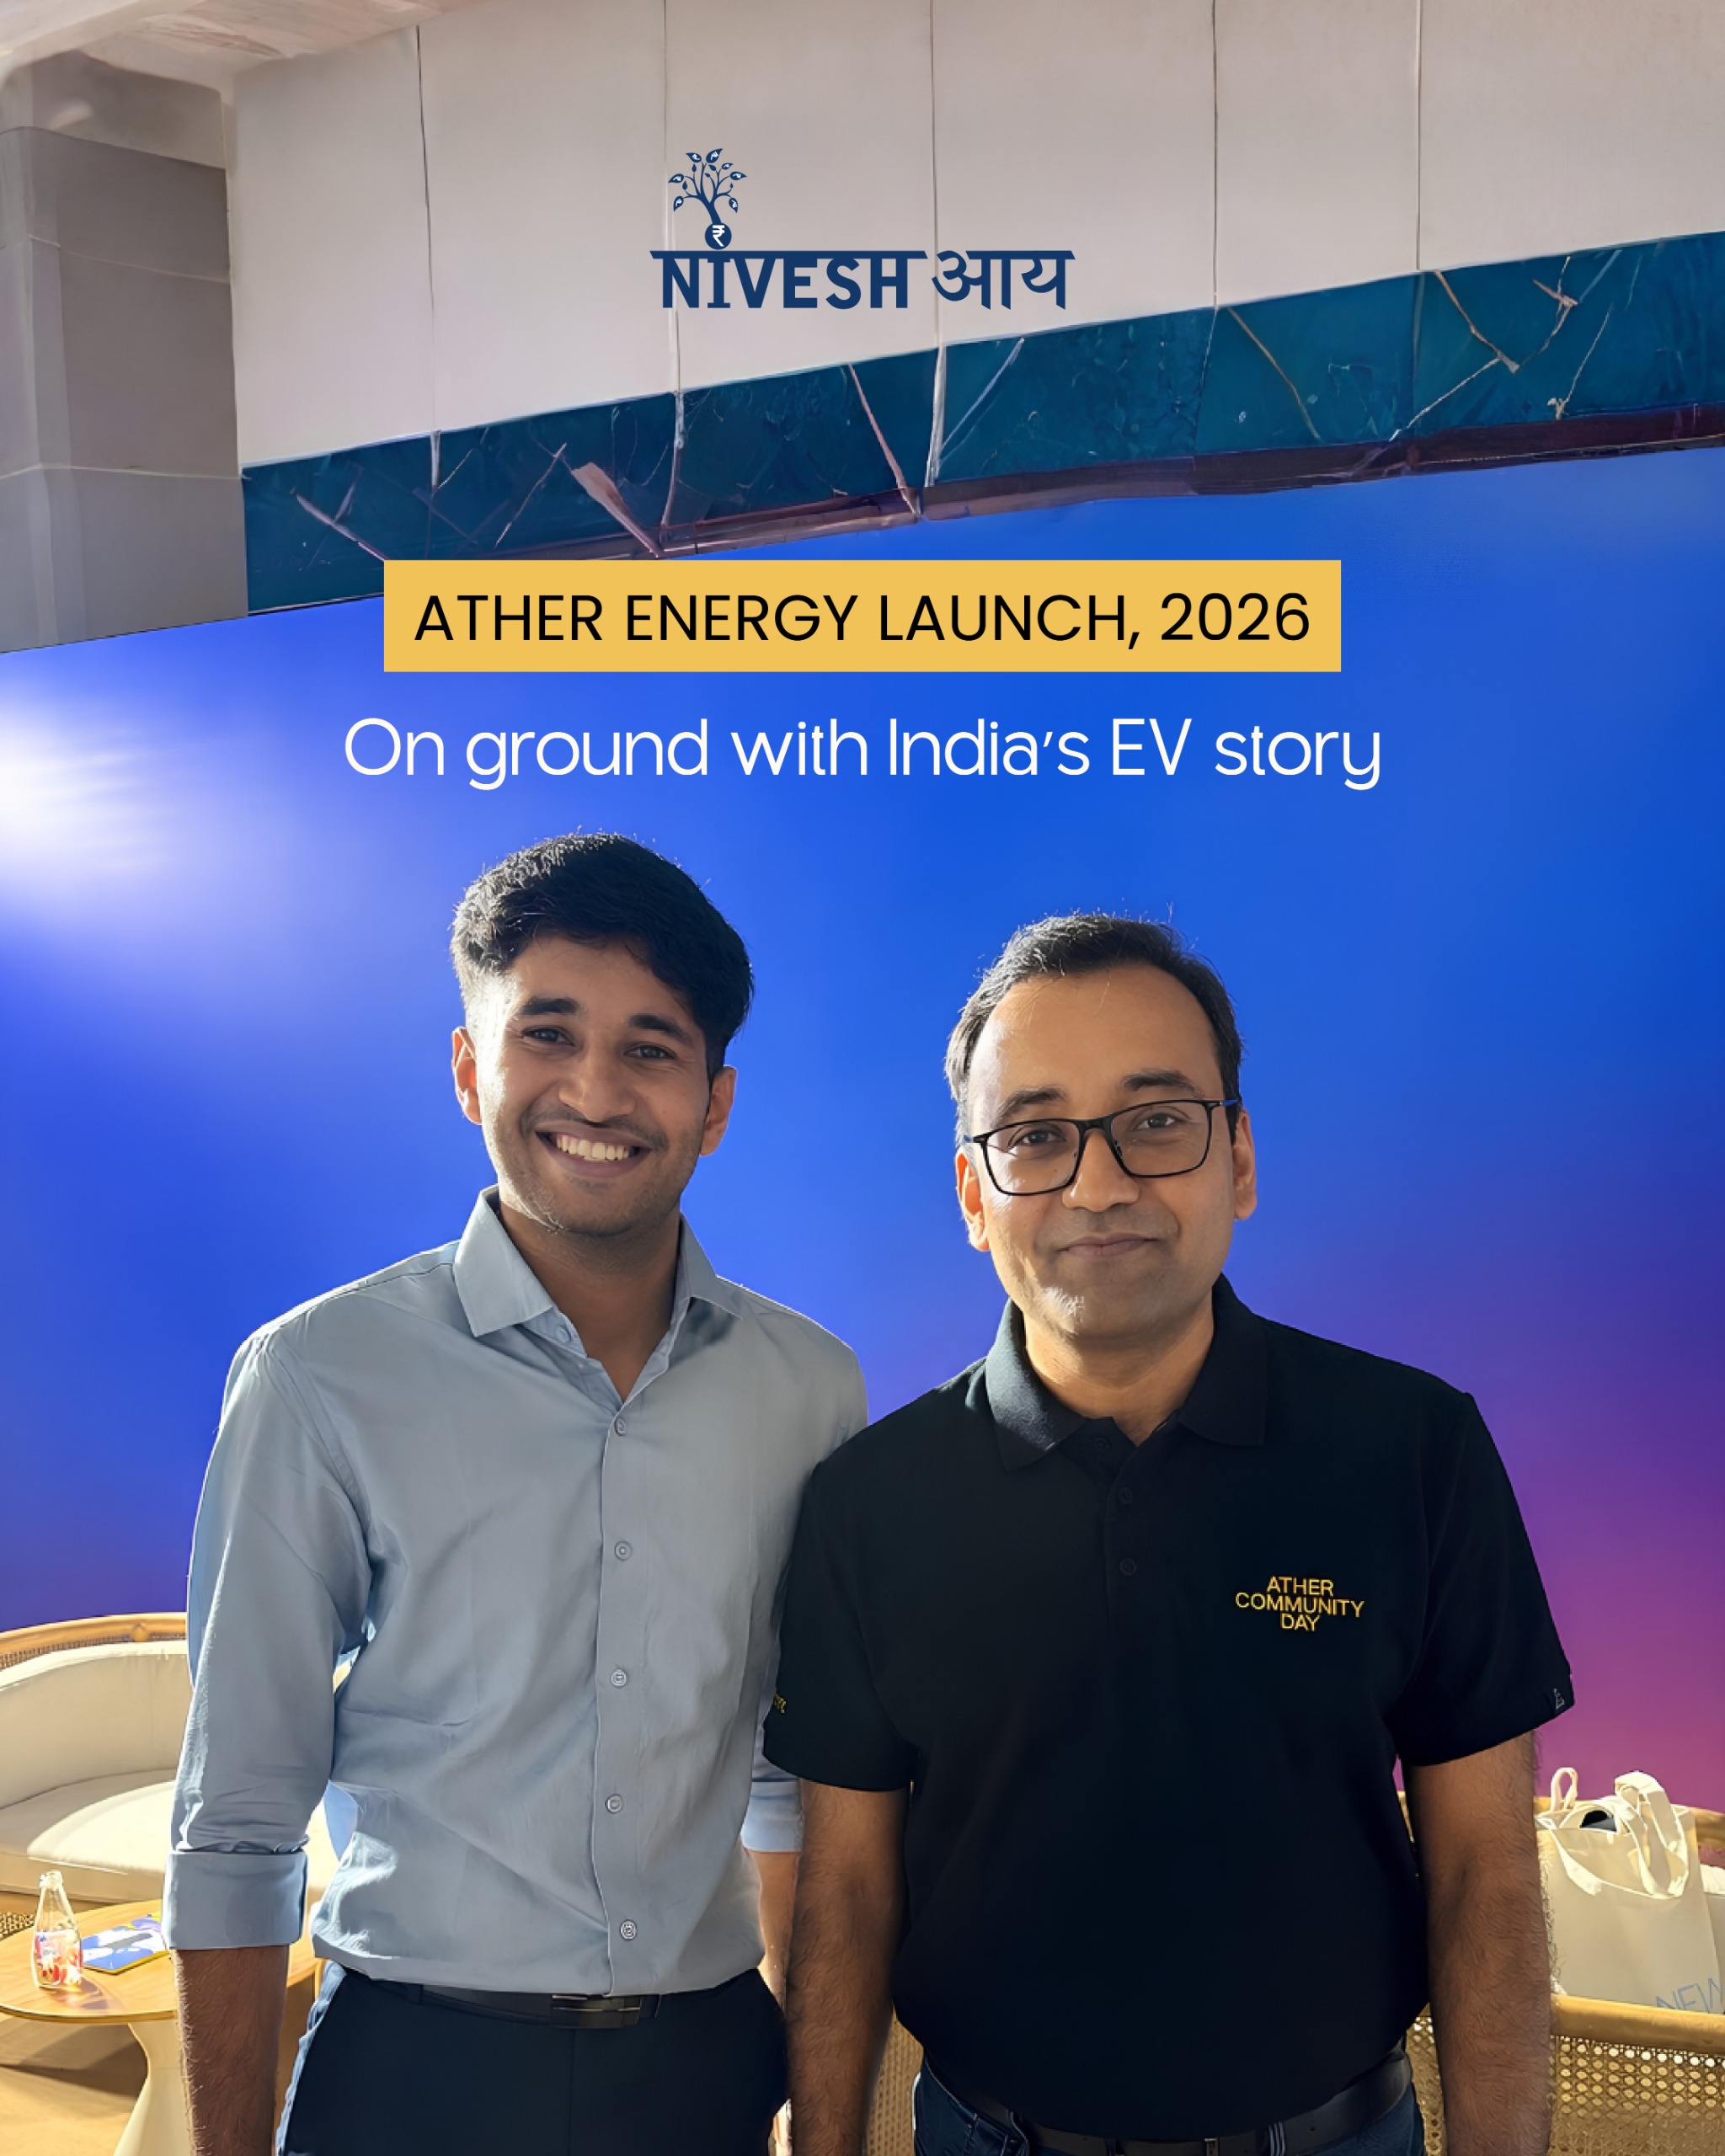
Ather Energy Launch 2026: Inside the Next Phase of India’s EV Story
Inside Ather Energy’s 2026 Launch—from Konarc and the new EL platform to Bedrock batteries, charging infrastructure and the evolving EV ecosystem.

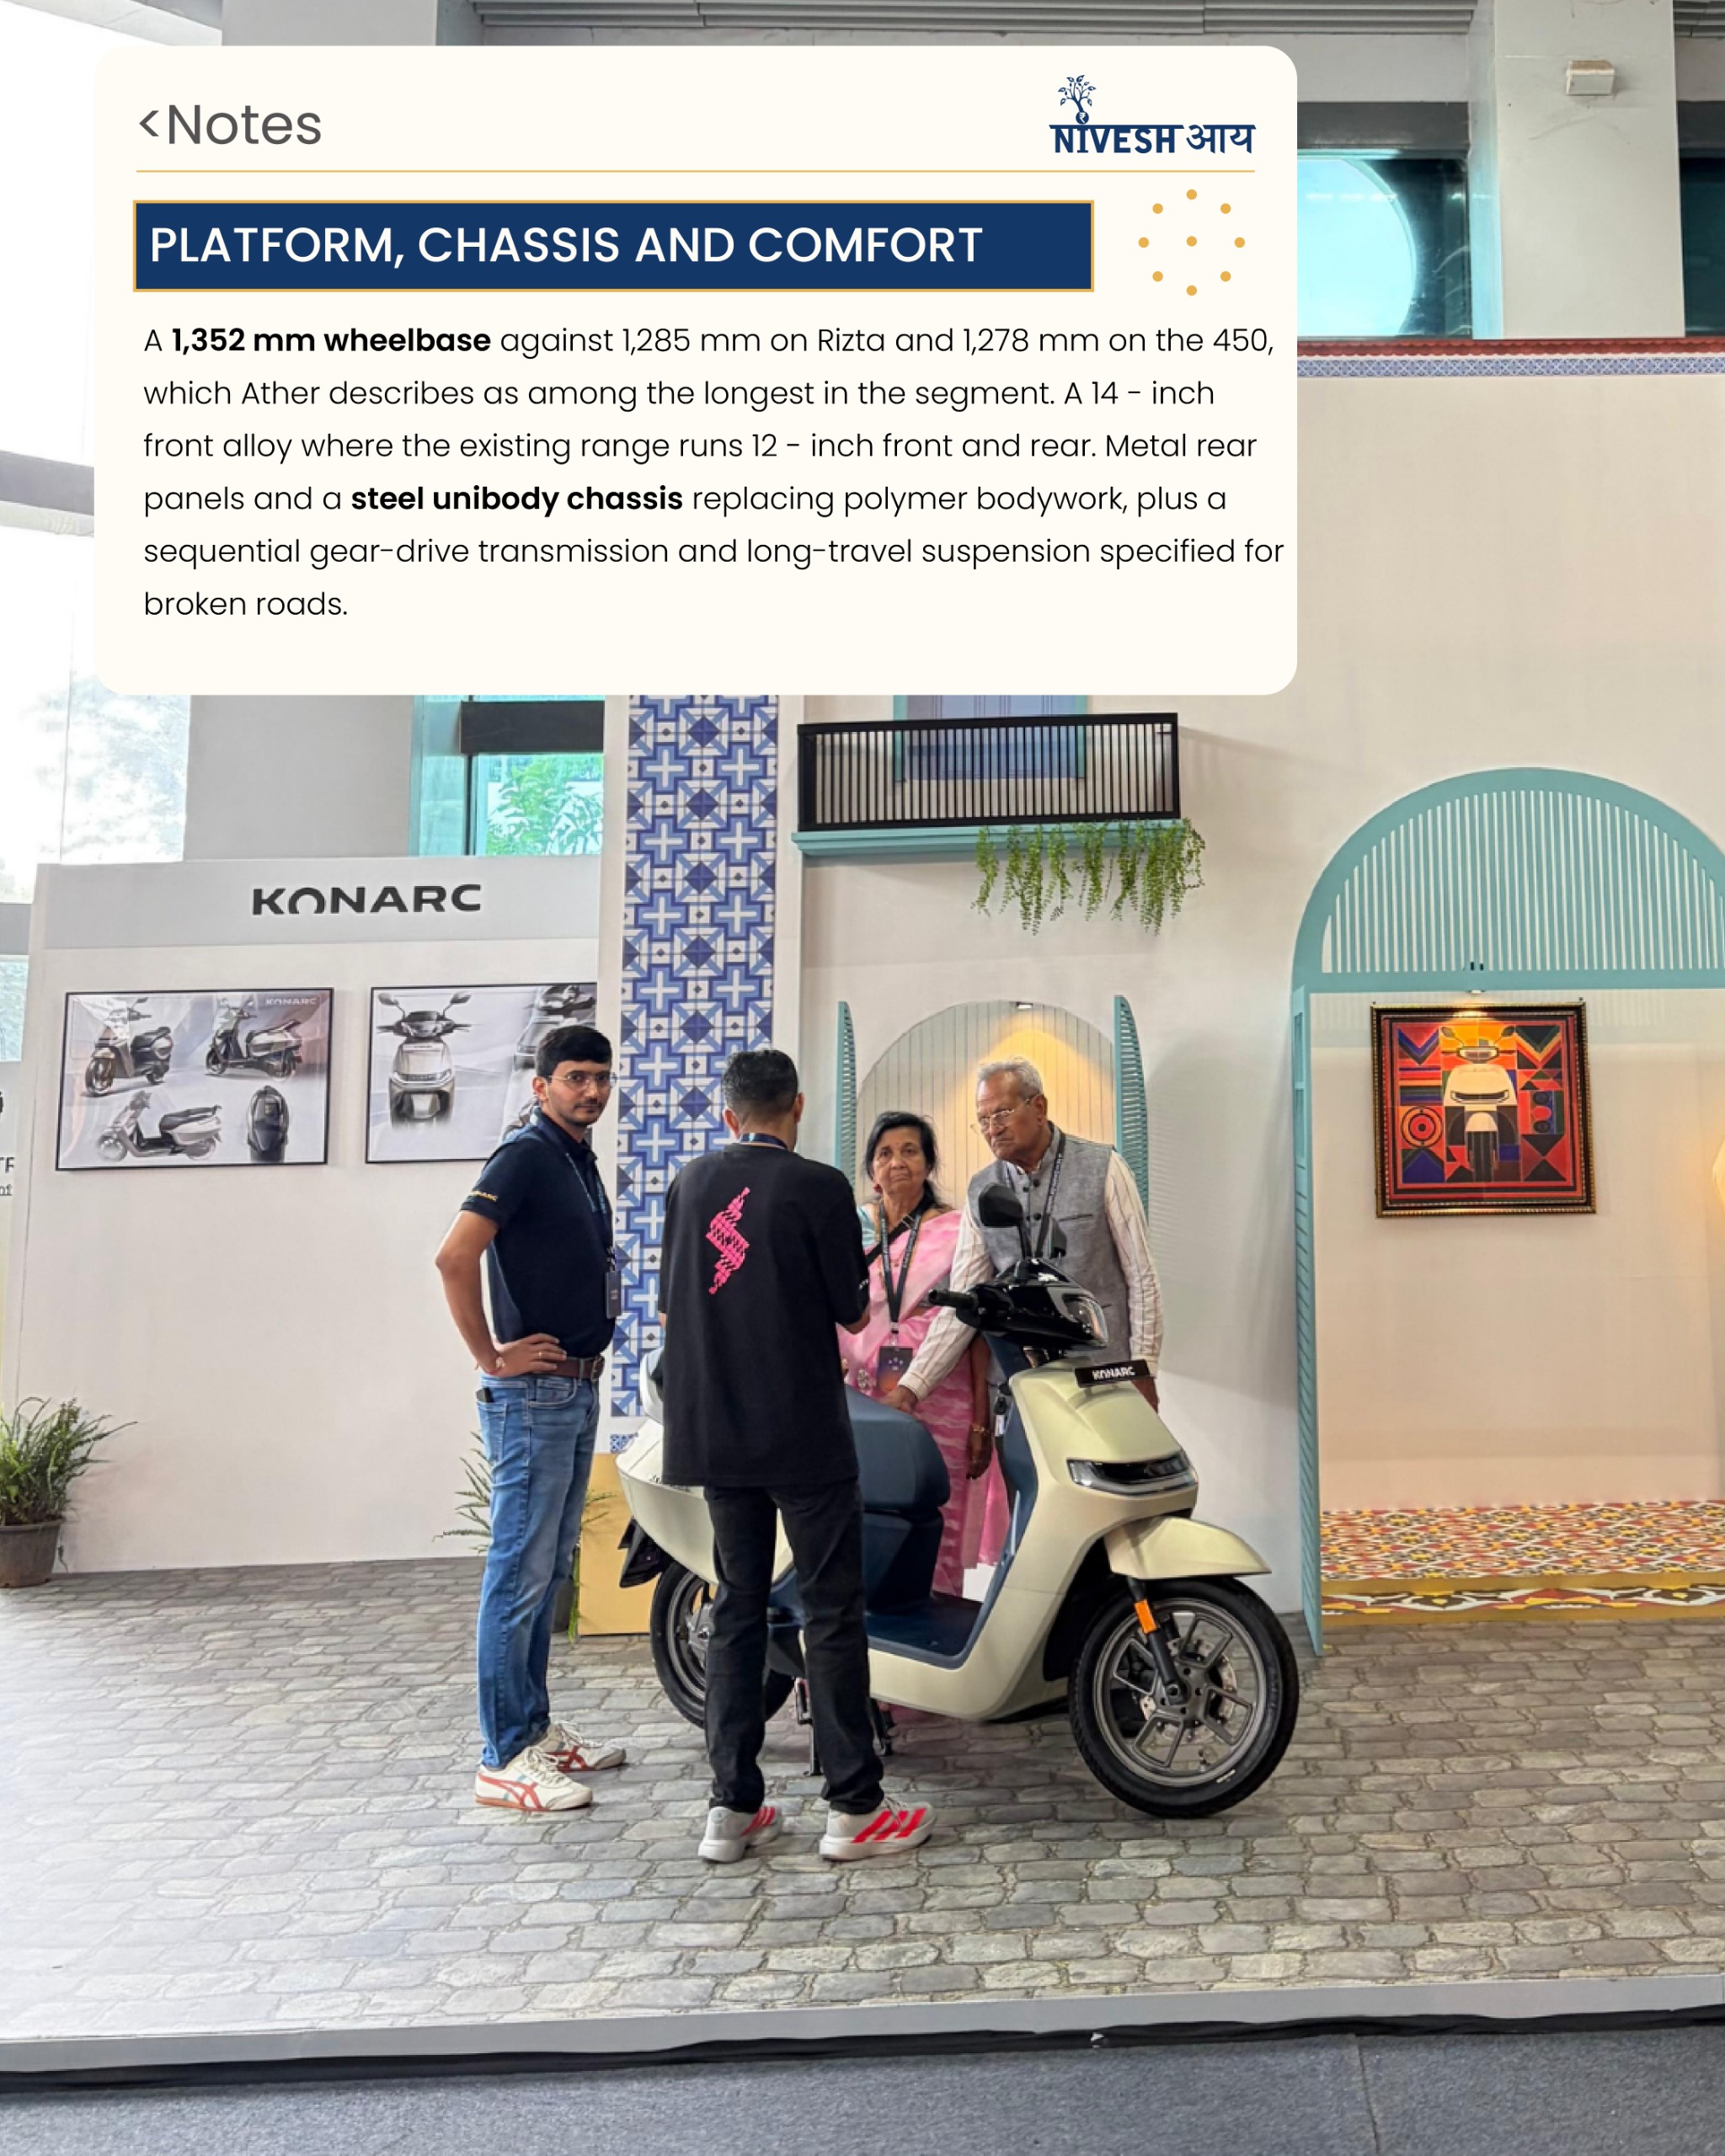
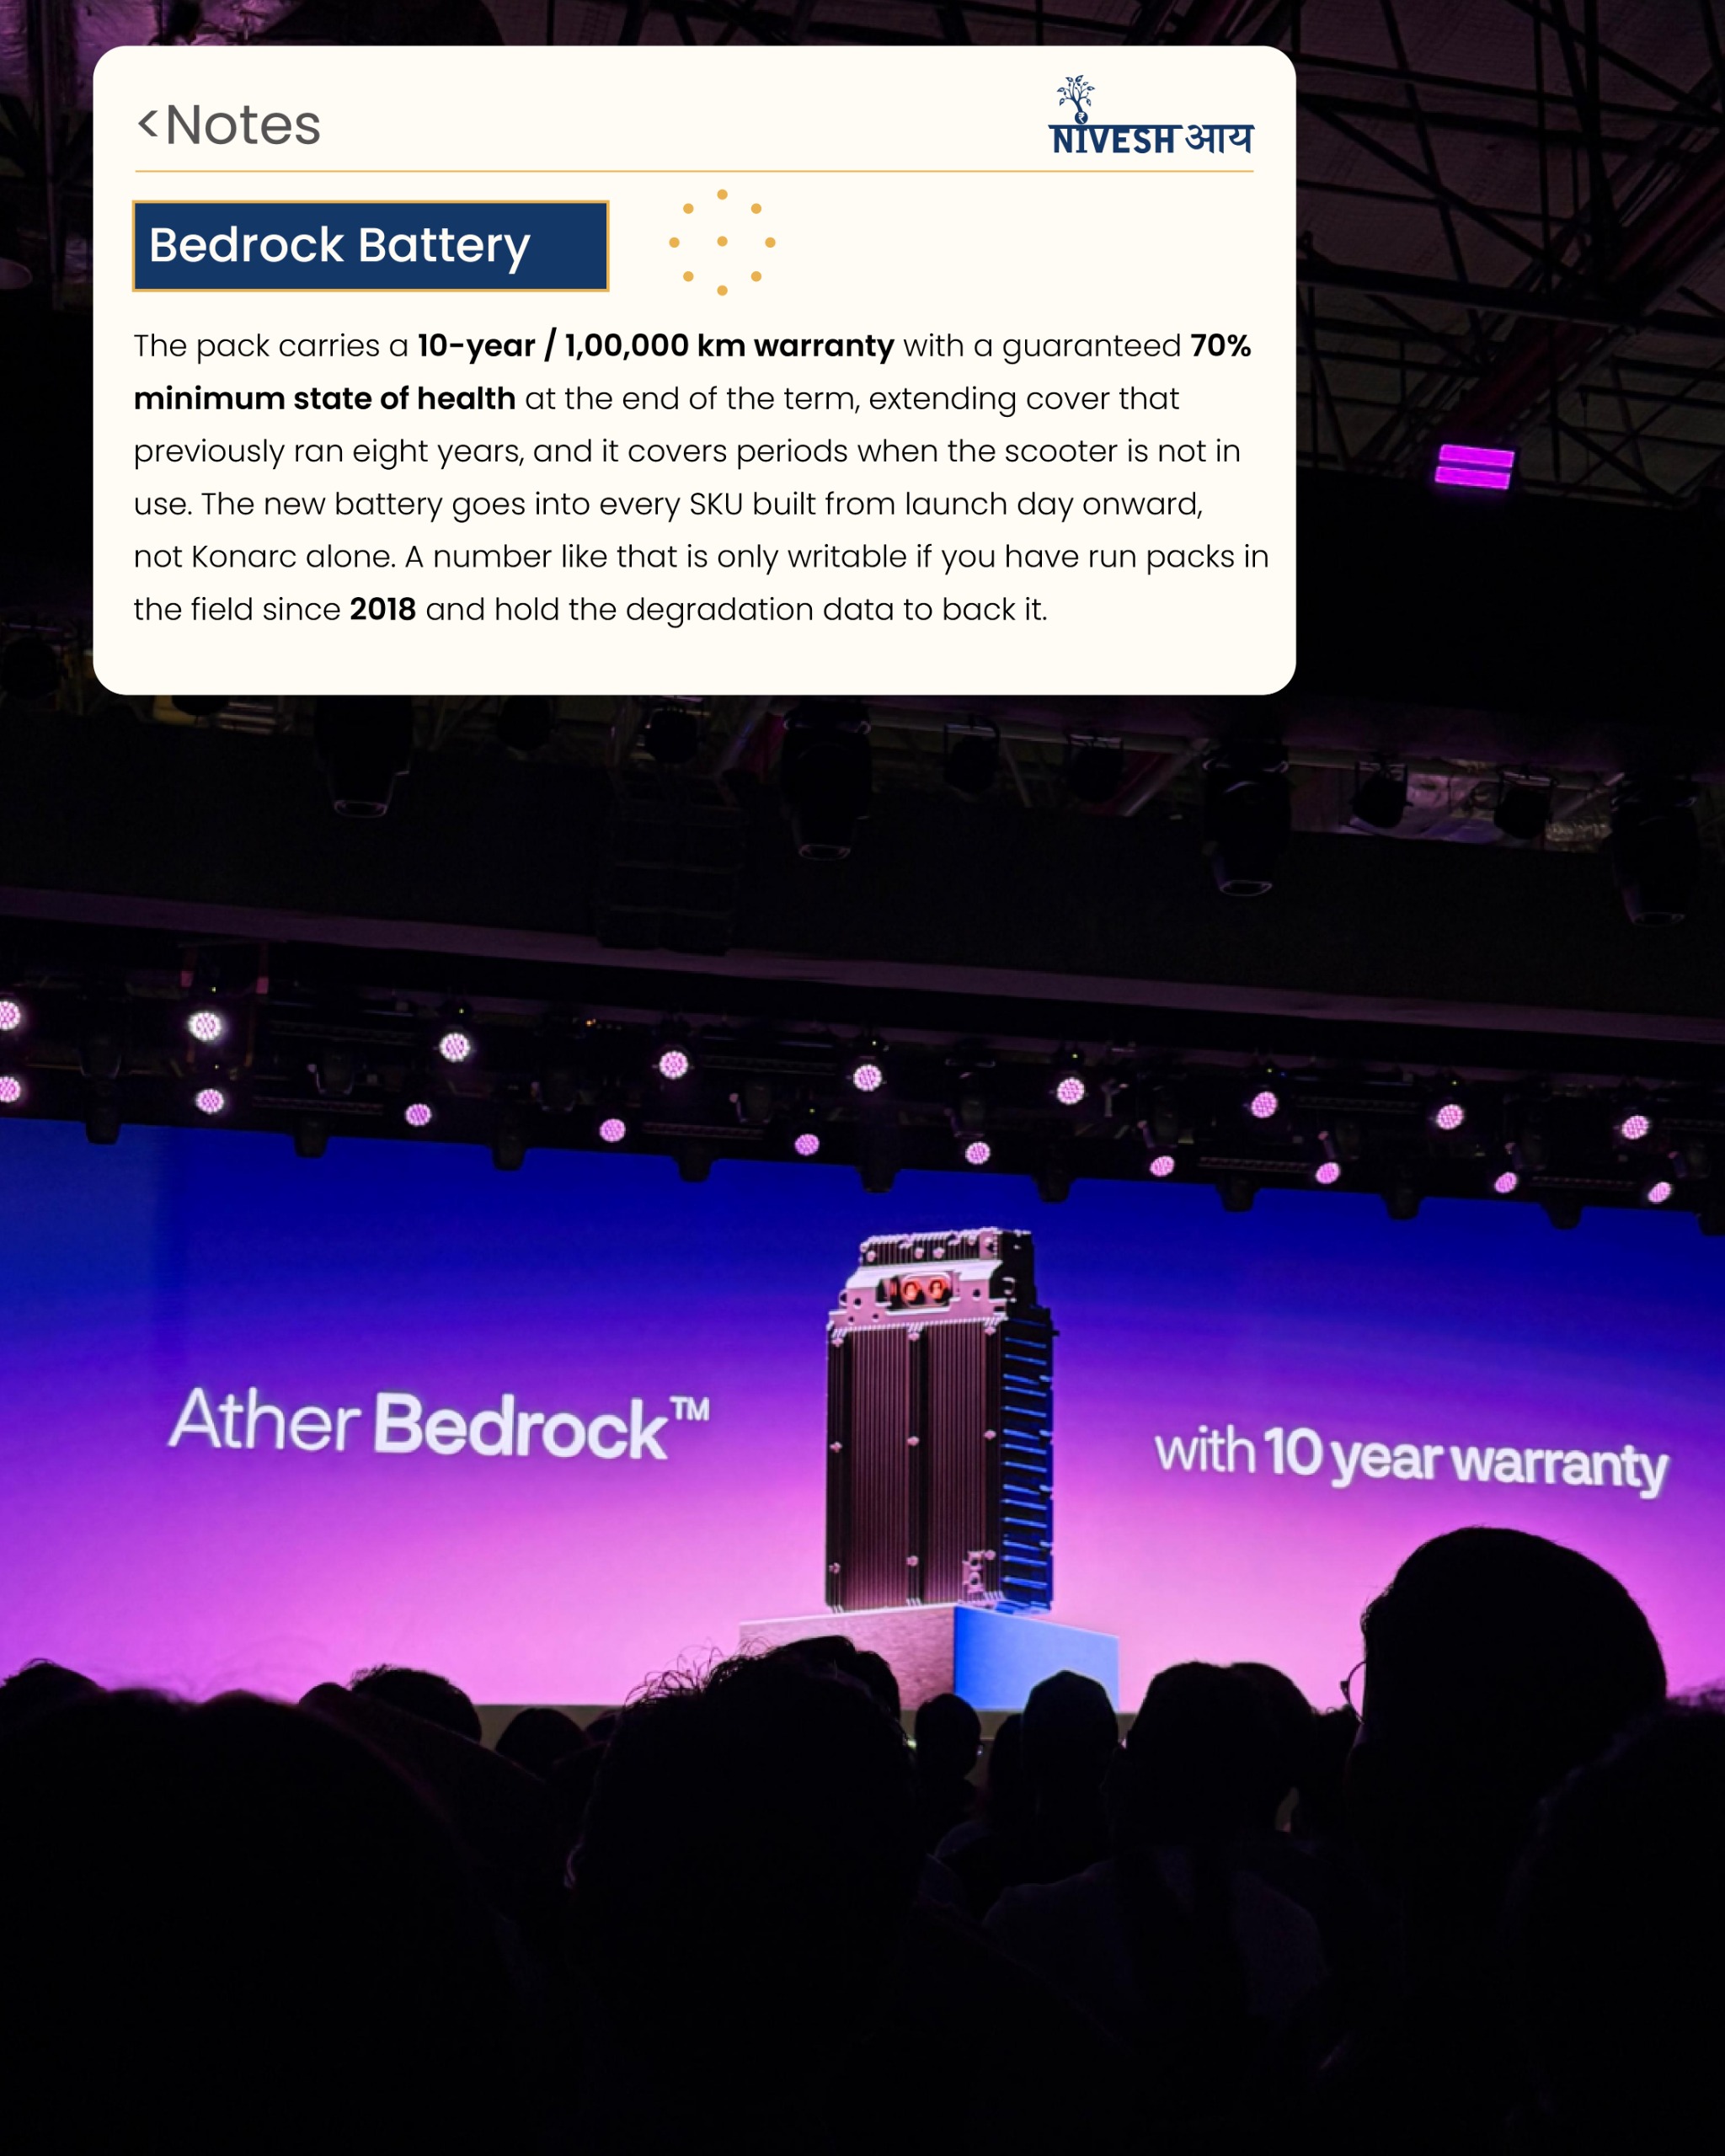

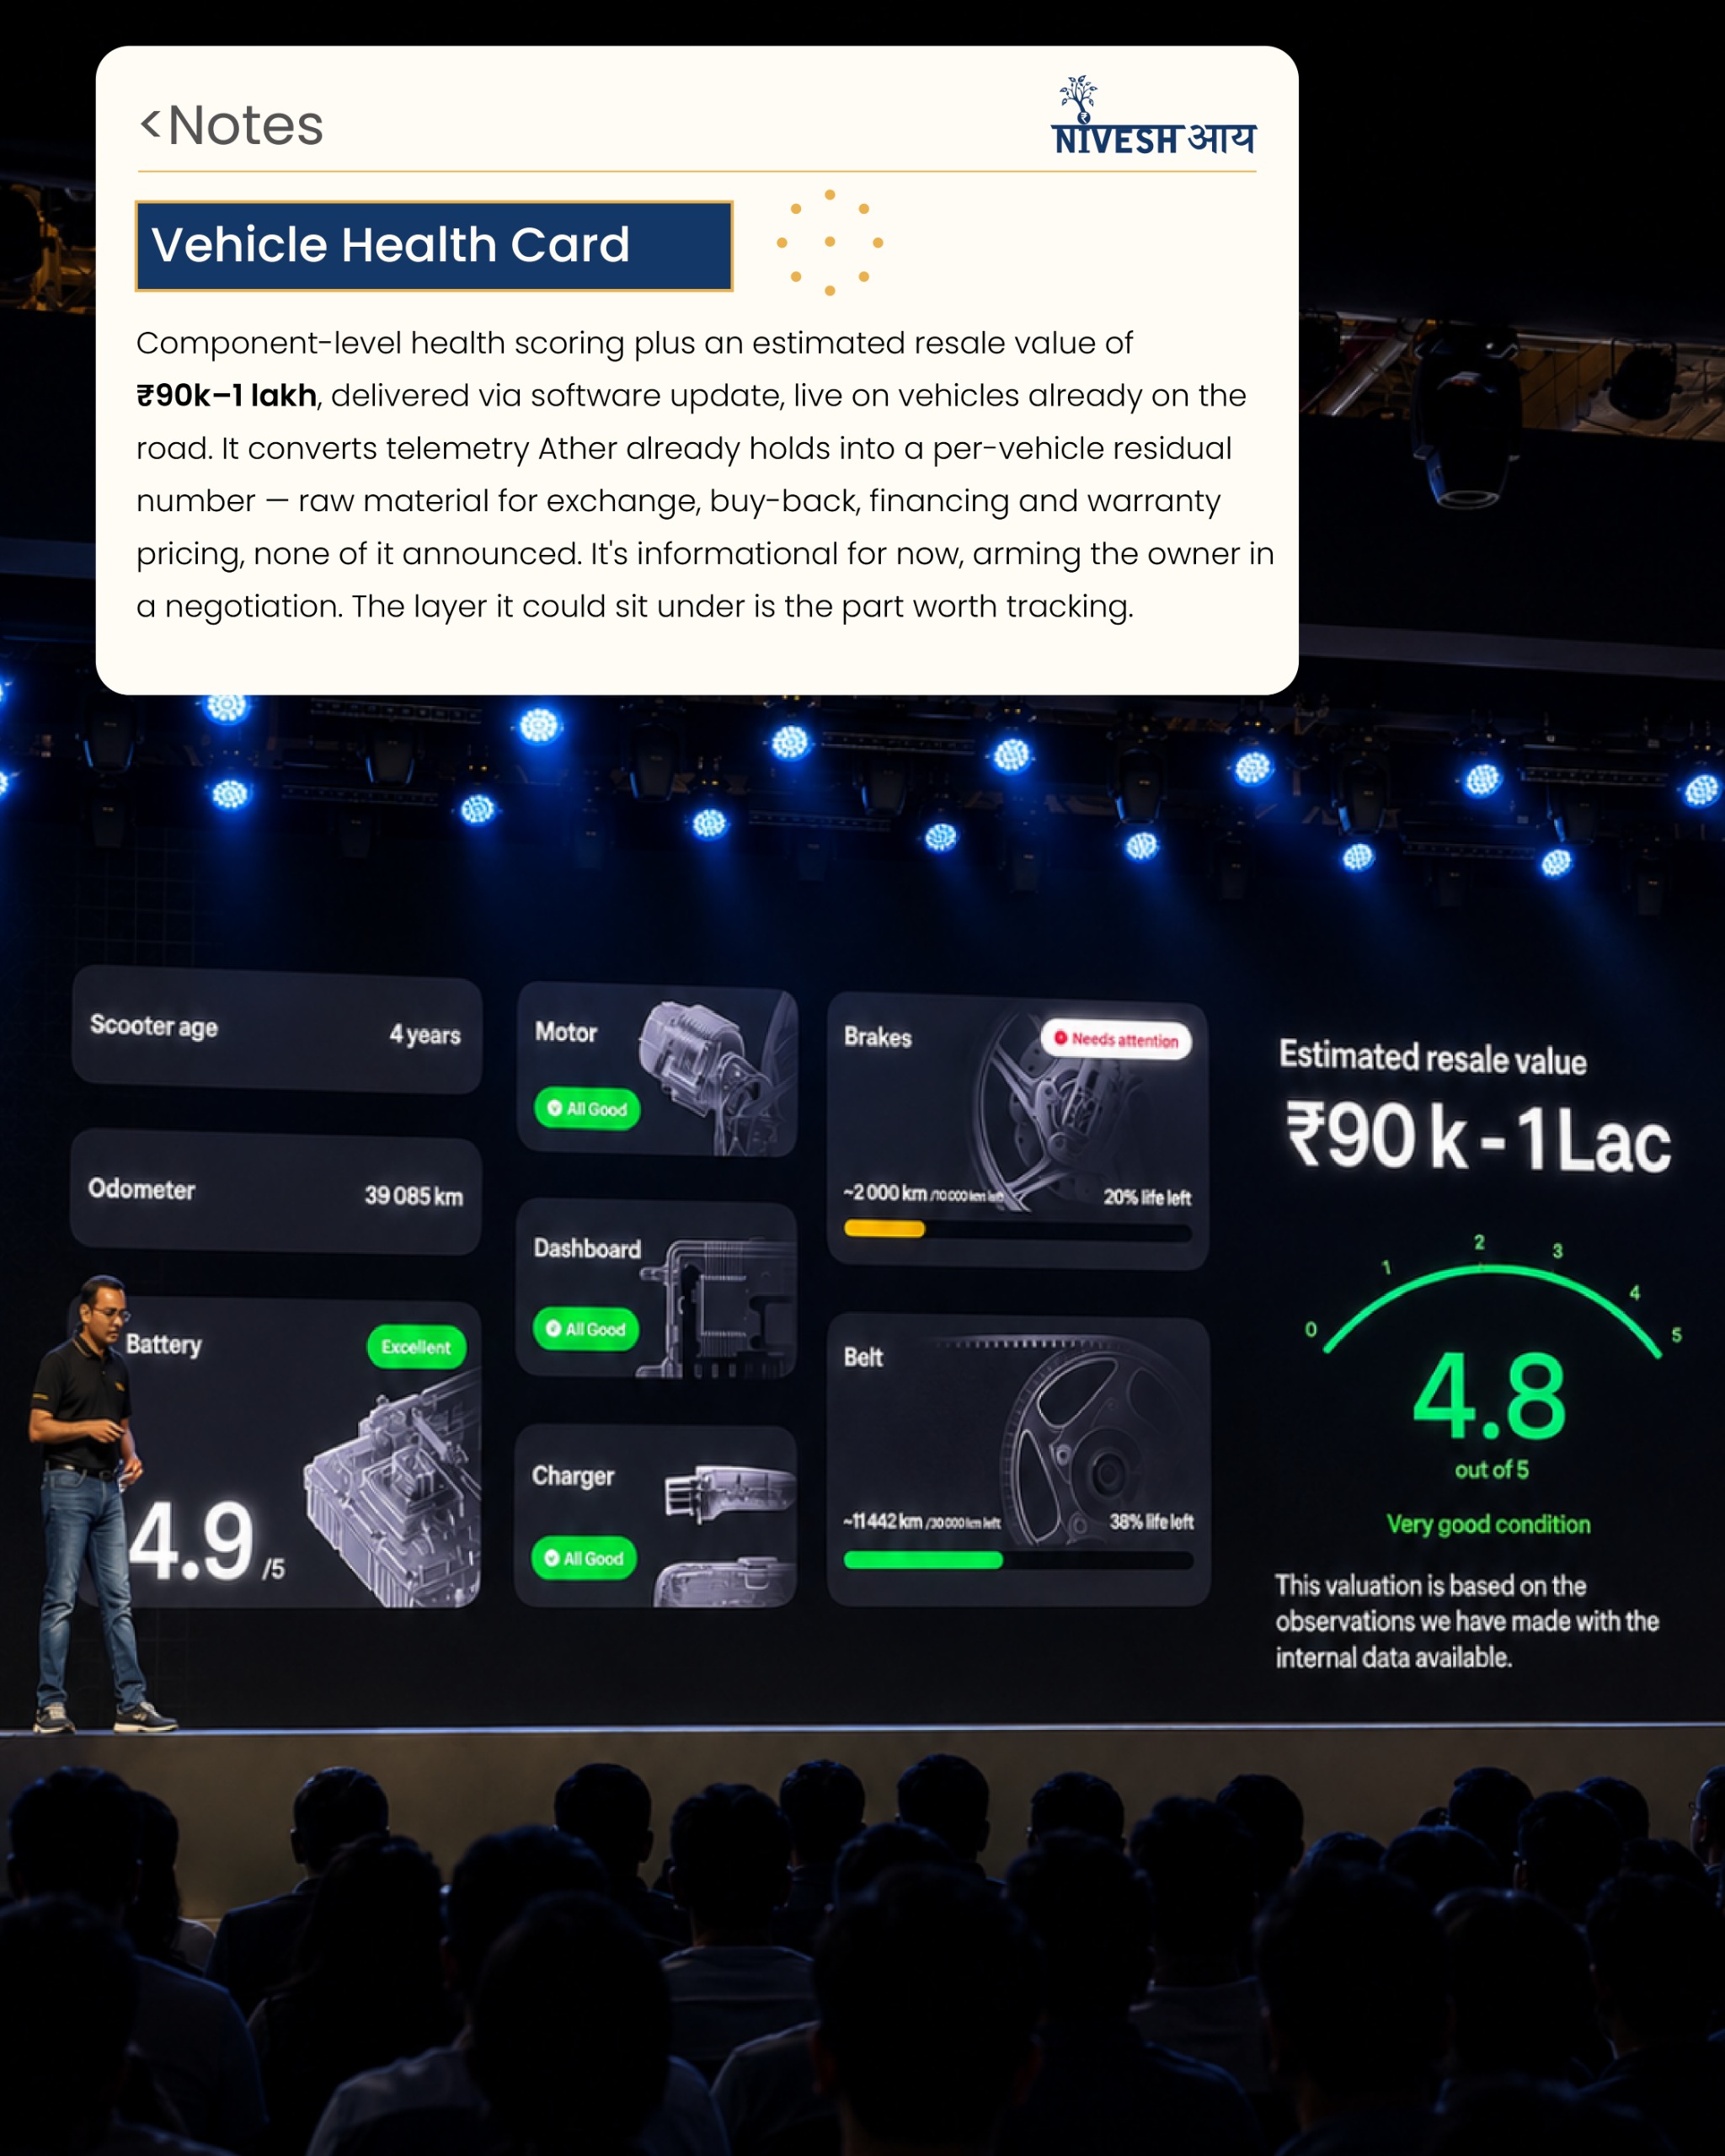
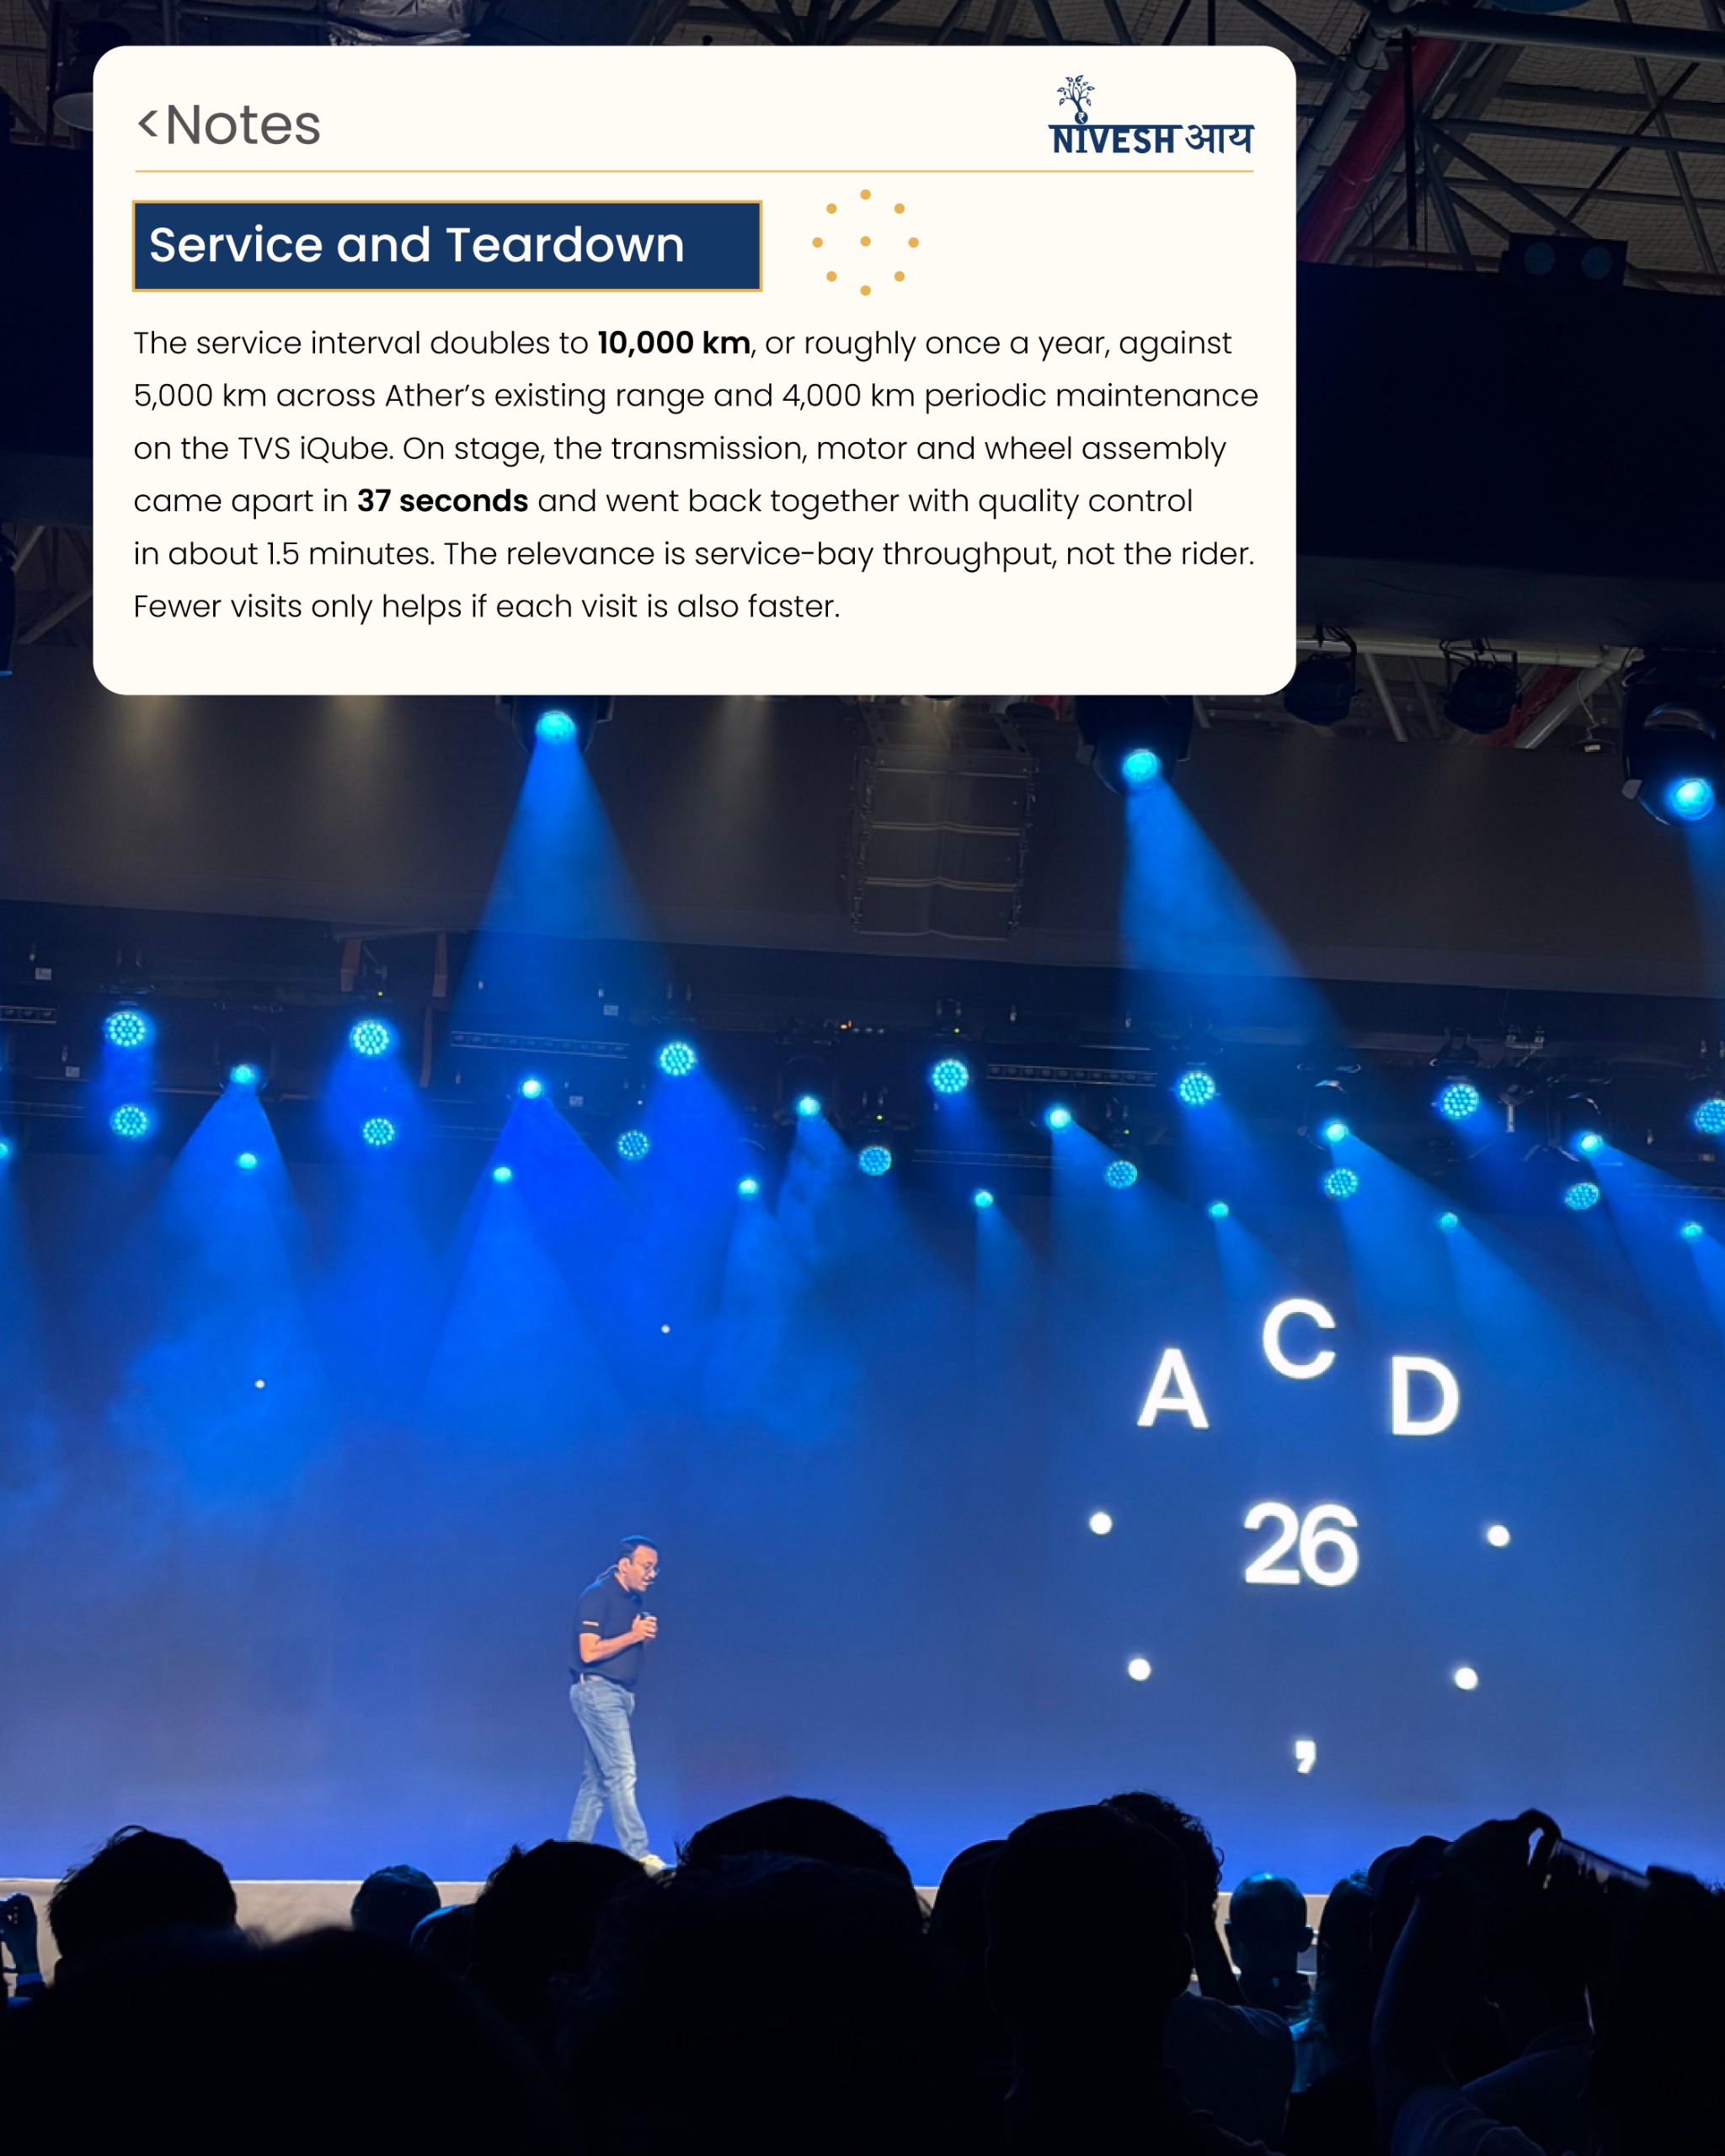
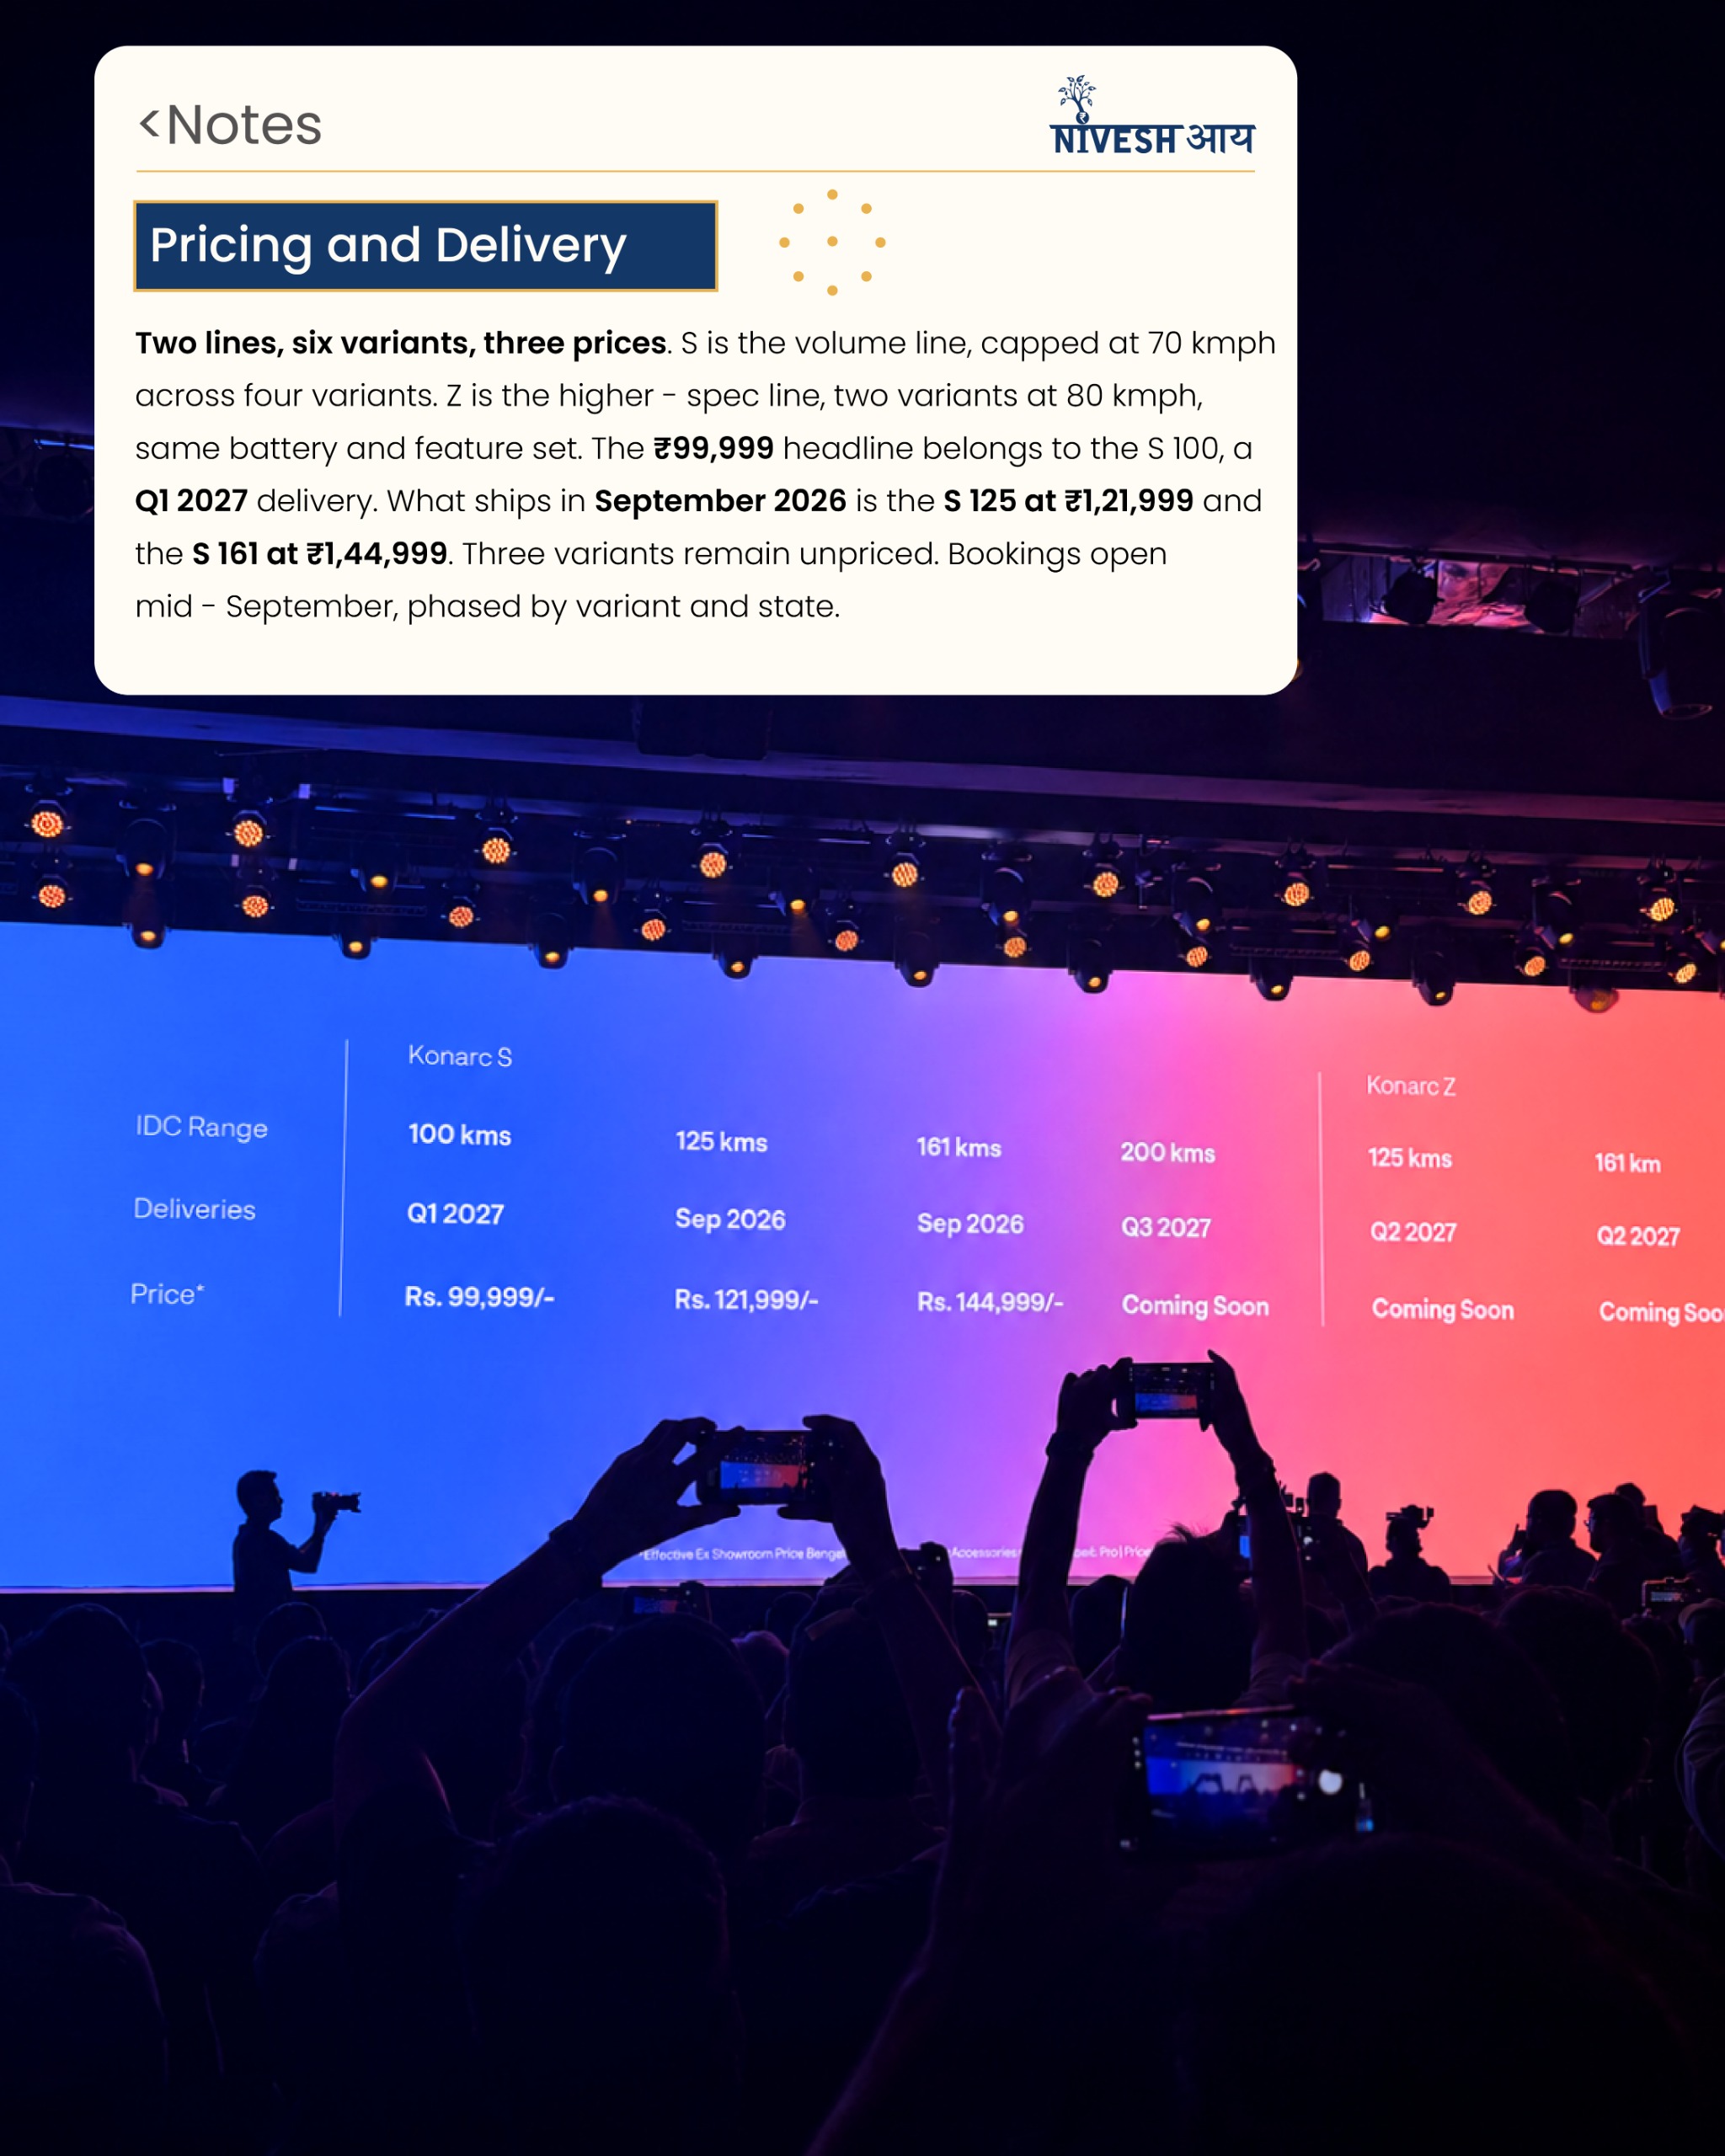
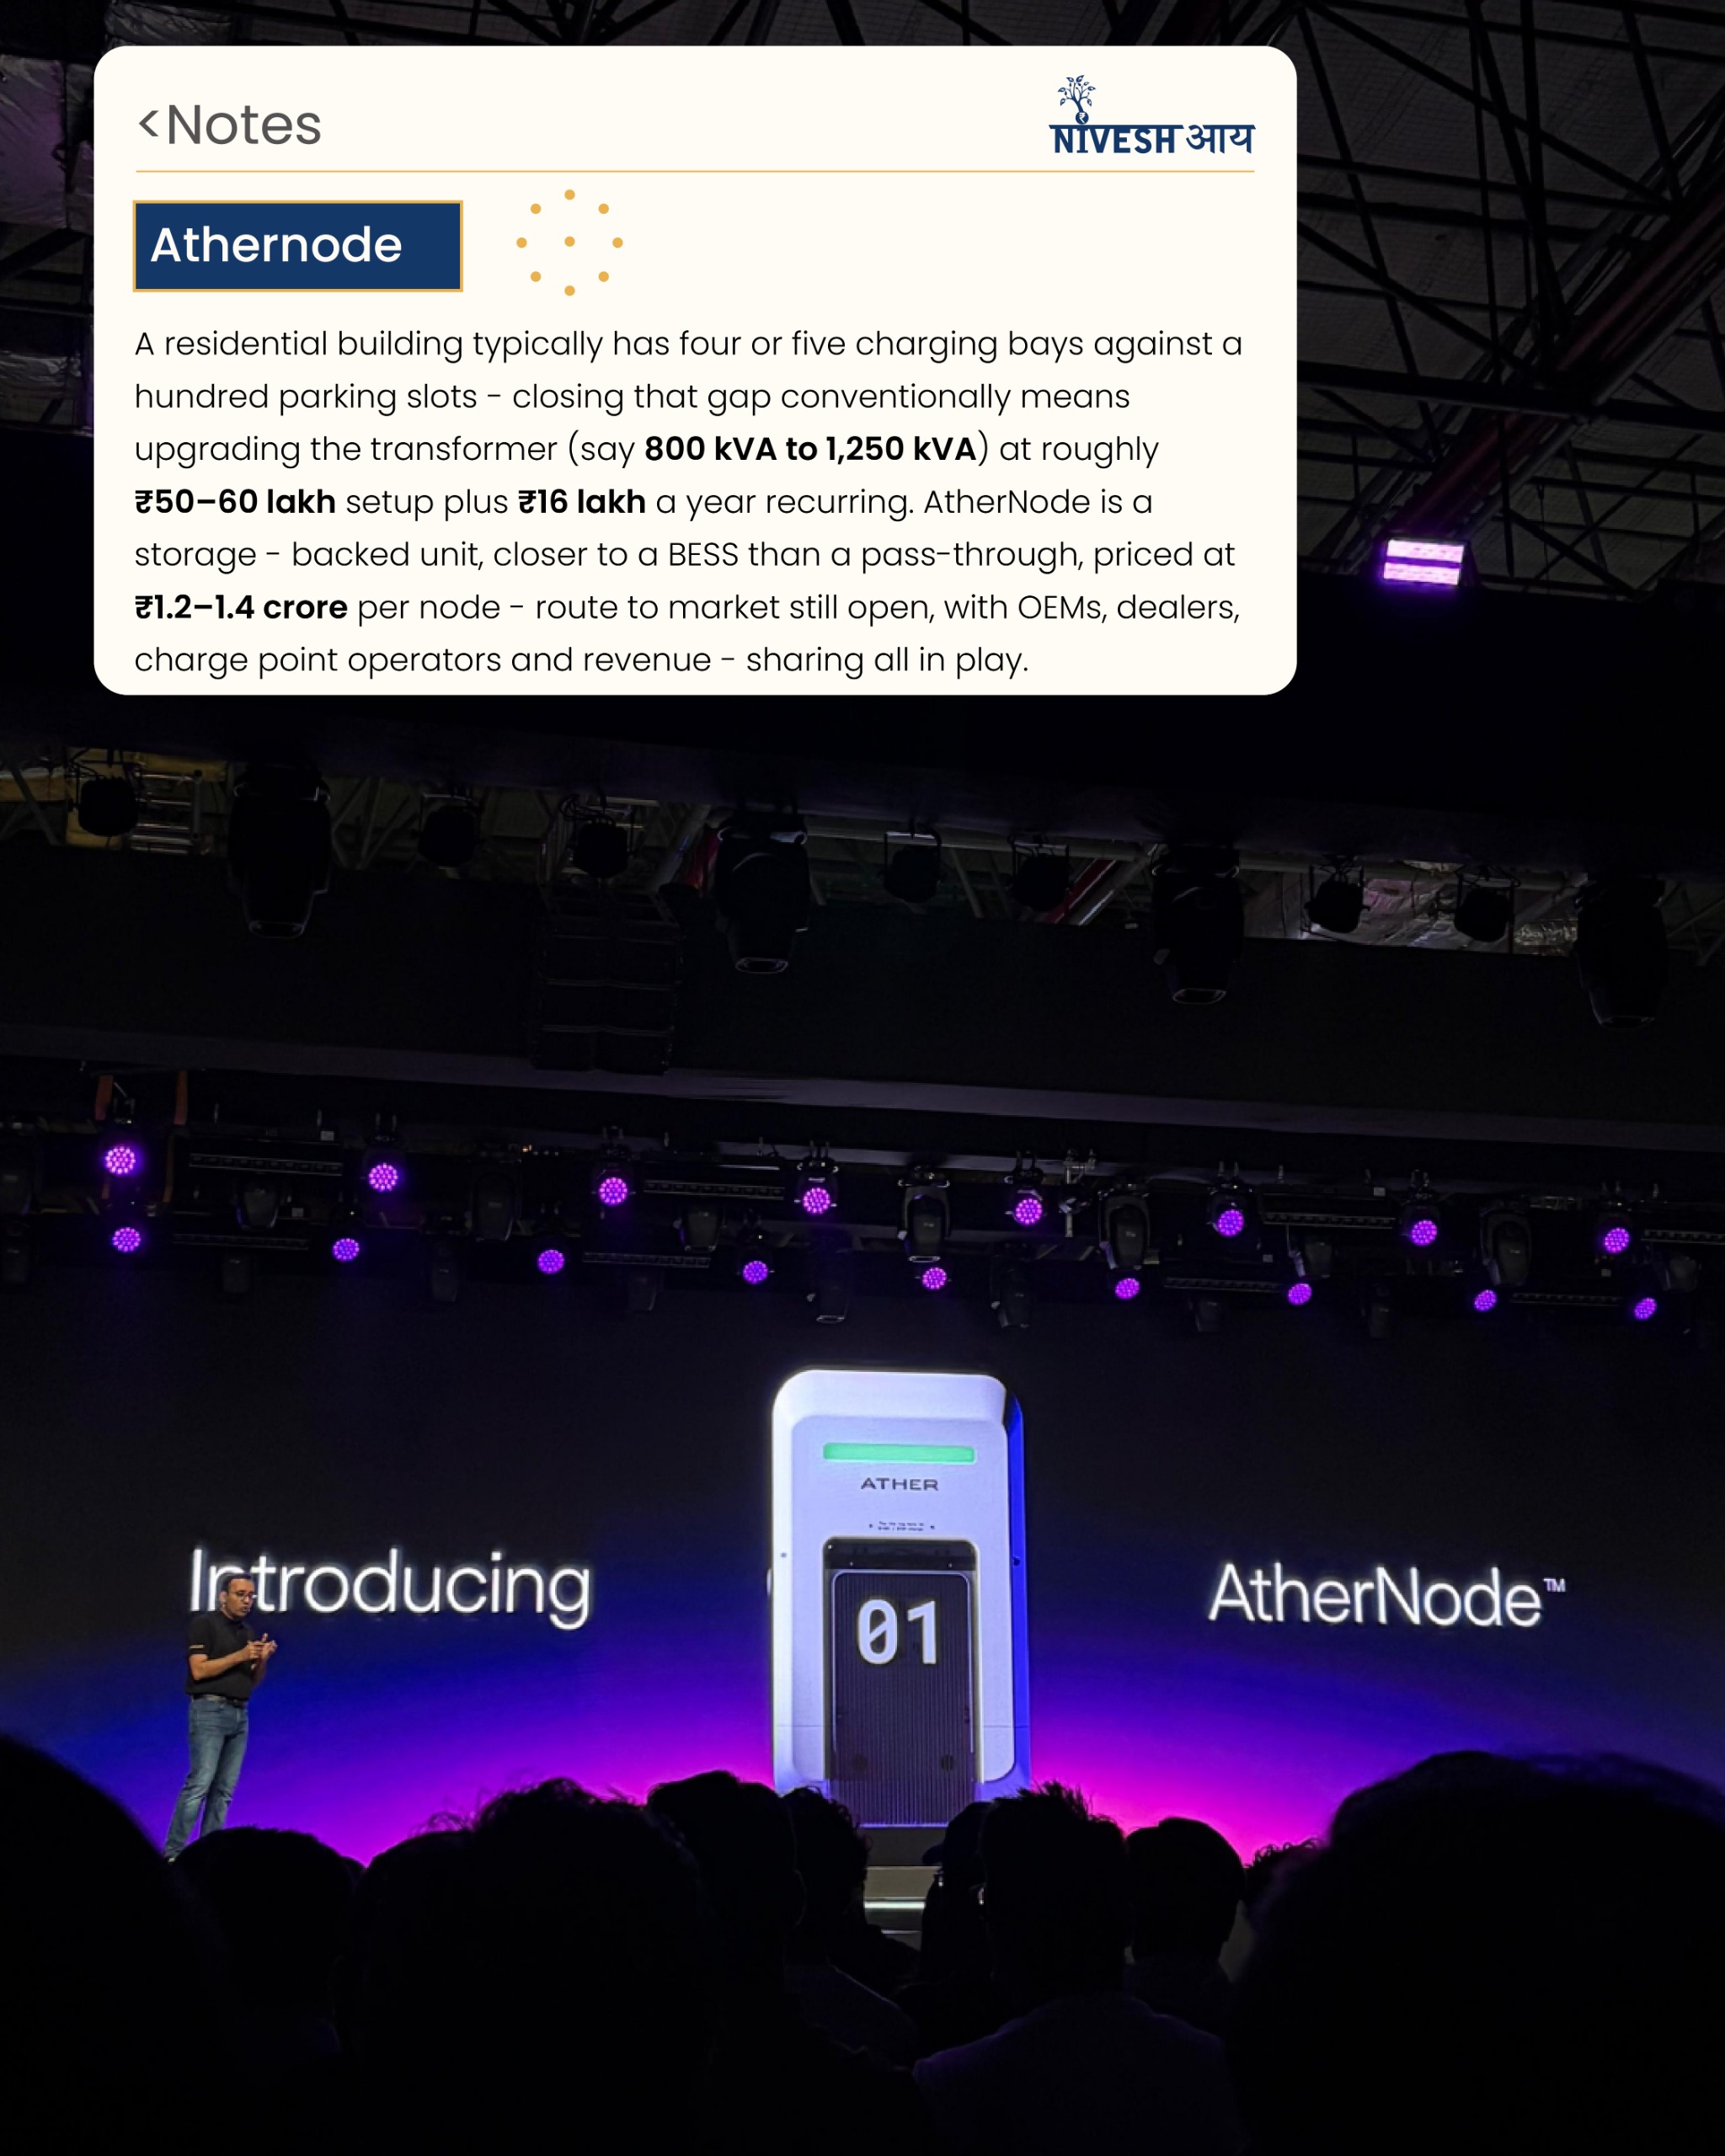
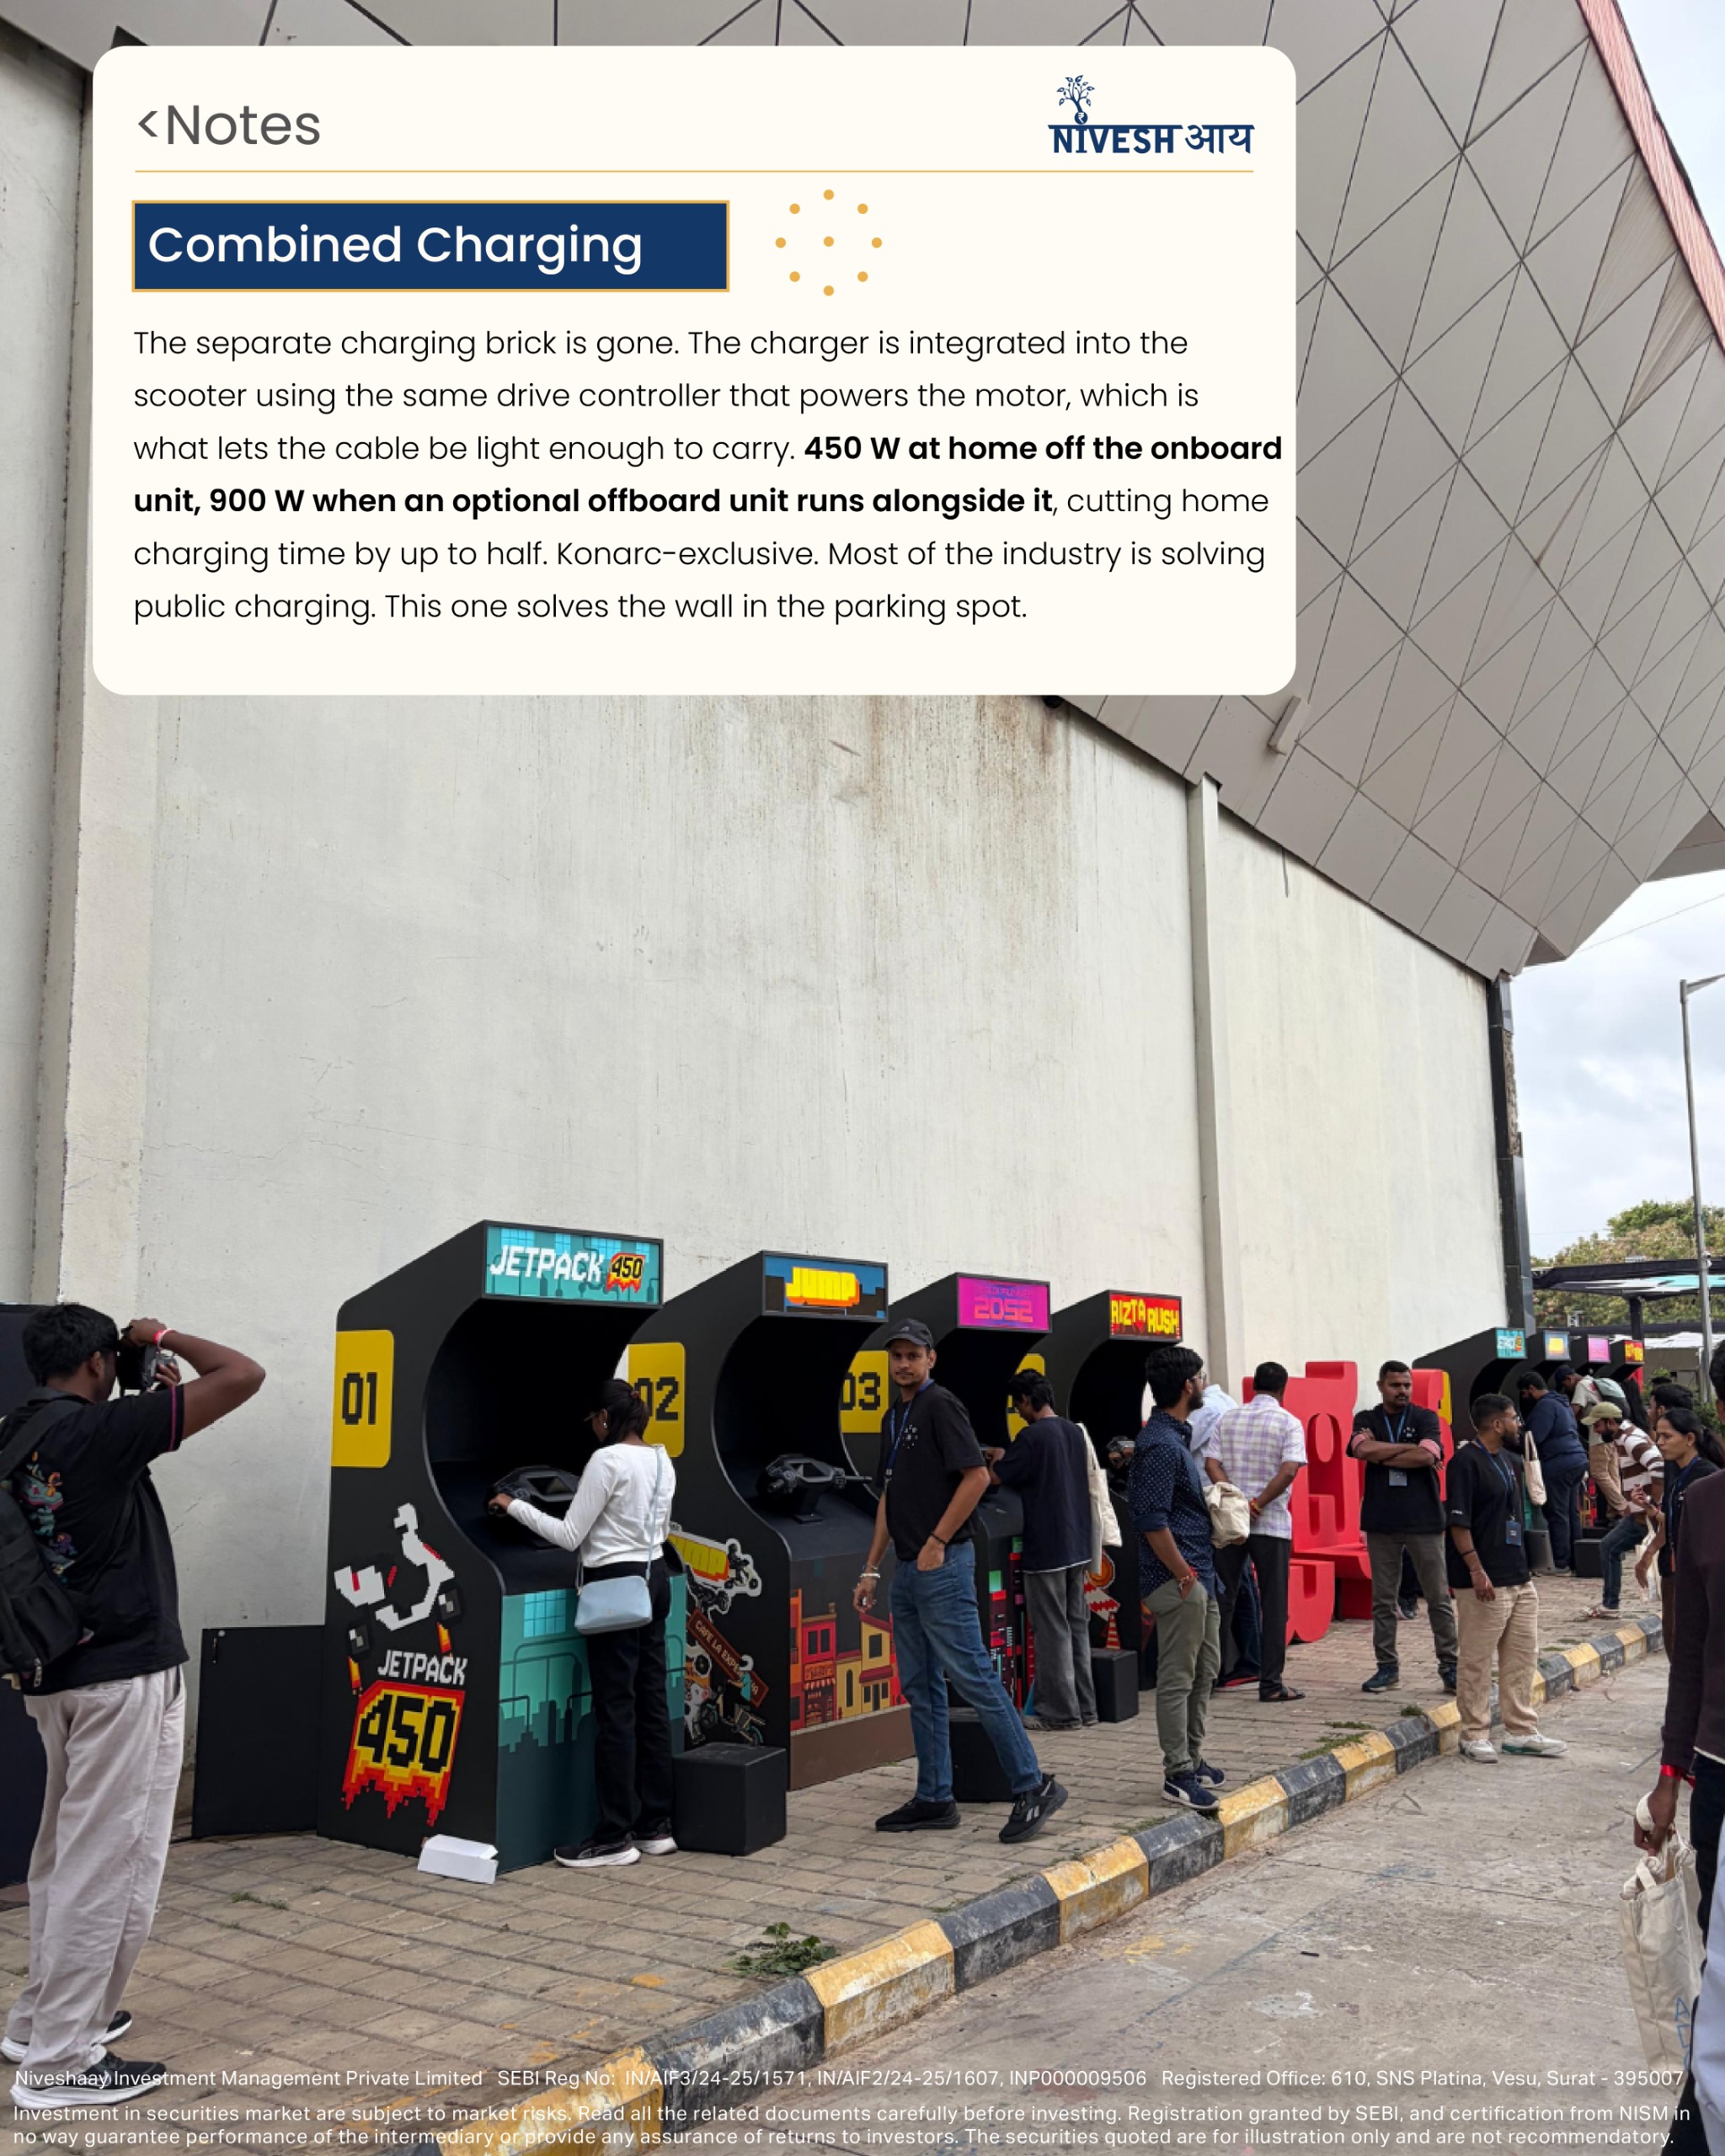
Ather didn’t just drop a new scooter – they dropped a blueprint. ⚡️
Few things most people missed from Ather Community Day:
1) No charging brick: The charger is literally integrated inside the scooter now.
2) 37-second teardown: Built to clear service bays before the coffee gets cold.⏱️
3) Resale score on your dash: Live telemetry turning your scooter into negotiating power.📊
4) 10-Year / 1,00,000 km warranty: Backed by 8 years of raw field data.🛡️
5) AtherNode: Solving the apartment parking charging wall.⚡
The scooter is the product – the platform is the strategy.
📍On Ground Research | Niveshaay

AI & Data Center
Niveshaay-Backed ESDS Software Solutions Lists on NSE
From building India’s digital backbone to entering the capital markets, ESDS Software Solutions marks a significant milestone with its NSE listing. For Niveshaay and its investors, it reflects a journey that began well before cloud infrastructure became a mainstream investment theme.
From building India’s digital backbone to entering the capital markets, ESDS Software Solutions marks a significant milestone with its NSE listing. For Niveshaay and its investors, it reflects a journey that began well before cloud infrastructure became a mainstream investment theme.

AI & Data Center
Make in India : What the headline doesn’t show
Make in India. Grid. Aerospace. Storage. Semiconductors. Everyone sees the headline. The real story lies a layer deeper.
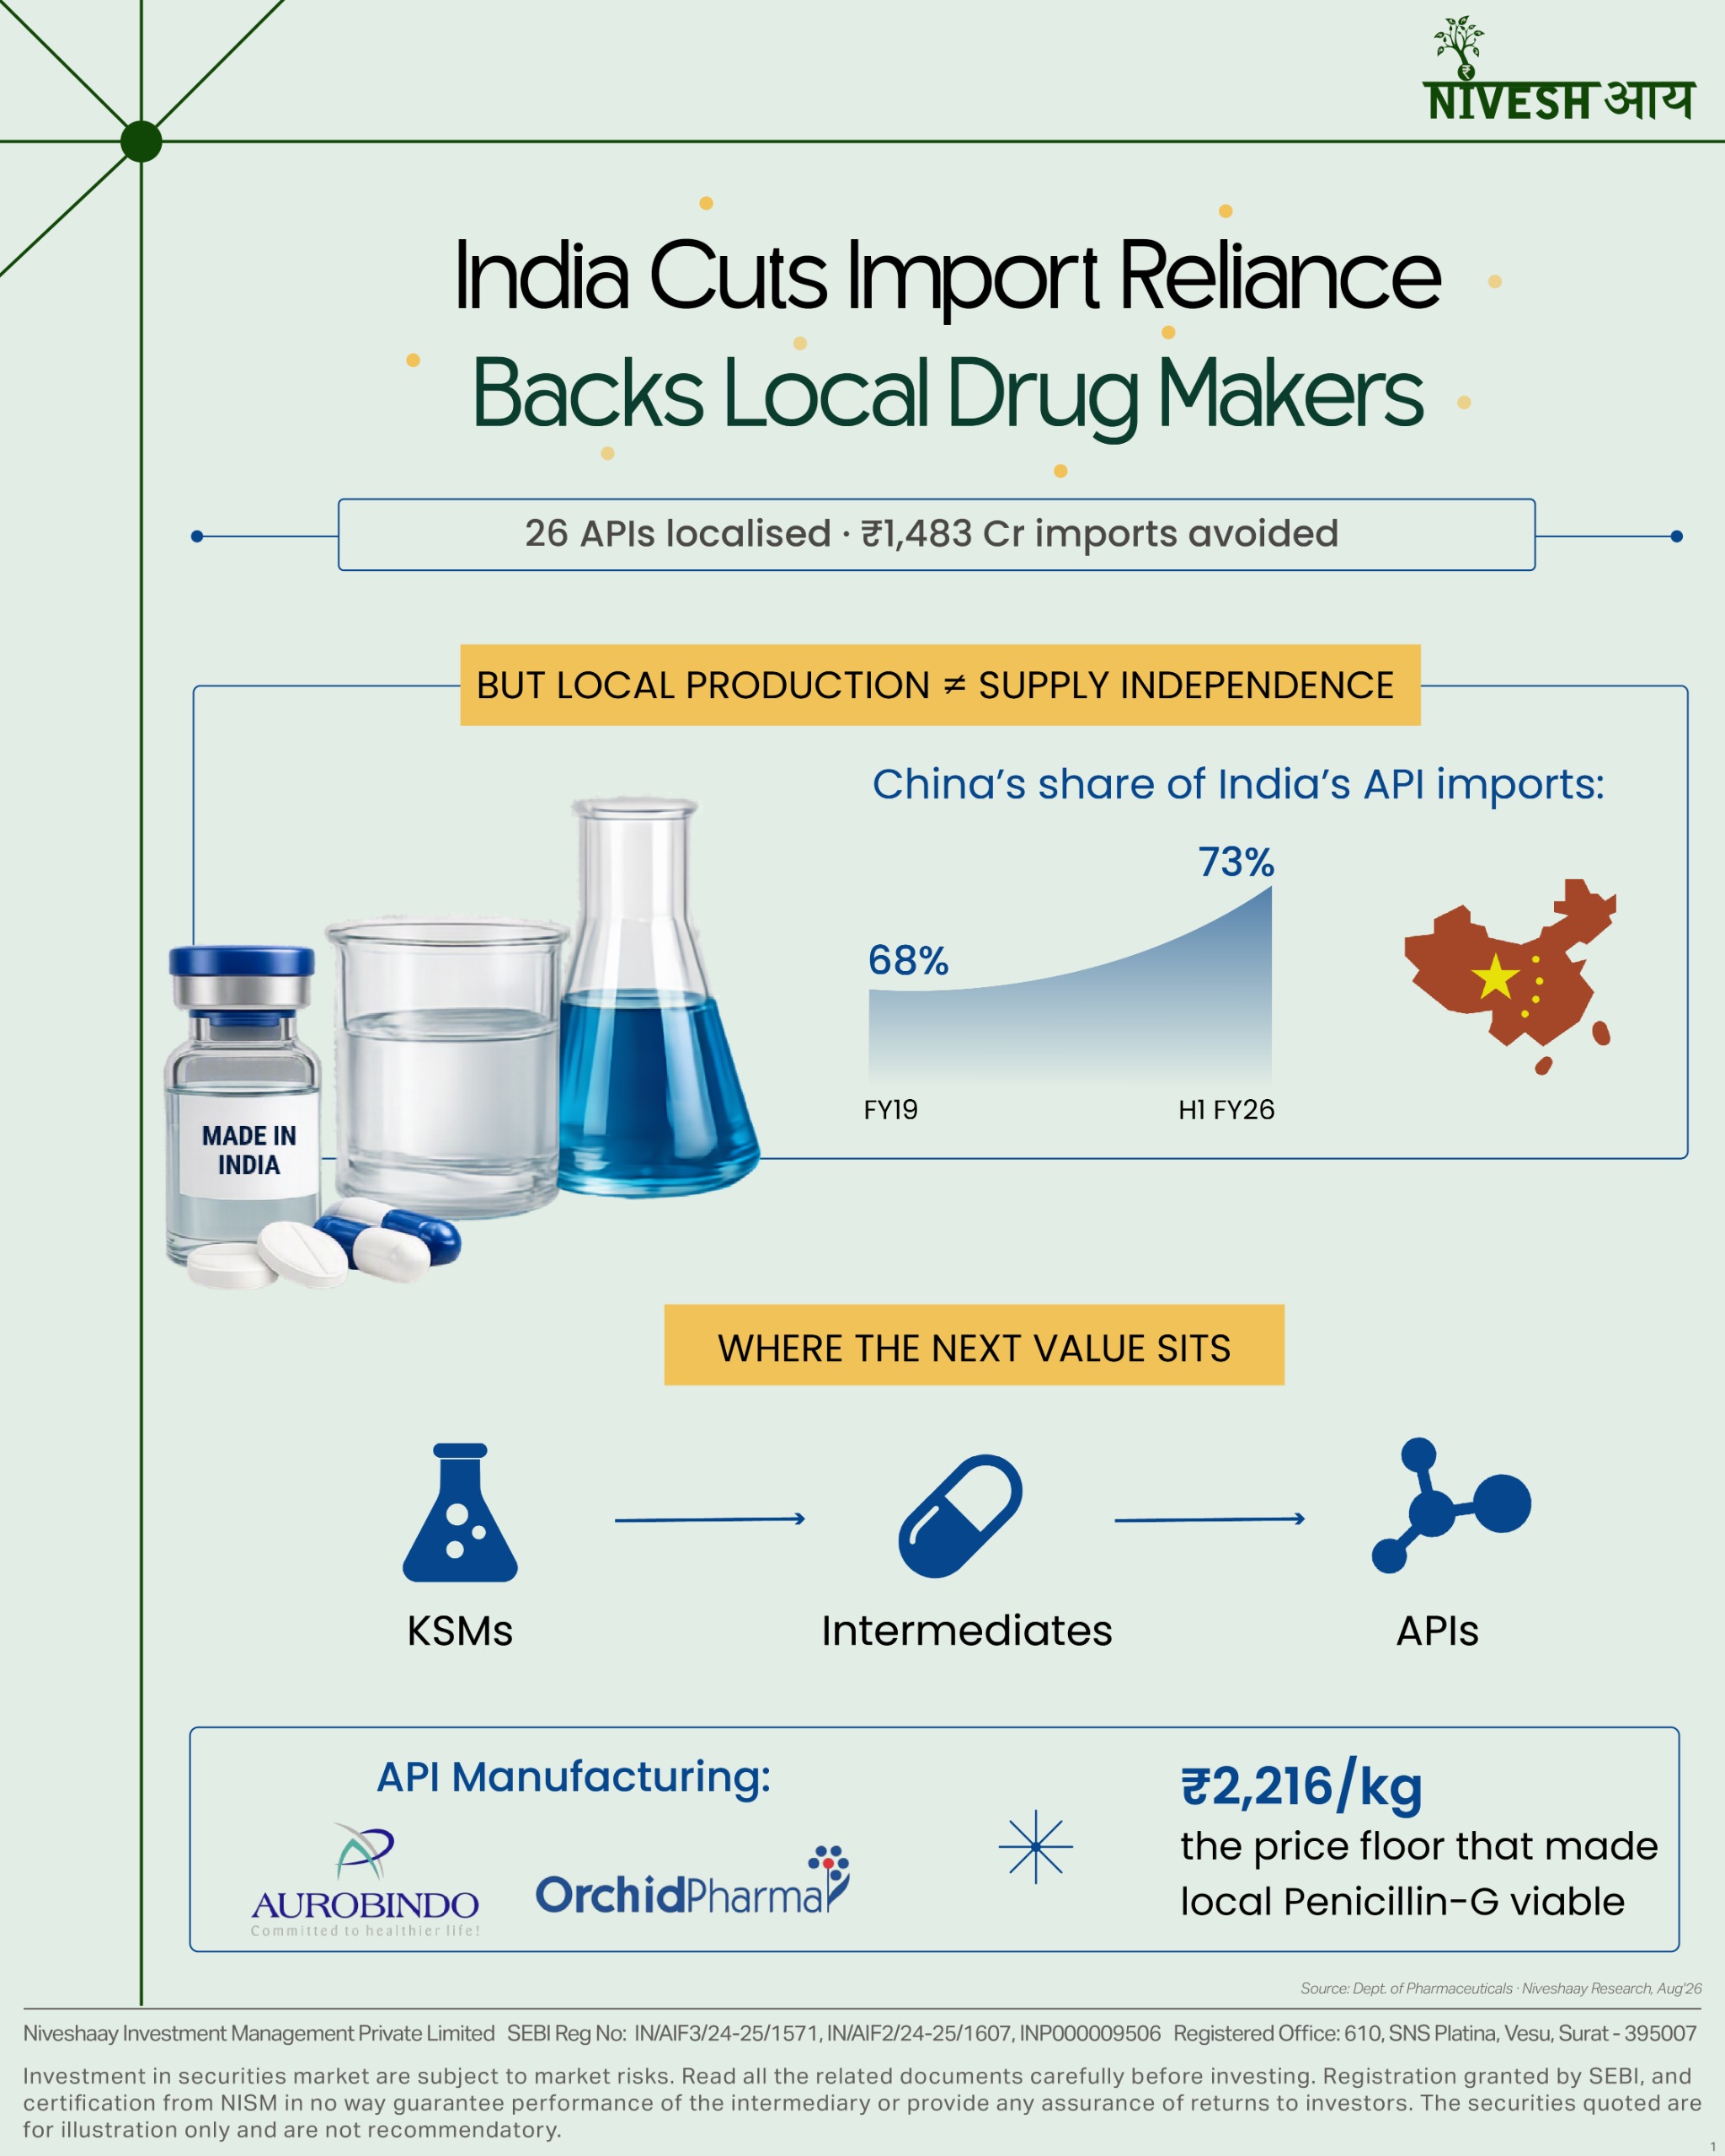
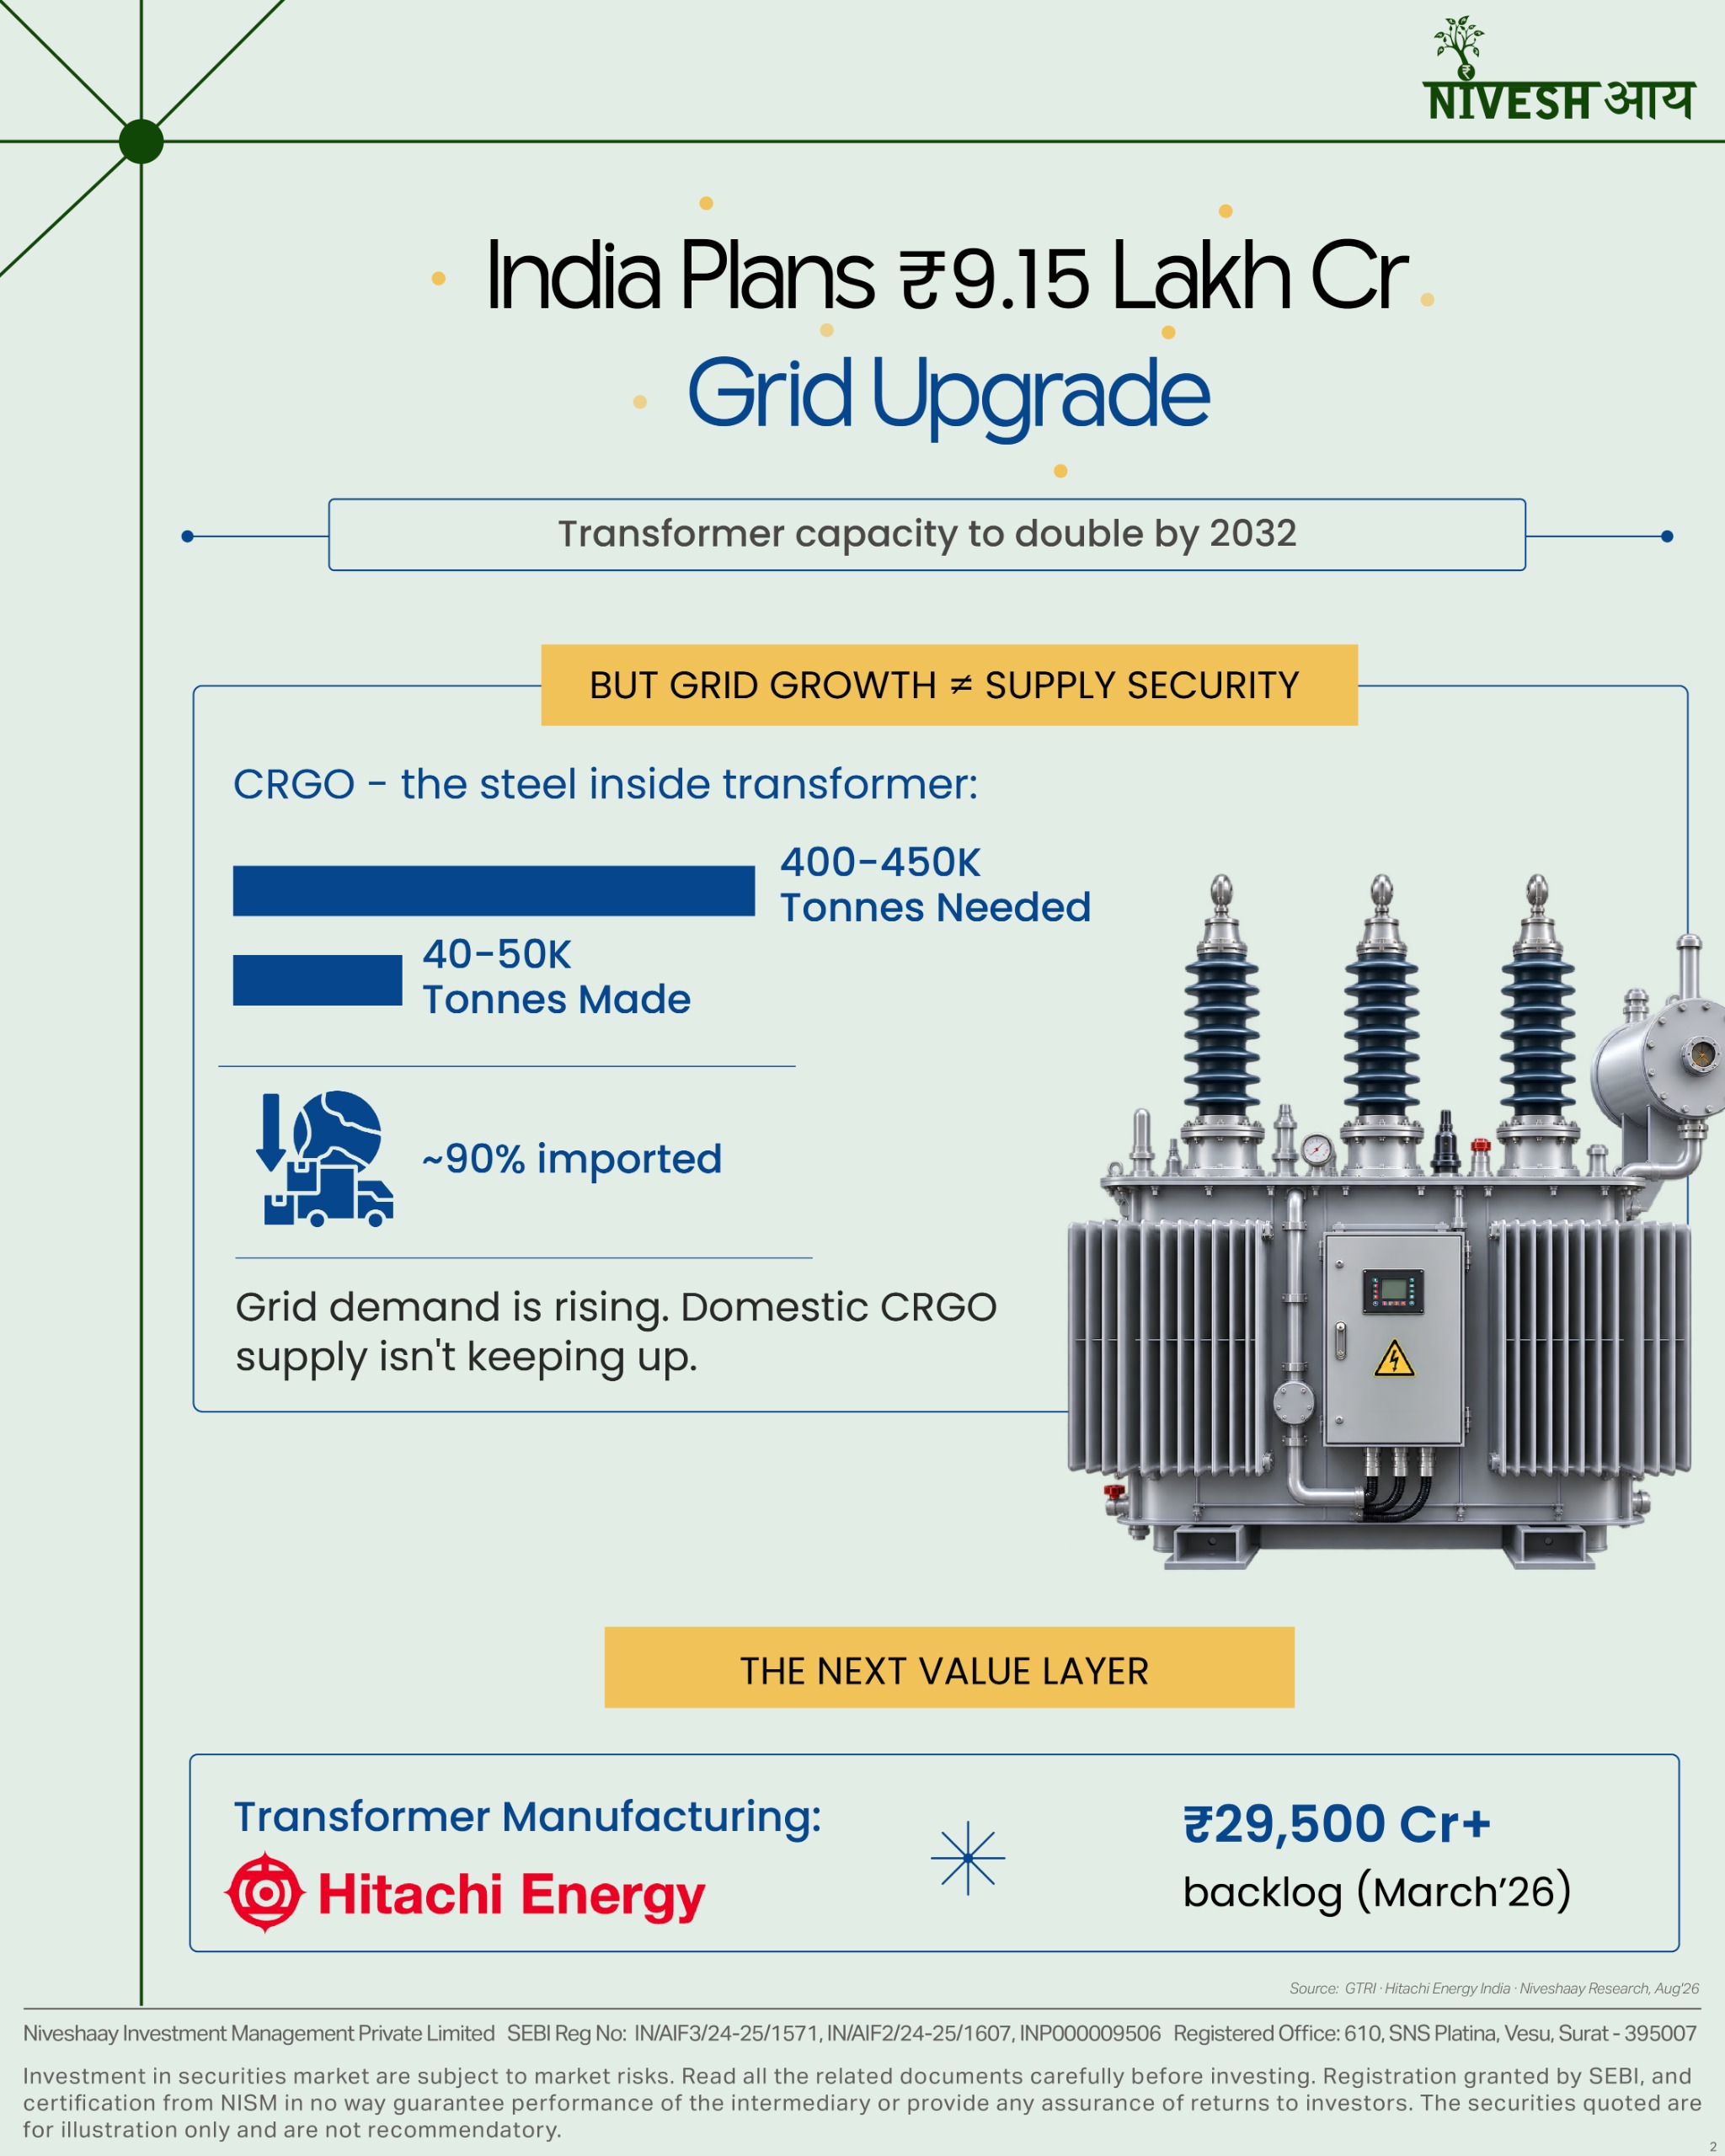
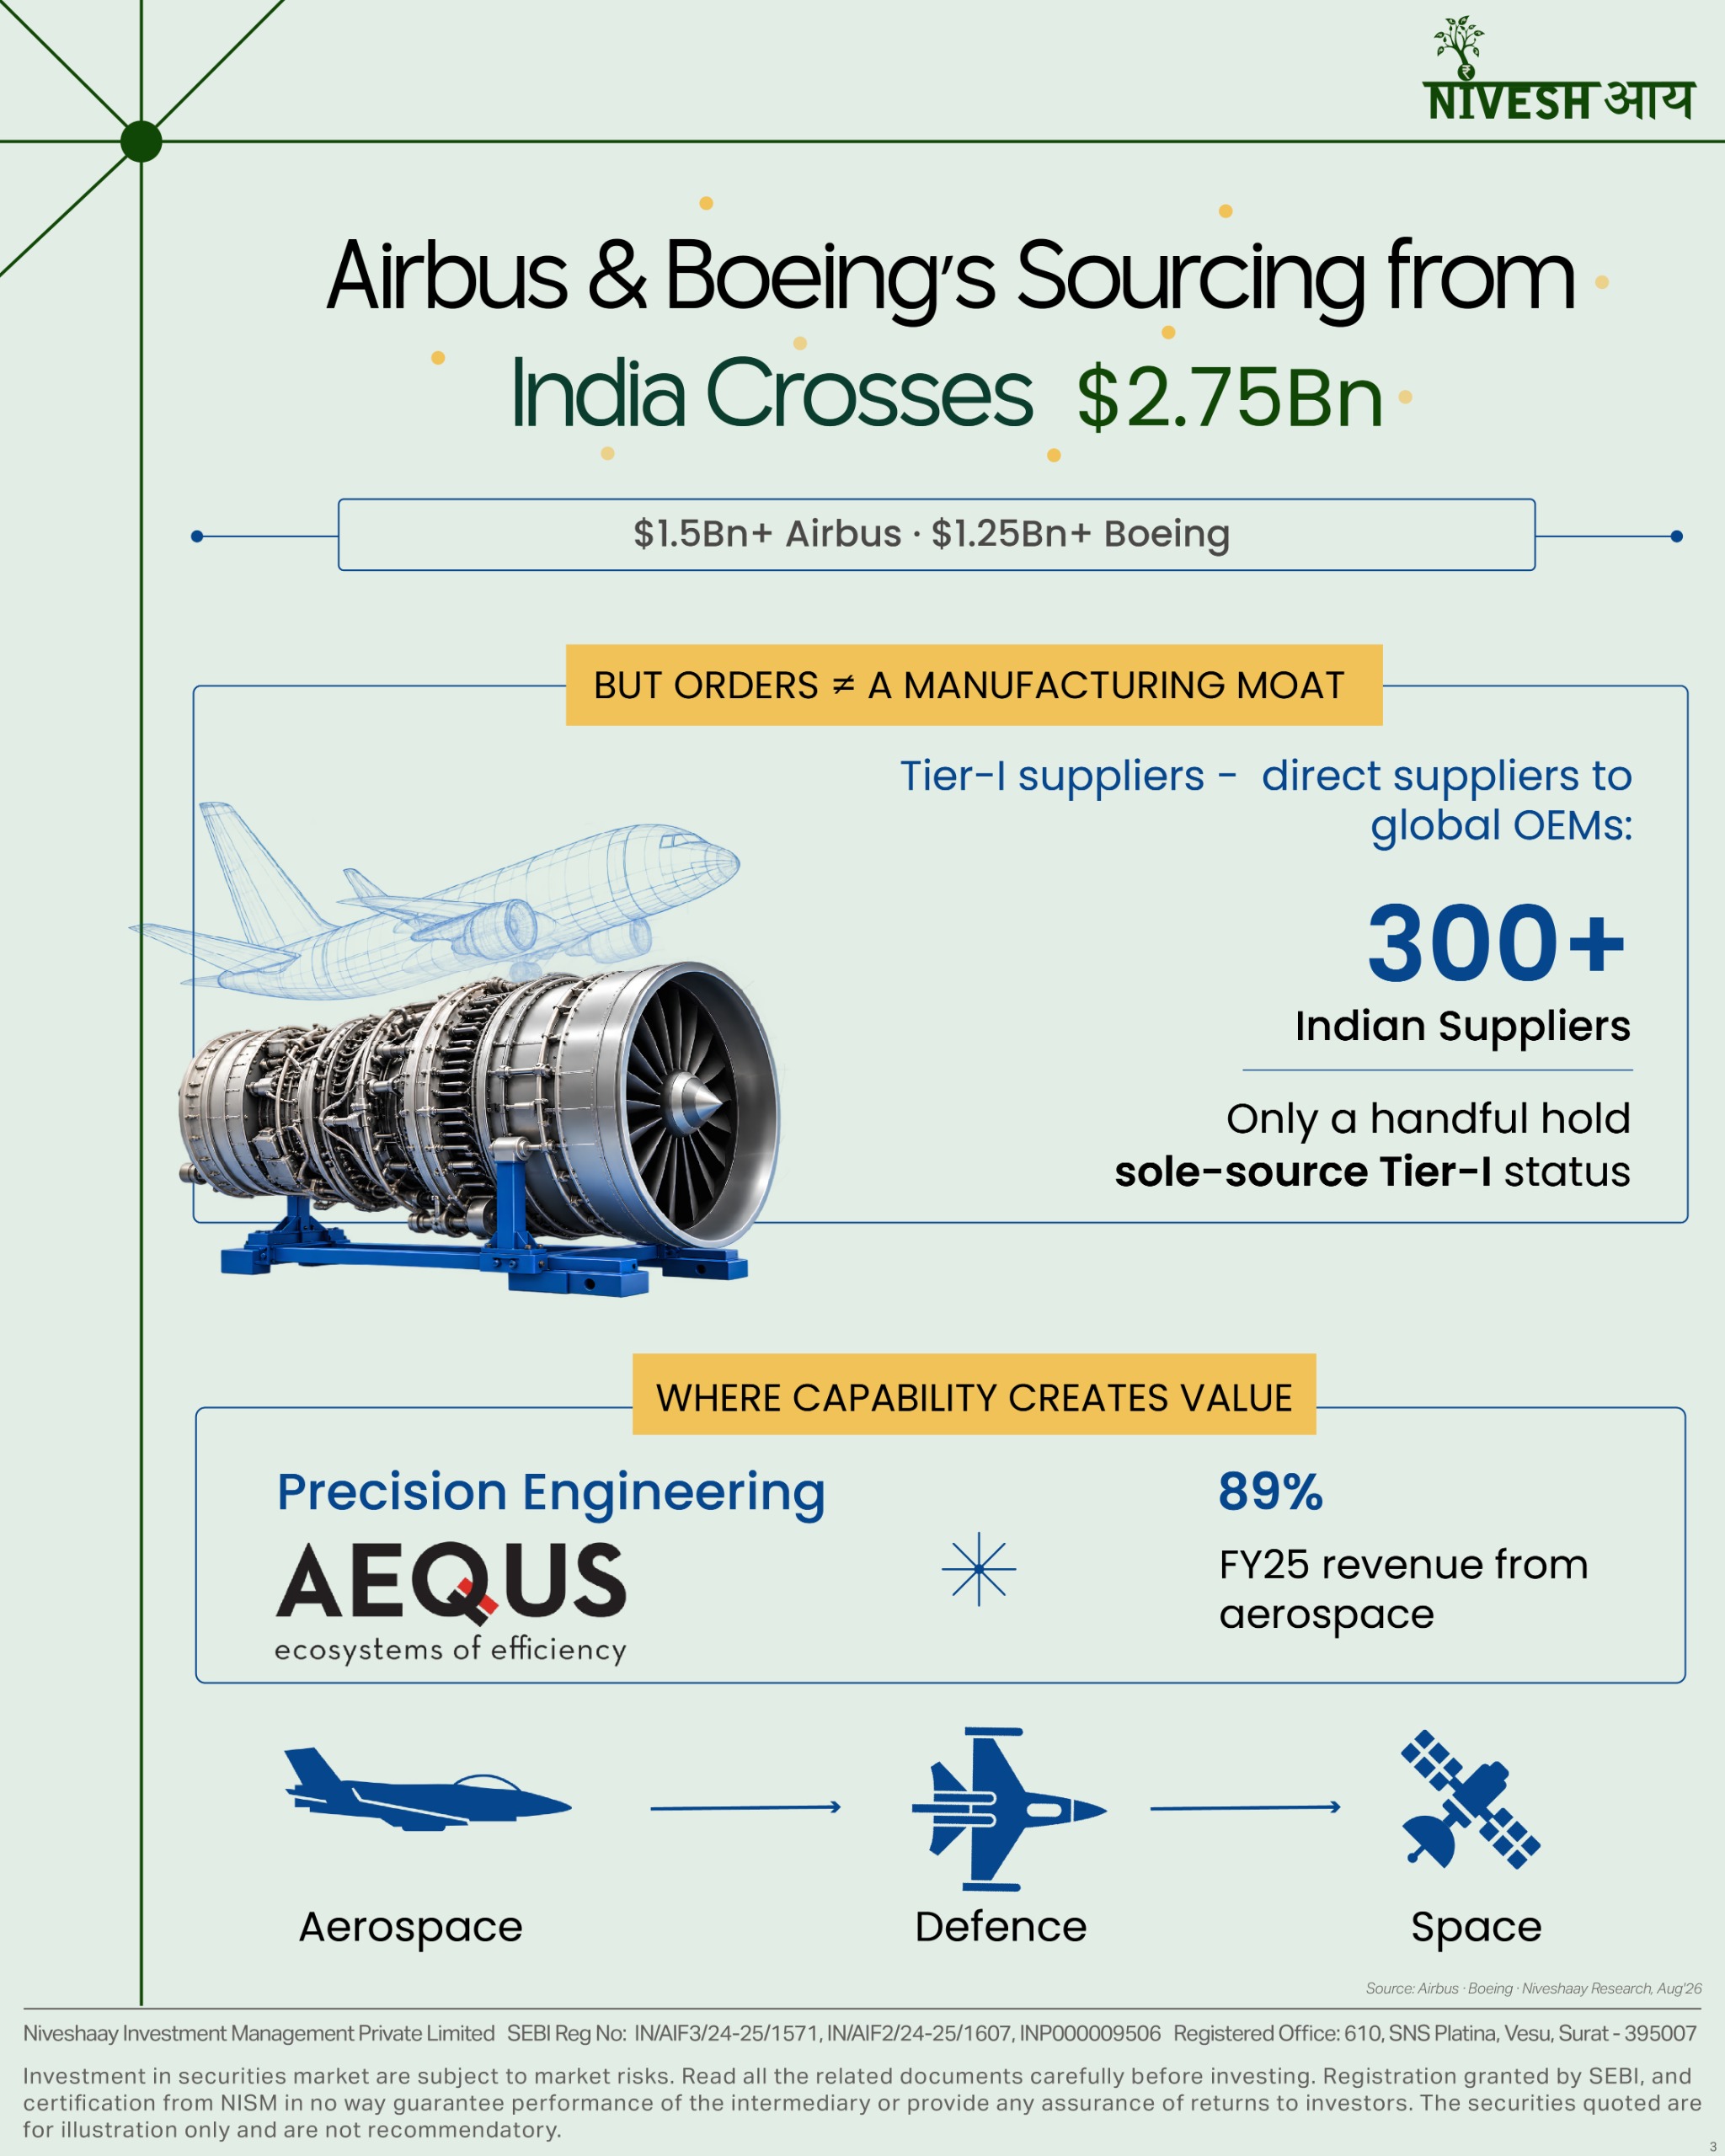
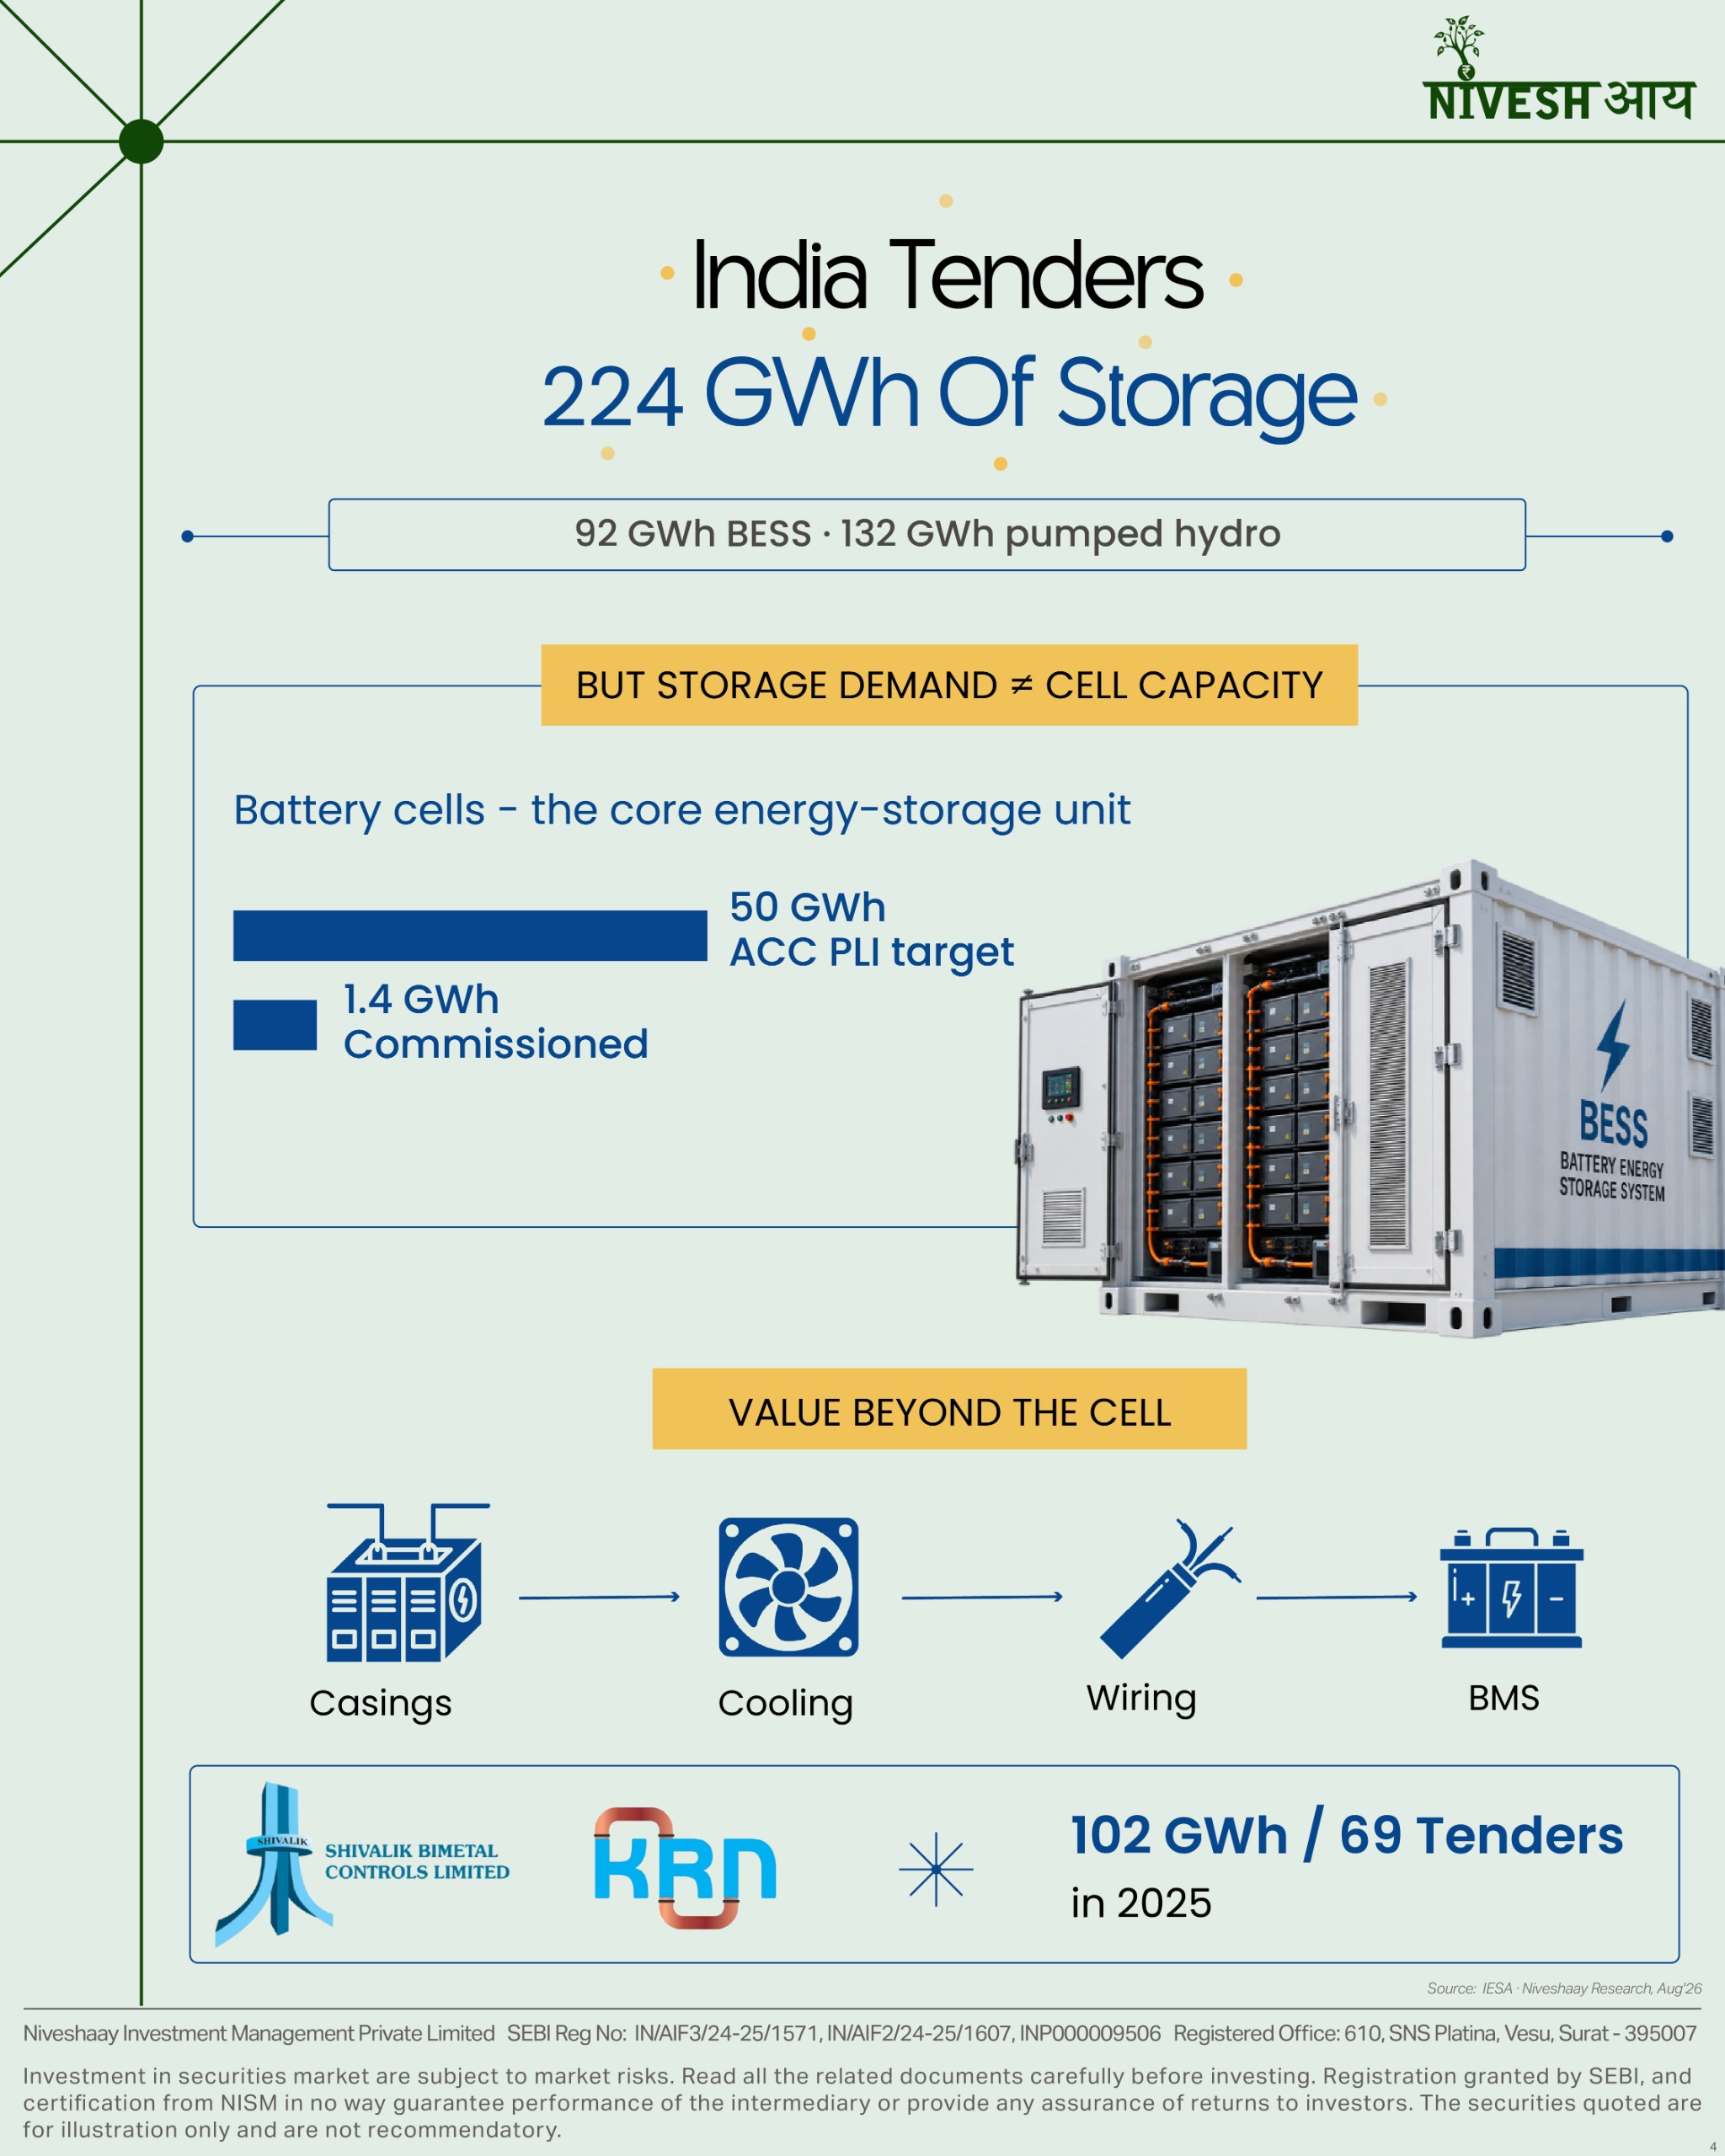
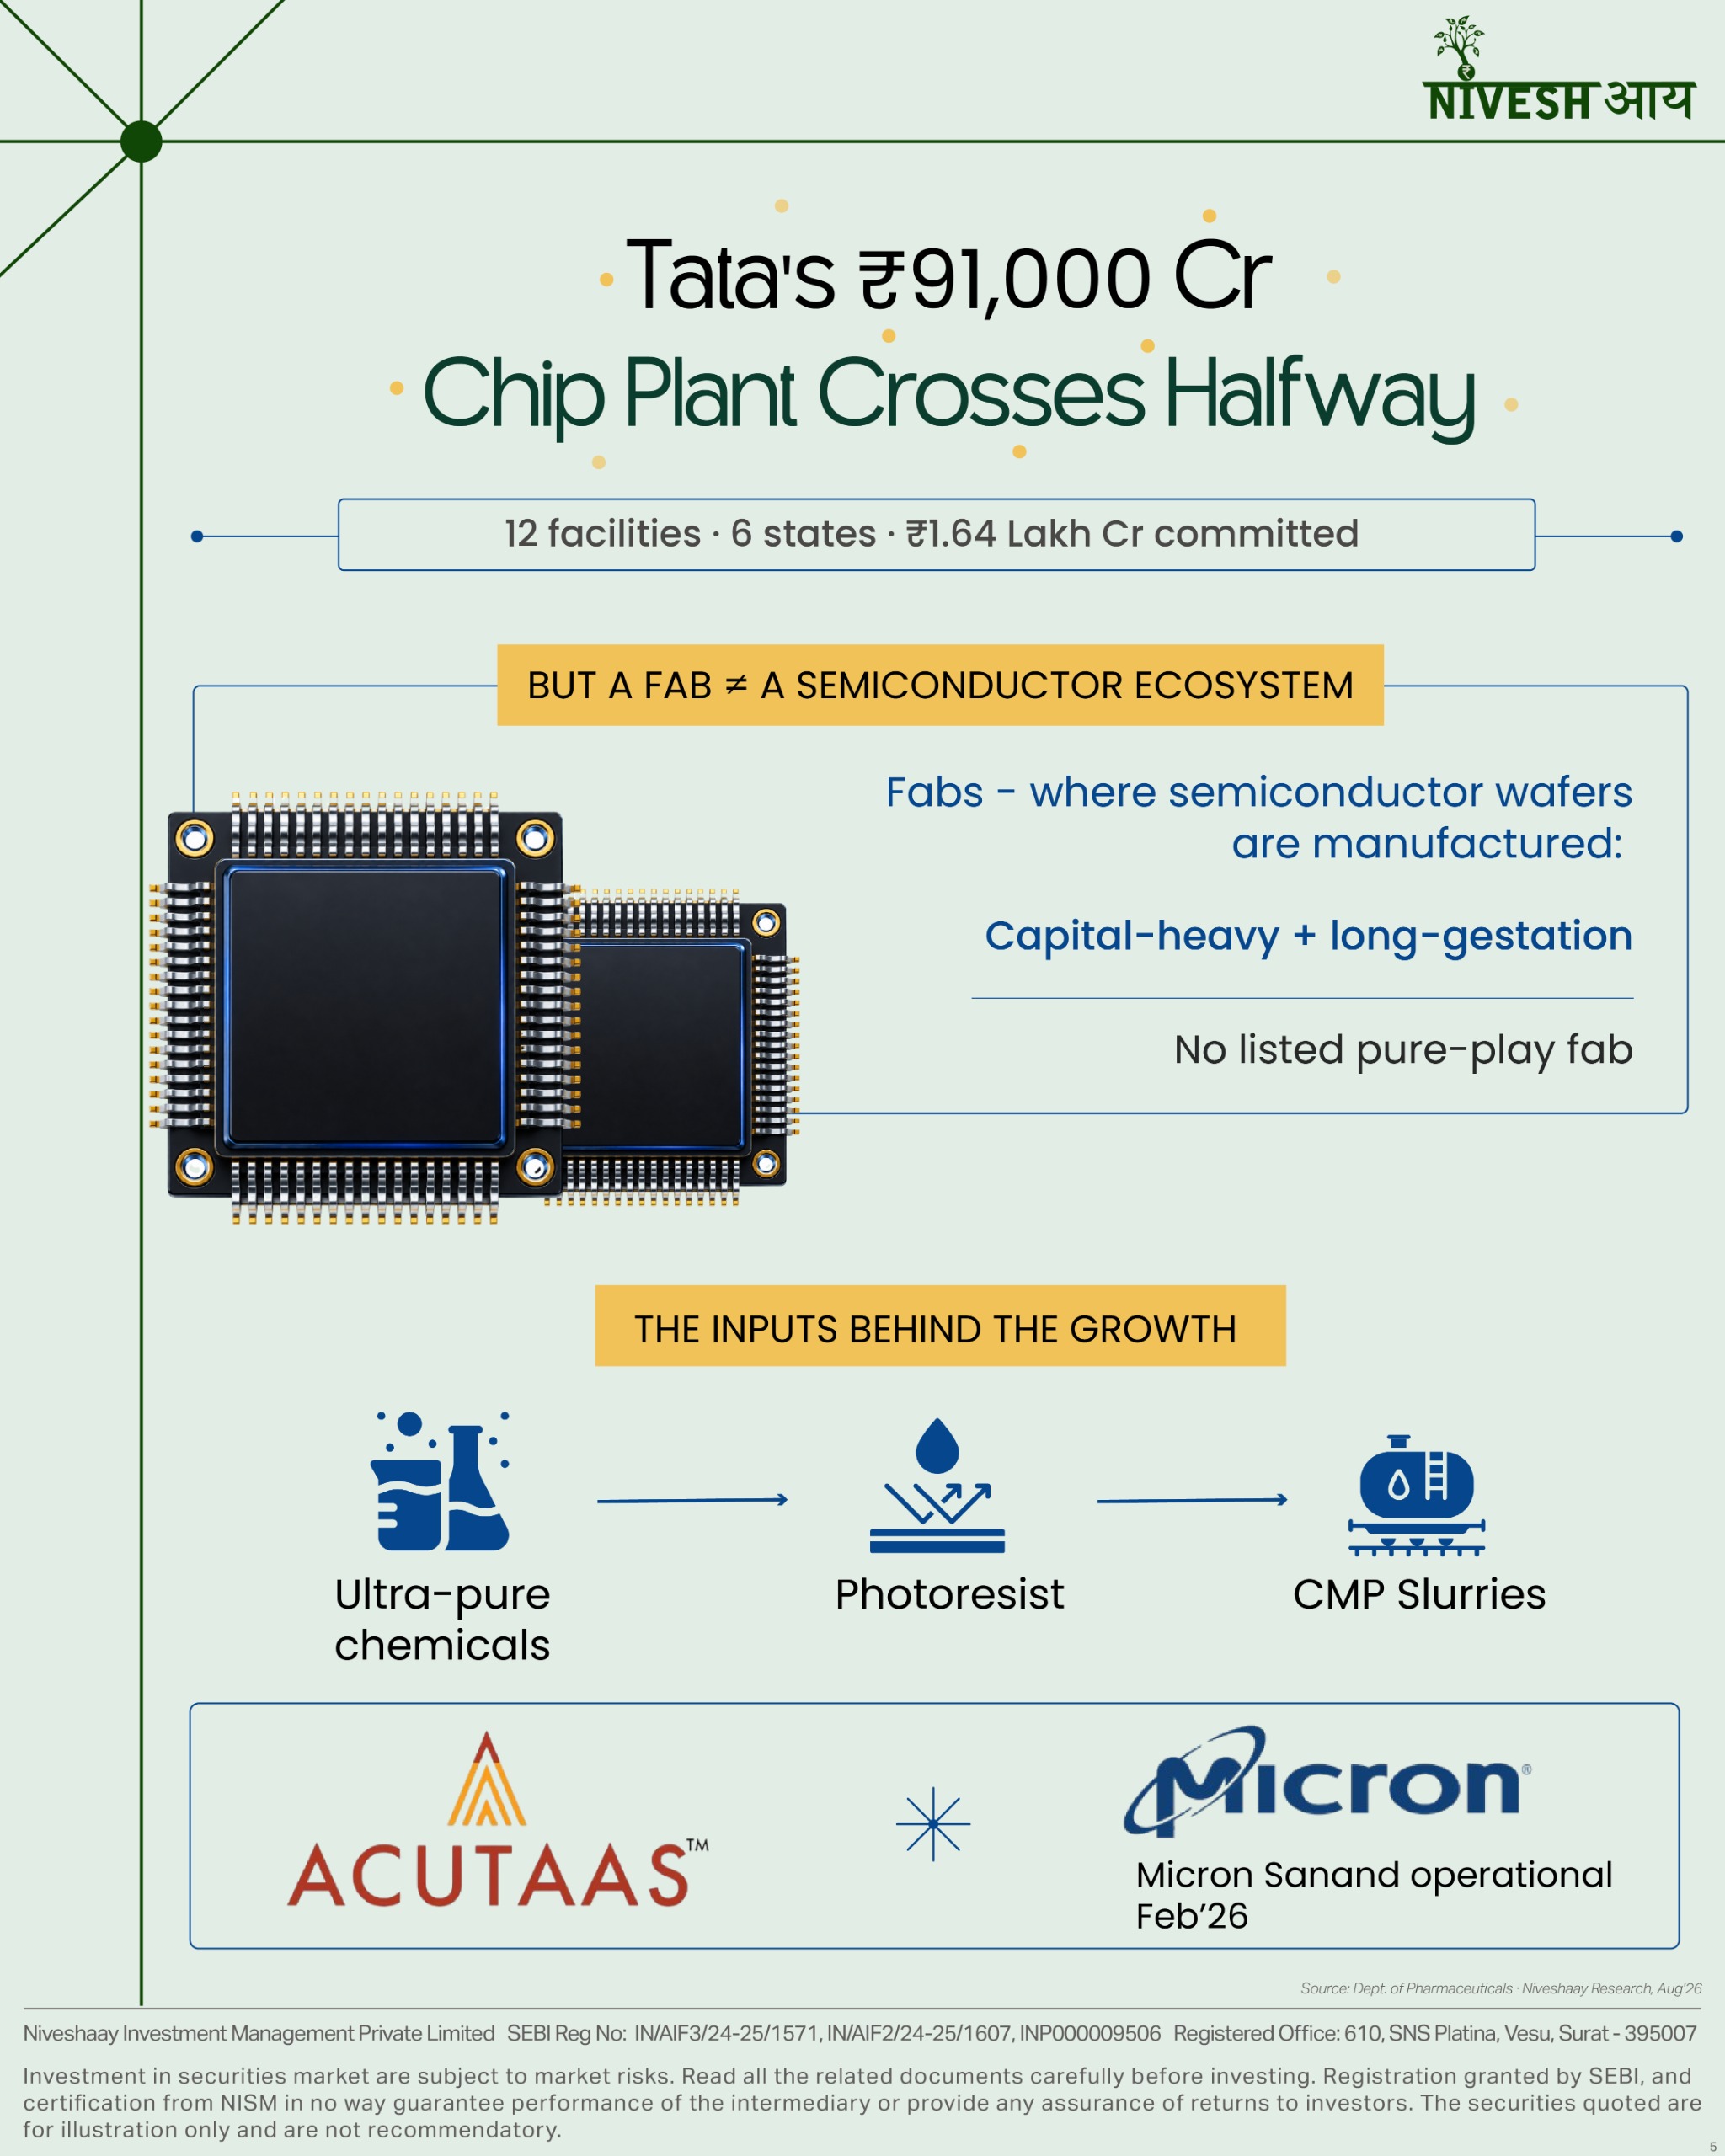
What if the real opportunity is hiding behind the headline?
A grid boom.
Aerospace orders.
Battery storage.
Semiconductor fabs.
The theme is visible.
The pockets within it are not!
We look beyond the headline : From the theme → to the value chain → to the bottleneck → to the pockets where value is being created.

Space Ecosystem
India Space Ecosystem: Insights from IEEE SPACE 2026
Insights from IEEE SPACE 2026 on India’s growing space ecosystem, from satellites and RF electronics to testing, data and connectivity.
Two days at IEEE SPACE 2026 in Bengaluru offered a ground-level view of India’s evolving space ecosystem—not just through presentations, but through conversations with the people building across the stack. 🛰️
The most compelling takeaway: India’s space opportunity is no longer limited to launch vehicles or satellite assembly. Capability is emerging across payloads, subsystems, testing, communications, navigation, orbital services and space-enabled infrastructure.
→ The event opened with a hands-on workshop on satellite TT&C and payload-related systems, drawing strong participation from students, researchers and startup teams. The depth of technical interest itself reflected a growing builder base.
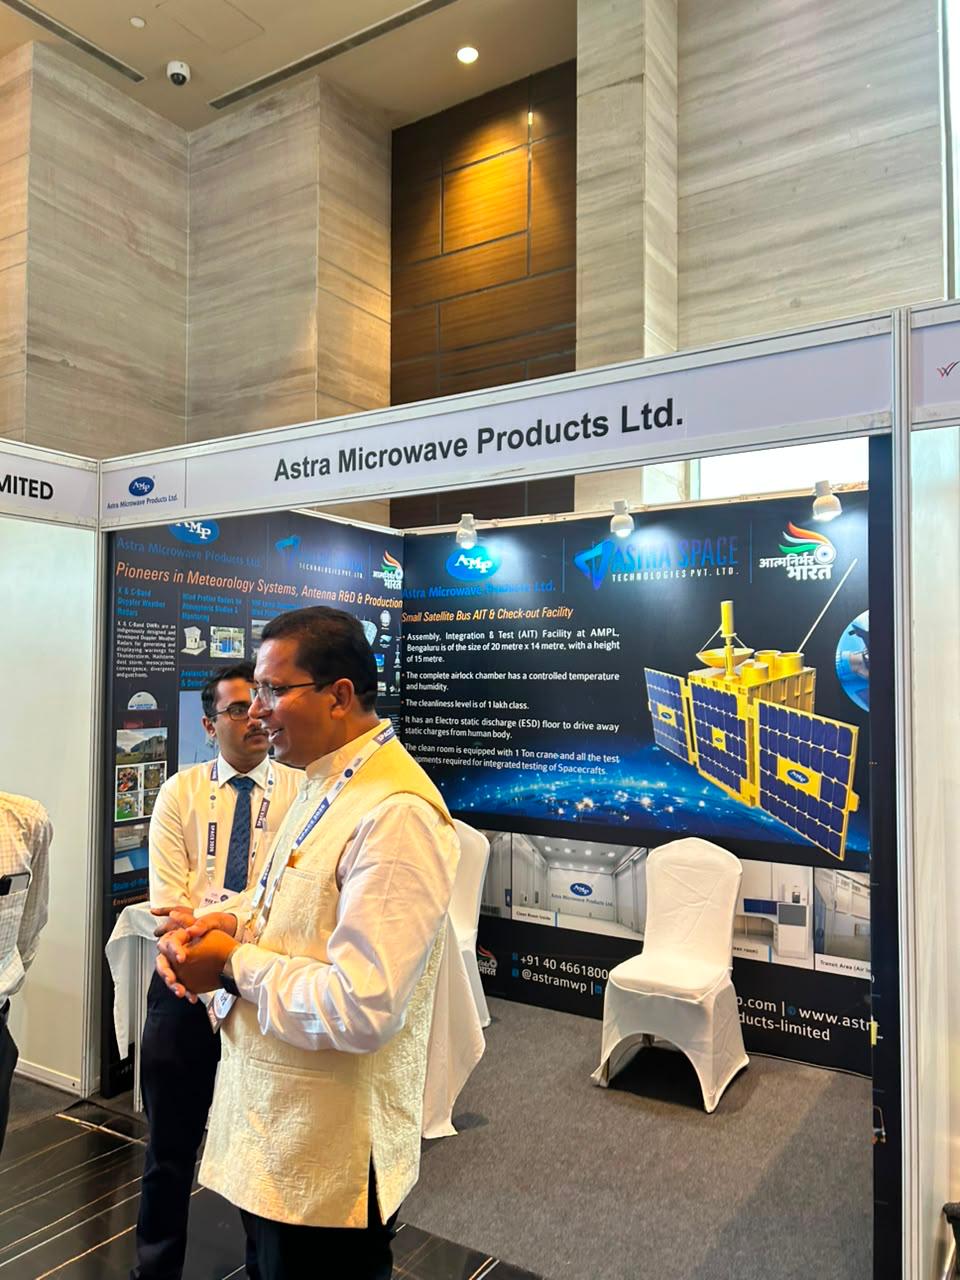
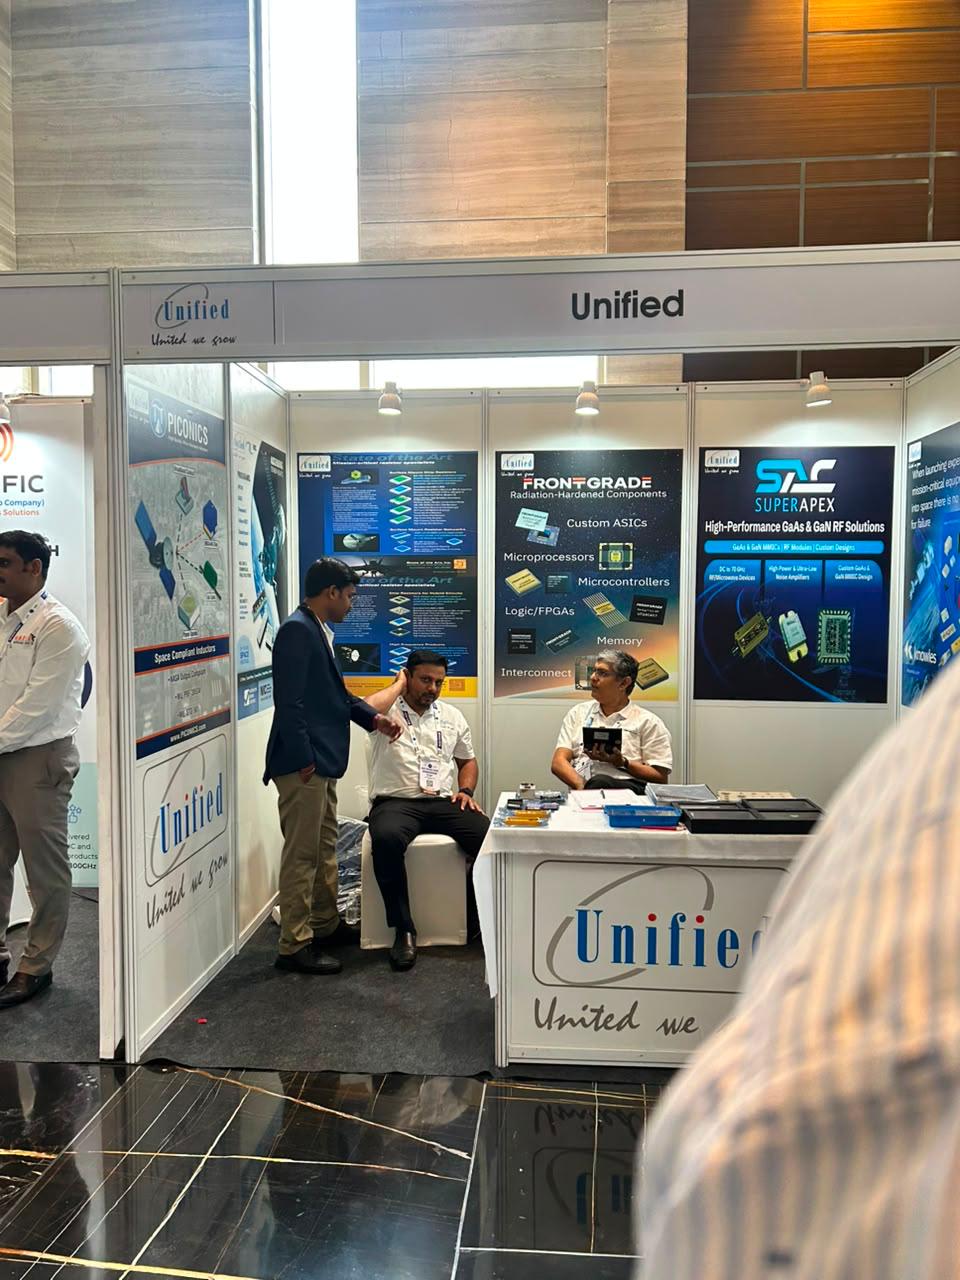
→ We met companies including Astra Microwave, Centum Electronics and Apollo Micro Systems- established listed players with long-standing ISRO and defence-program participation that are increasingly positioned to serve the expanding private-space ecosystem through electronics, RF, communications, propulsion and mission-critical subsystems.
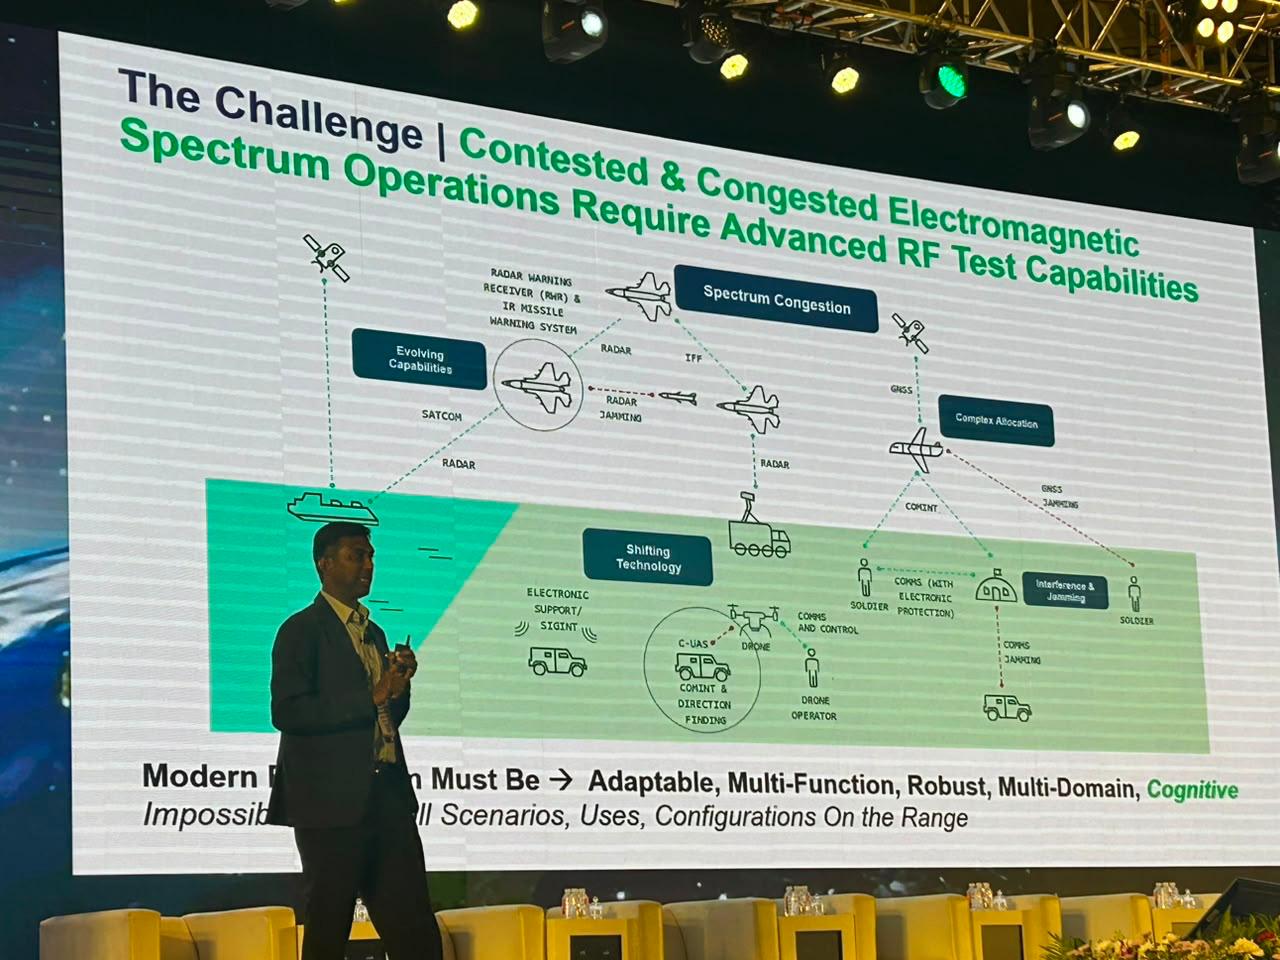
→ The exhibition highlighted active work across satellite payloads, simulation, radar, antenna measurement, RF testing and mission assurance.
Testing and validation infrastructure stood out as a particularly important enabling layer as satellite constellations scale.
IEEE SPACE also featured technical work around orbital data centres, AI-native NTN, 6G integration, radiation-hardened electronics and distributed satellite architectures.
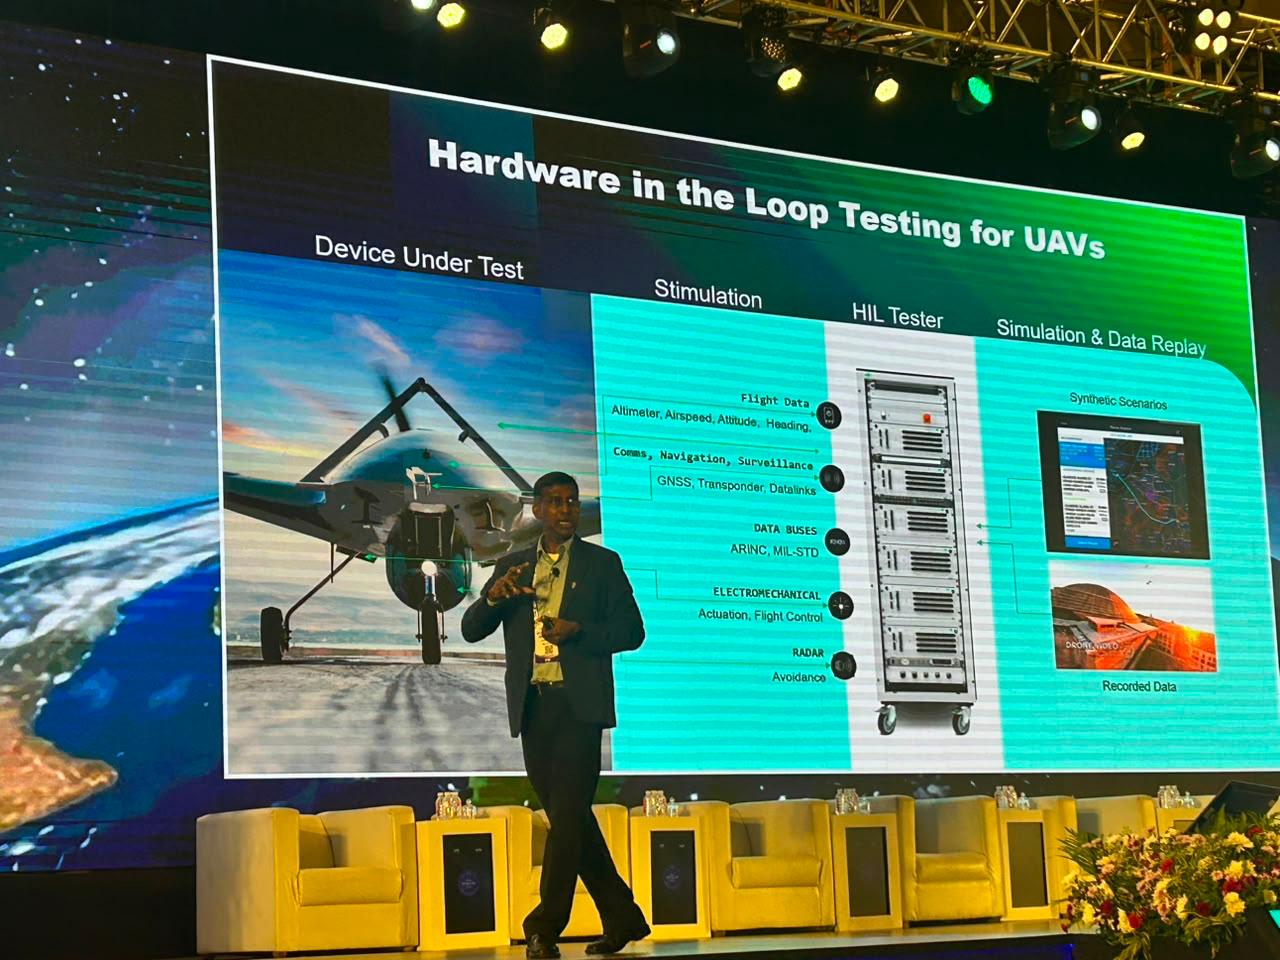
→ Industry conversations spanned planned constellations for PNT, Earth observation and communications, as well as the longer-horizon opportunity in in-space manufacturing, satellite life-extension and orbital computing/data infrastructure.
→ On the demand side, the ambition is becoming more tangible. Jio has outlined plans around sovereign satellite connectivity and ground infrastructure, with a focus on building domestic capability in LEO broadband and non-terrestrial networks.
→ India’s human-spaceflight journey was another powerful part of the event. Hearing Group Captain Shubhanshu Shukla speak about his journey from Lucknow to the International Space Station brought the broader ecosystem story into perspective—technical ambition, institutional capability and the next generation of space talent moving together.[2]
→ IEEE SPACE 2026 itself reflected this breadth: held in Bengaluru from 19–21 July, the conference brought together research, industry and government stakeholders across workshops, technical sessions and exhibitors in space, aerospace and defence.
For investors, the emerging opportunity is not a single “space stock” theme. It is a value chain:
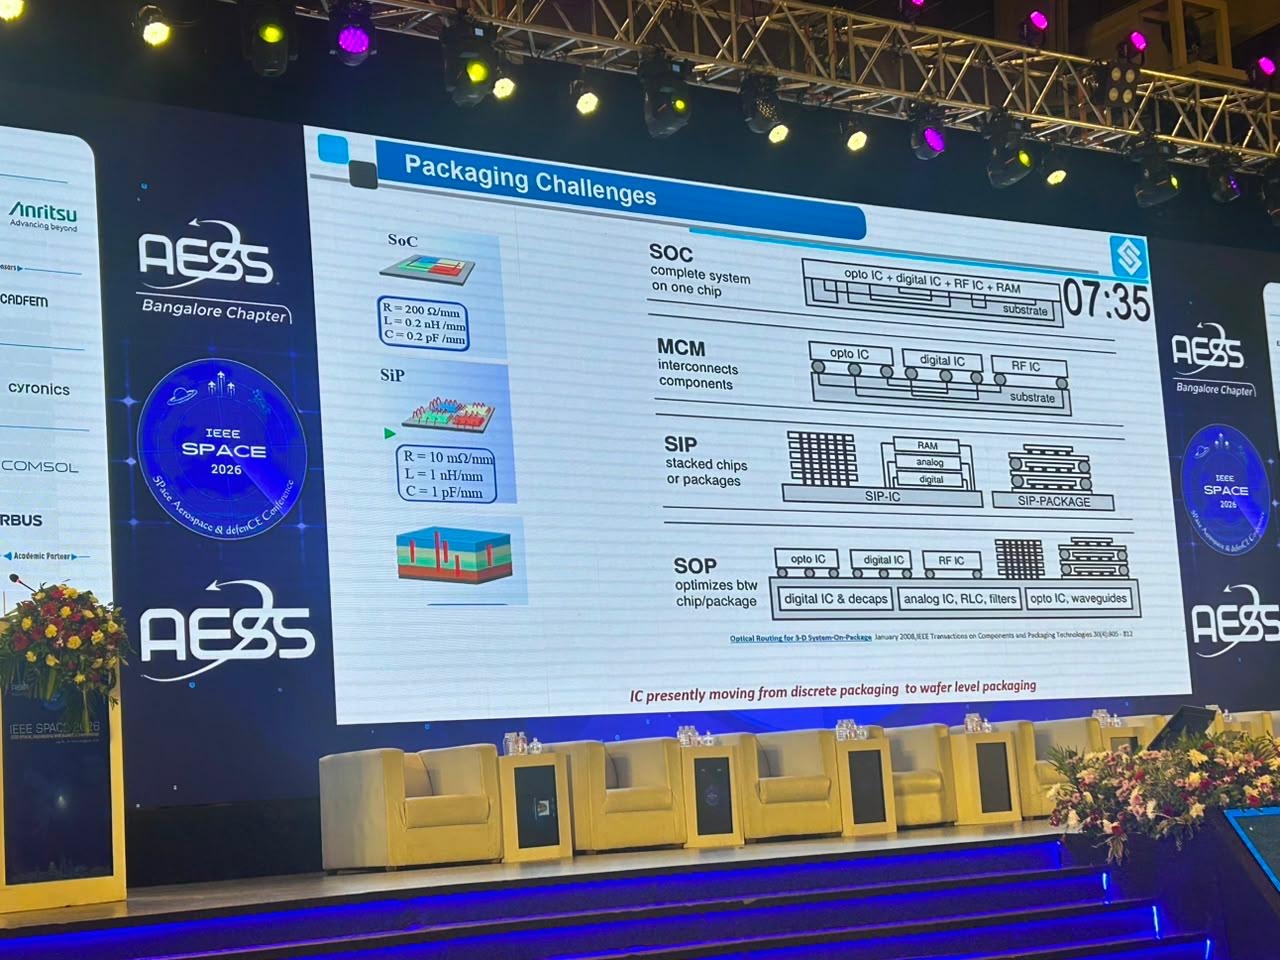
Launch vehicles → satellite platforms → payloads → electronics/RF → testing & qualification → ground systems → data, connectivity and downstream applications.
Launch remains a structurally attractive long-term layer, but satellite manufacturing, subsystem suppliers, RF electronics, testing infrastructure and mission software may offer equally important ways to participate in India’s private-space buildout.
India’s space stack is becoming broader, more commercial and increasingly interconnected. The next phase will be defined by execution—turning technical capability into repeatable manufacturing, constellation deployment and monetisable space-based services.
AI & Data Center
What Nebius & CoreWeave Tell Us About AI Compute
Two AI compute companies. Two very different models. One clear signal from Nebius and CoreWeave June quarter: Compute pricing is still rising. Contracts are extending further than expected, and both companies continue to scale capacity aggressively. But behind the growth lies an important question: can today’s pricing sustain the massive capital going into AI infrastructure?
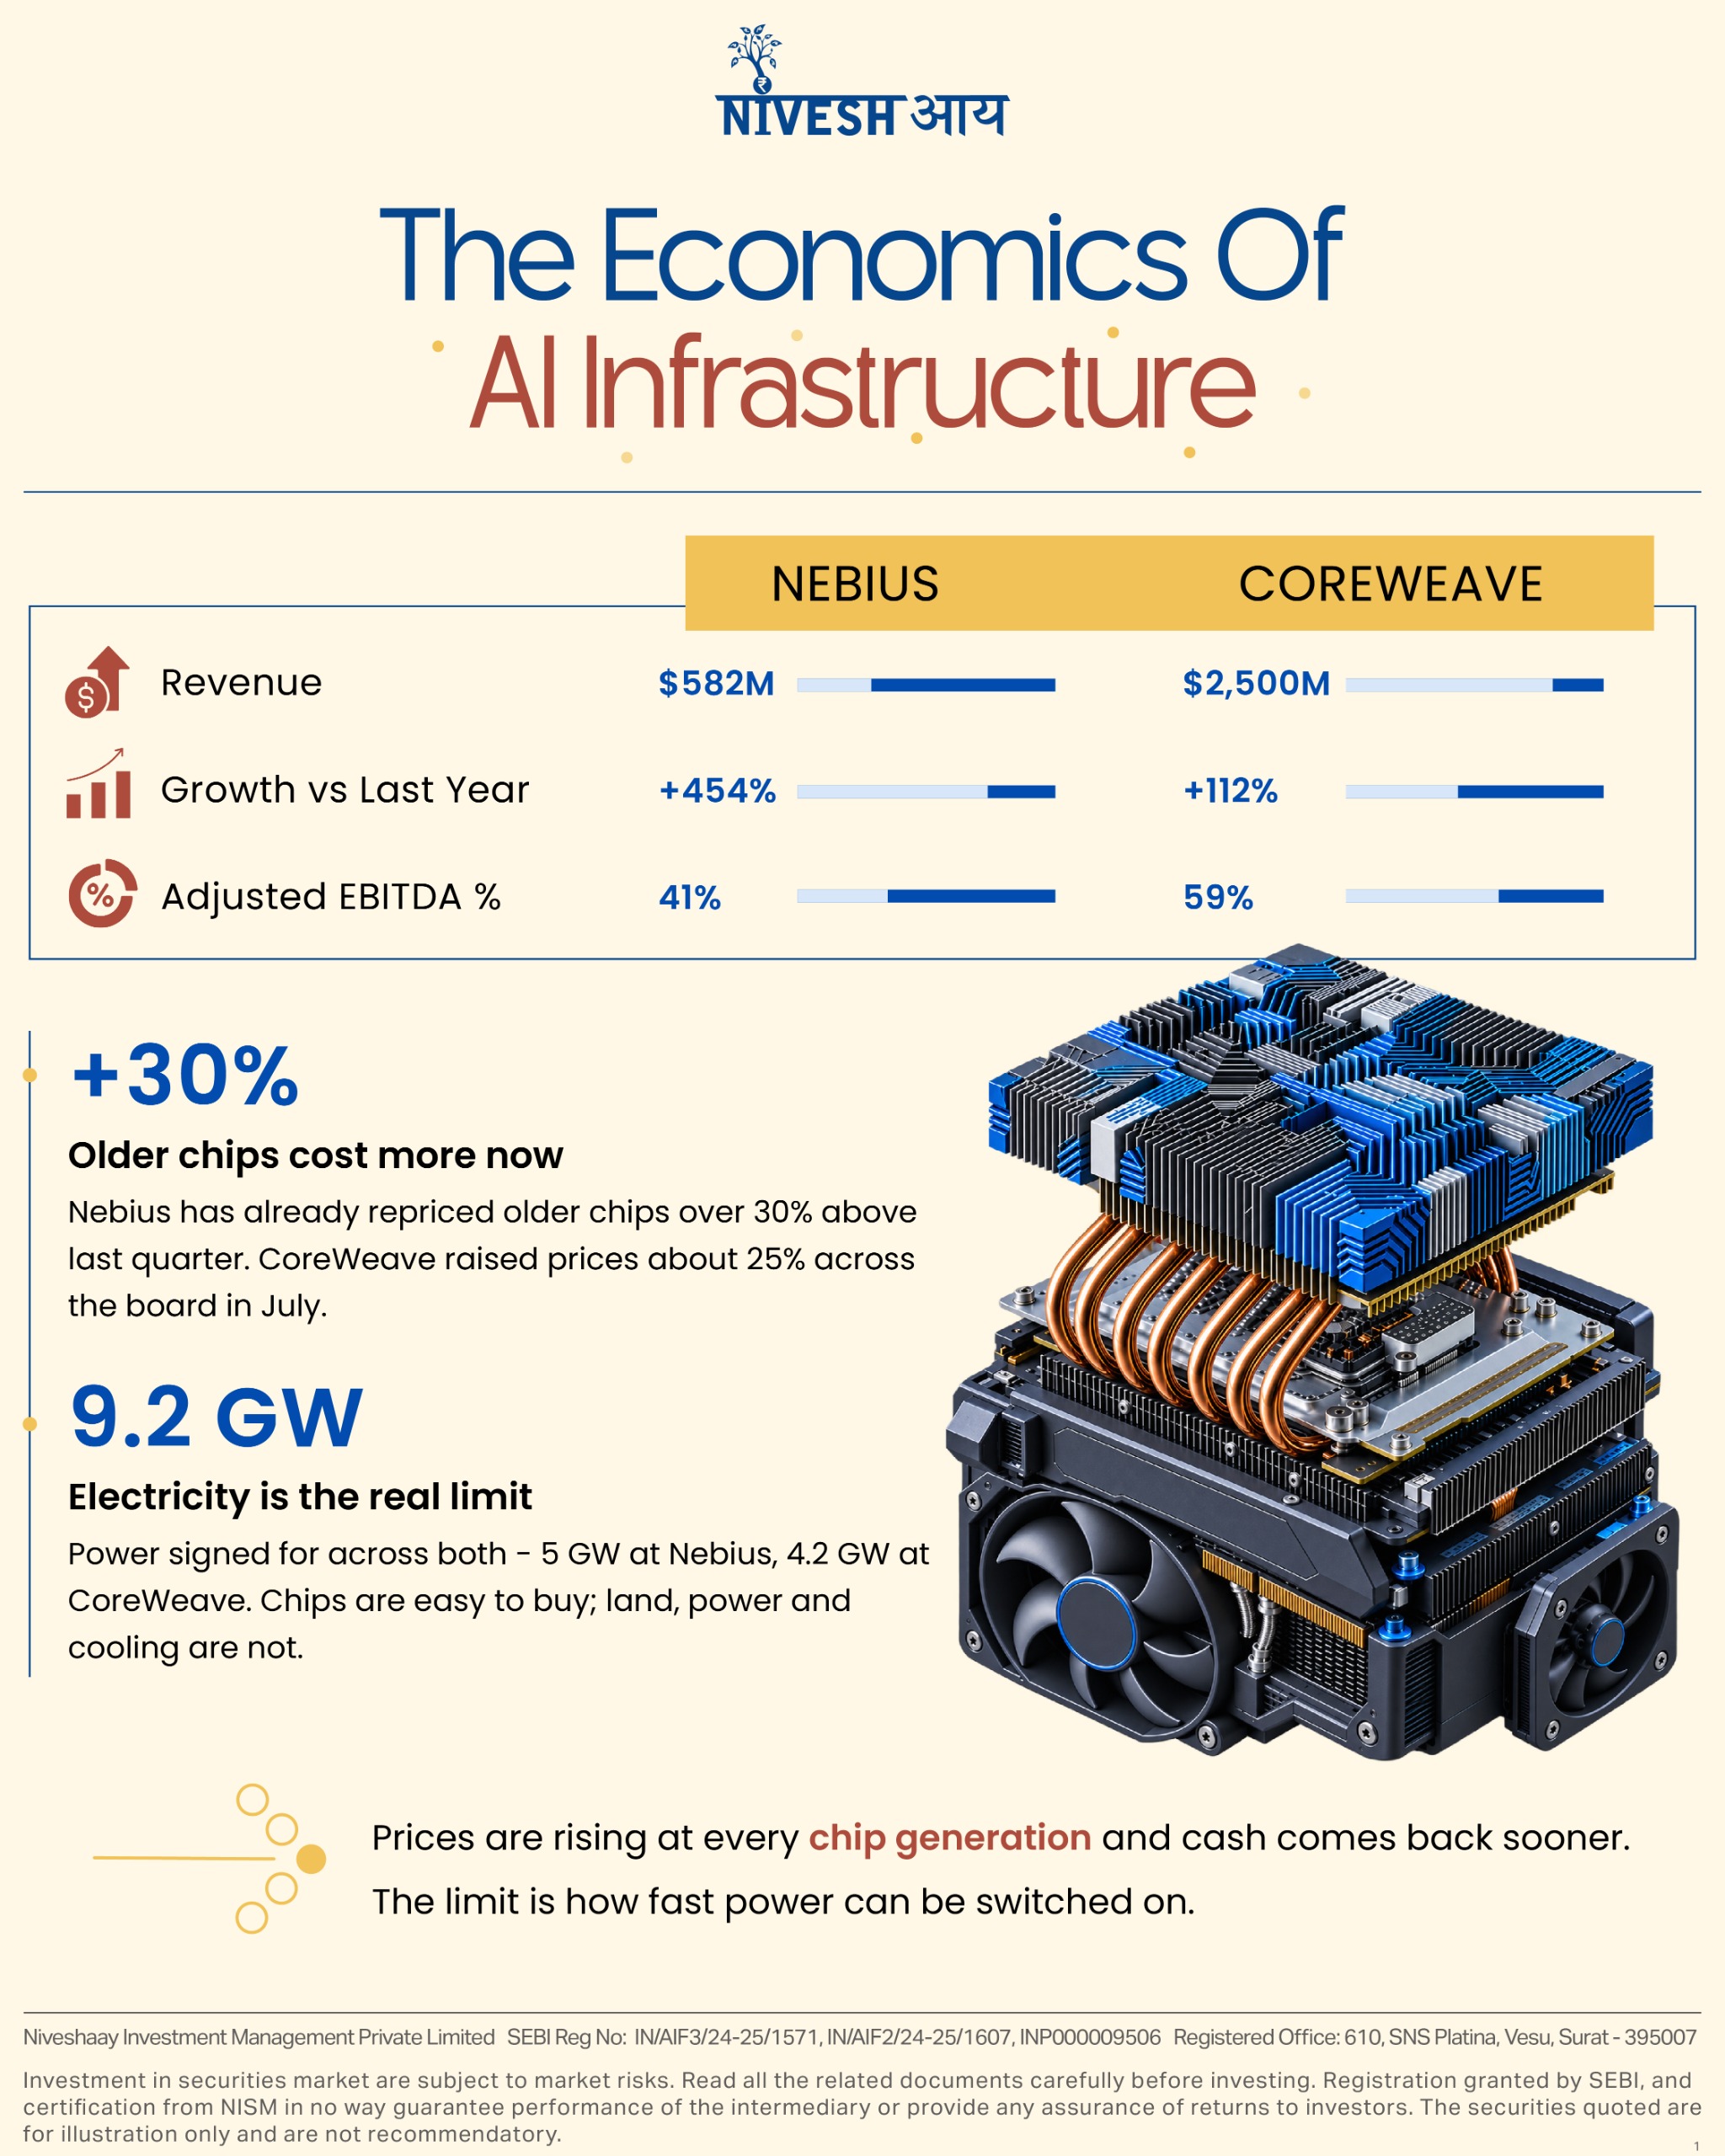

Two companies rent out AI computing power at scale. Nebius and CoreWeave both reported their June quarter in August — and read together, they say something the market spent July doubting.
Prices are rising at every generation of chip.
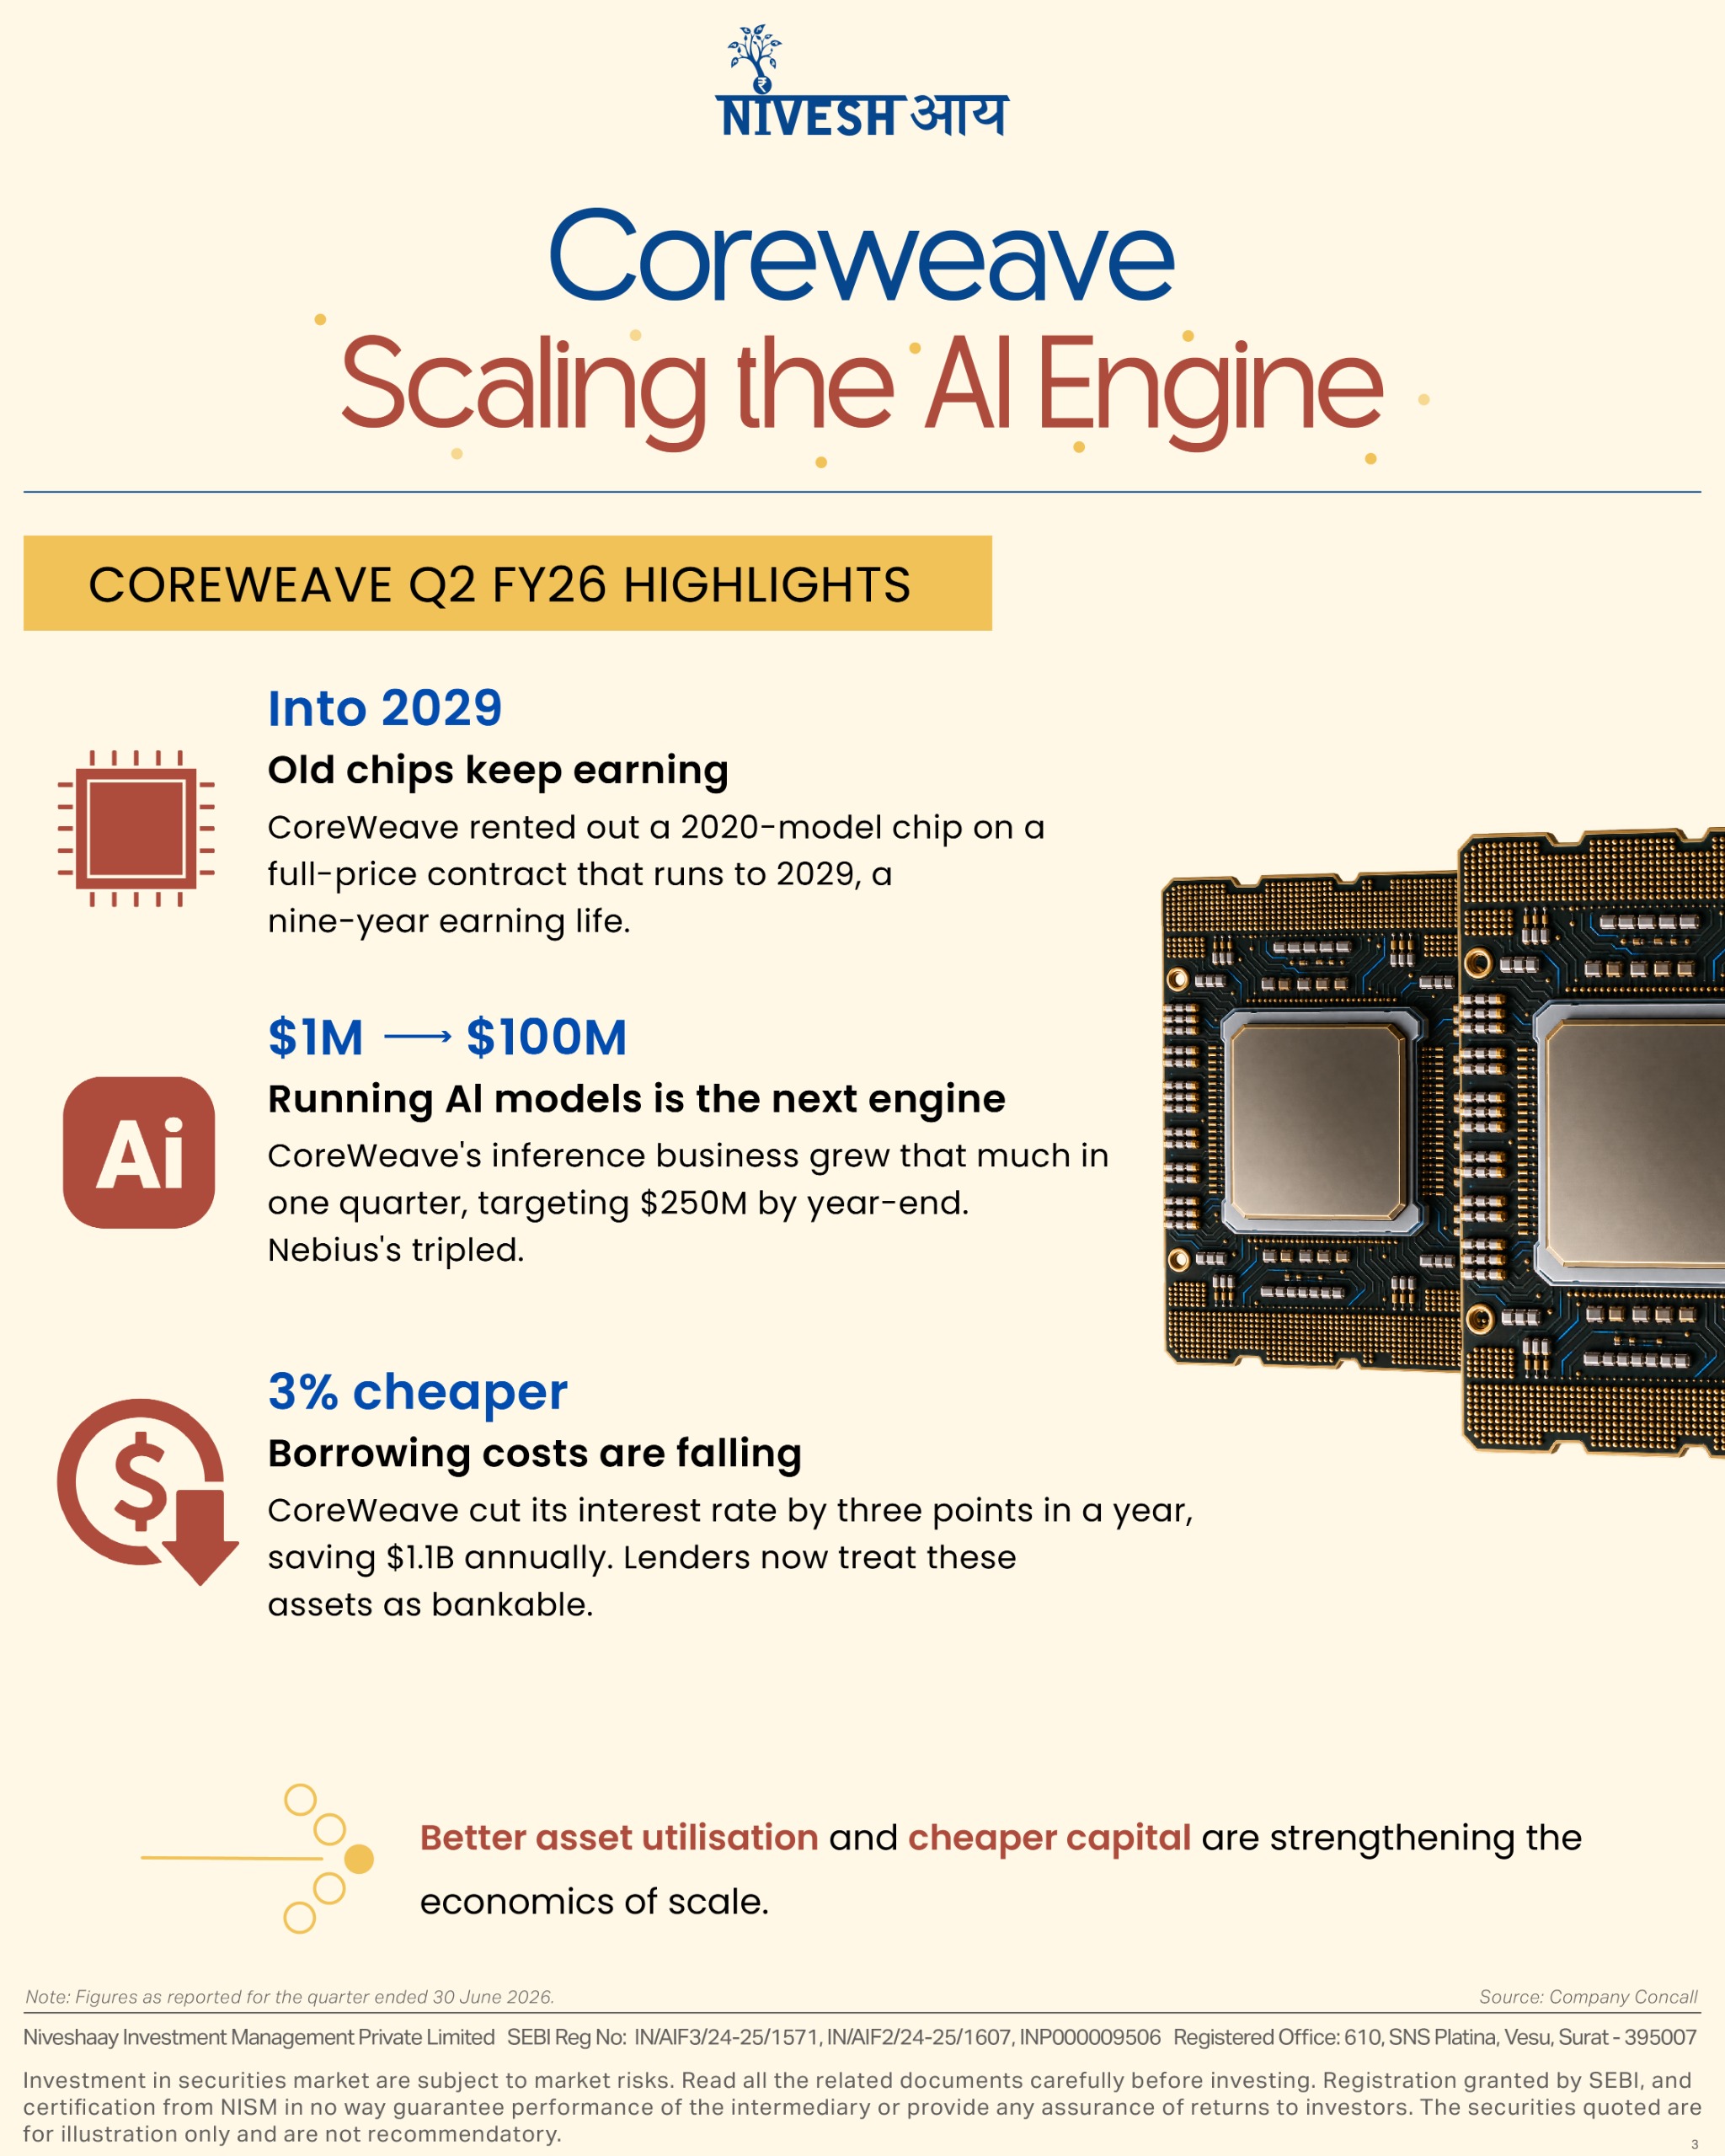
Nebius has repriced its older GPUs more than 30% above last quarter. CoreWeave raised prices roughly 25% across its whole range in July — and rented out a 2020-model chip on a full-price contract running to 2029. A nine-year earning life on hardware many had assumed was obsolete in three.
Beyond pricing, the two look nothing alike.
Nebius builds capacity before it has customers, then sells close to switch-on to catch the going rate. It says it could sell all of its 2027 capacity today and is deliberately choosing not to. Short three-to-six-month rentals now fetch $40–50M per megawatt a year, against $20–25M on multi-year deals and about $12M across older capacity. Its money now comes back in under two years, down from two to three.
CoreWeave does close to the opposite — it sells years forward, then borrows against the contract. It has cut its cost of debt by three percentage points in a year, saving $1.1B annually. Its newer business, running models rather than renting chips, went from $1M to $100M in a single quarter.
Each company disclosed the numbers its own strategy makes look good. That itself is worth noticing.
The binding constraint is neither chips nor money. It is electricity — 4.2 GW contracted at CoreWeave today, 5 GW targeted at Nebius by December. And even switched-on power doesn’t earn immediately: commissioning a building, wiring the network, installing the clusters and onboarding customers takes months before the first invoice.
Worth holding alongside all of this: both companies are still loss-making, and between them they plan to spend $55–64B on construction this year against $15–17B of revenue. The economics only work if these prices hold.

Aerospace & Defense
How India became the Medicine Factory of the world?
How India quietly became the world's medicine factory - the trust, timing, and tailwinds behind pharma's biggest manufacturing shift.

CHAPTER 1
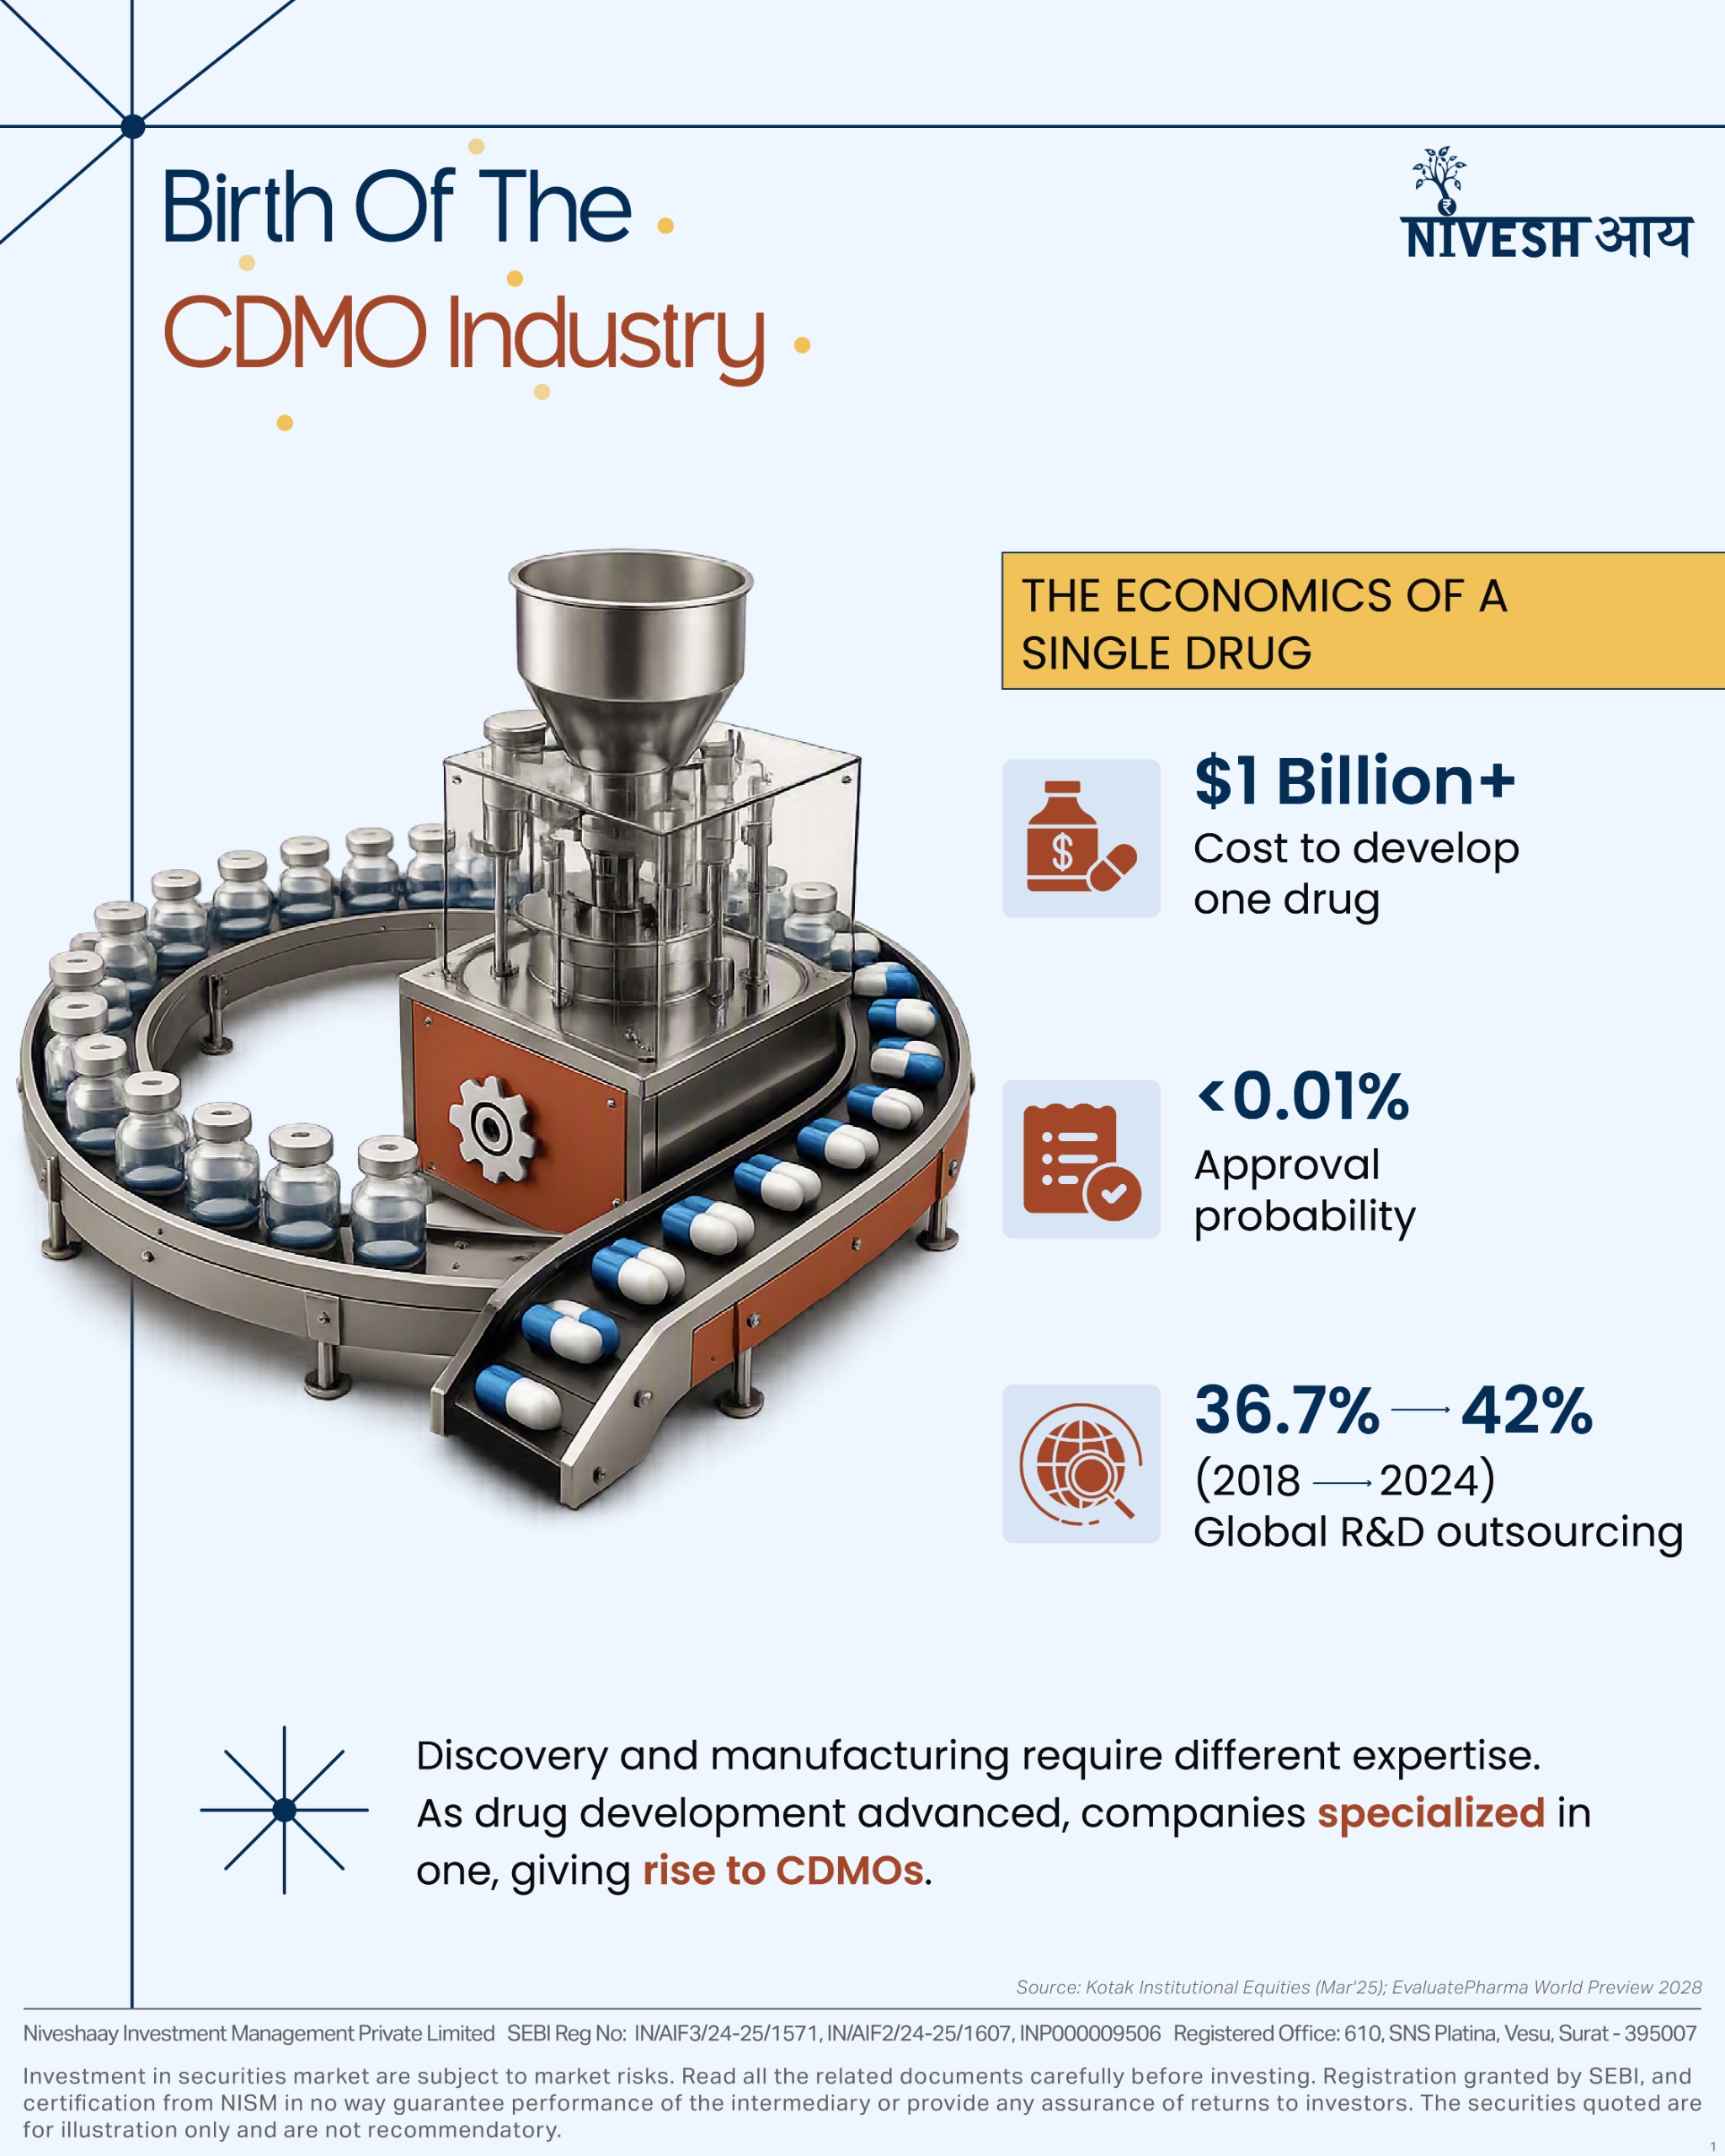
A new medicine now costs more than $1 billion to develop. That’s roughly ten times what it cost in the 1970s. And for every molecule that starts out in a lab, the odds it ever becomes an approved medicine are below 1 in 10,000.
That math doesn’t really behave like research. It behaves like insurance: you pay the premium for years, and you collect only on the one rare outcome that survives every hurdle.
Being good at discovering a drug and being good at manufacturing one are two different businesses, wearing the same industry’s name.
A pharma company’s real skill sits upstream – understanding biology, running trials, navigating regulators. Manufacturing that same drug at full scale, inside a tightly regulated factory, for years without a single deviation – that’s a completely different skill. Increasingly, drug companies don’t even try to be good at both.
That one decision – hand off the making of the molecule to someone else – is the seed of a nearly $200 billion industry. It’s the reason China became impossible to avoid. And it’s the reason India’s best manufacturers are far stickier businesses than most investors give them credit for.
CHAPTER 2
Three overlapping acronyms describe this industry, and the difference between them matters:

Every arrow in that chain used to mean handing the project to a brand-new vendor – and every handover leaked time and institutional memory. Companies that do both jobs under one roof avoid that loss entirely. That’s why pharma now treats them as long-term partners who share development costs, not factories-for-hire who simply take orders.
CHAPTER 3
A factory can be built in eighteen months. The regulatory trust that lets it make a medicine cannot be bought at any price.
A drug’s approval isn’t tied to the formula alone – it’s tied to one exact process, made in one exact factory. Once that approval exists, the manufacturer isn’t just renting out floor space. It’s selling something the drug company now depends on completely: a process that regulators have checked, filed, and inspected.
Five things compound that dependence, and they’re worth understanding one by one:
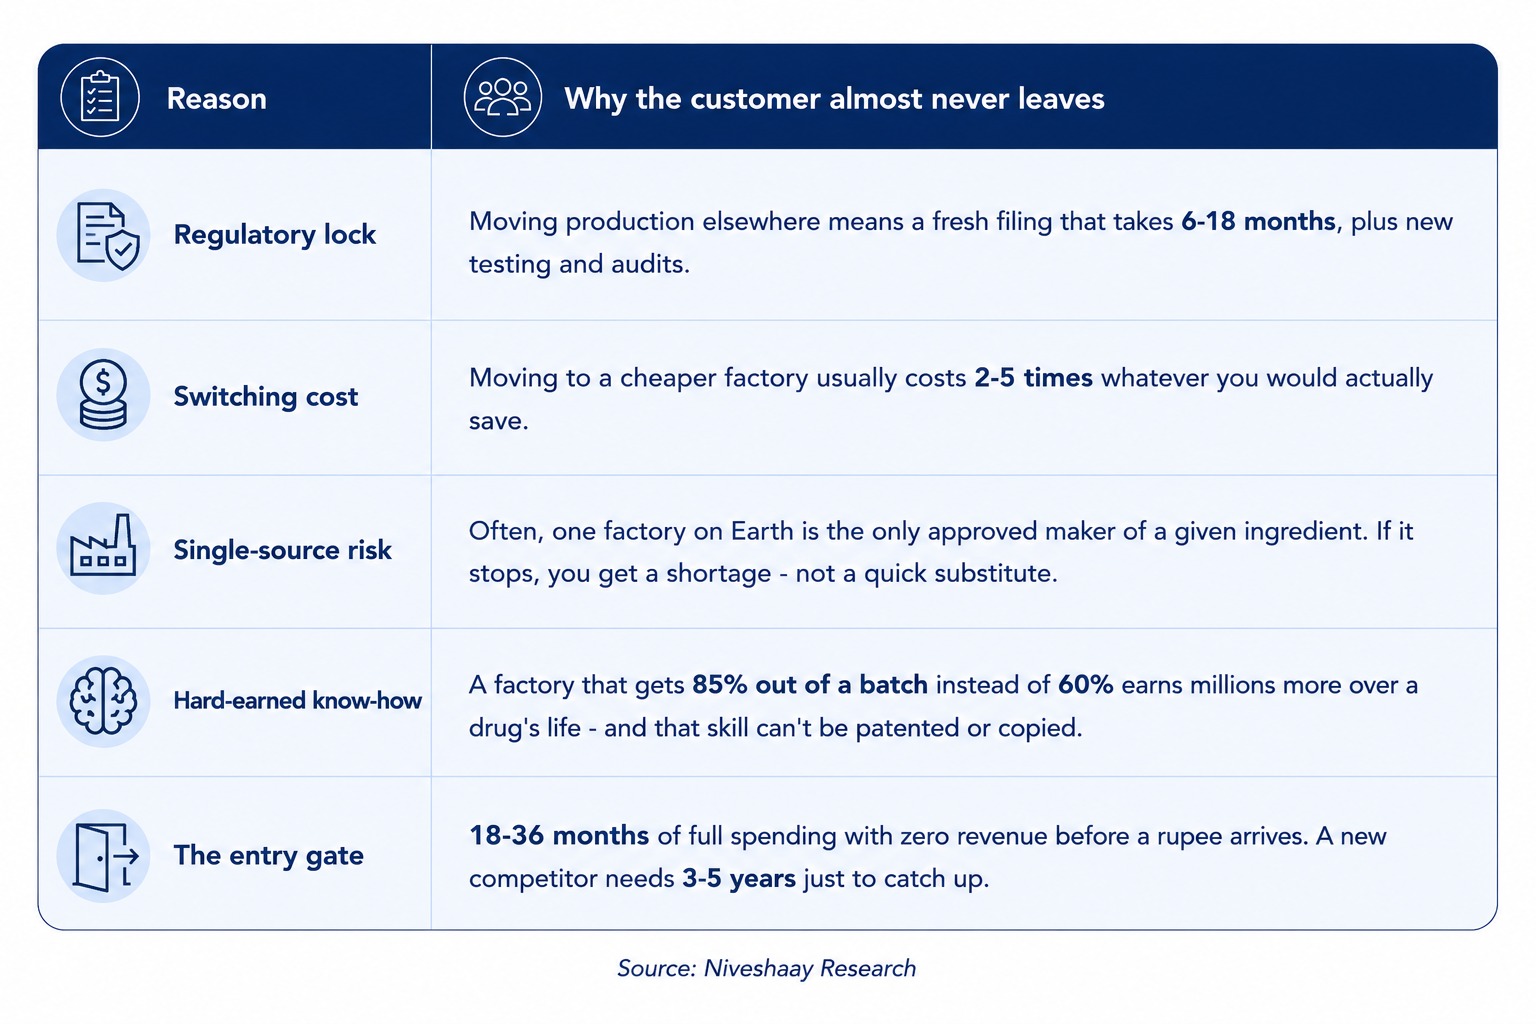
Clear that gate, and the economics flip. Once a factory is running at roughly 70% capacity, its costs are covered – and every order after that earns a 60-70%+ profit margin. The market prices this business as lumpy, capital-heavy manufacturing. It behaves more like owning 25-30 overlapping contracts that quietly keep paying out for as long as each drug’s patent lasts.
A useful comparison:
picture a precision aerospace supplier standing next to a pharma manufacturer. Same empty-factory-before-the-first-order problem. Same one-supplier-only risk. Same money spent before a single order land – because no customer ever moves into an empty facility. Boeing and Bayer, in this narrow sense, run the exact same playbook.
CHAPTER 4
The obvious answer – cheap labour – stopped being true years ago. China’s real edge is that it earned regulators’ trust faster than anyone else, through three deliberate moves made over roughly a decade:
The result: a $28 billion Chinese CRDMO market, with 30%+ of globally licensed drugs tracing some research origin back there. The real signal isn’t the size of that number. It’s the change in behaviour it caused.
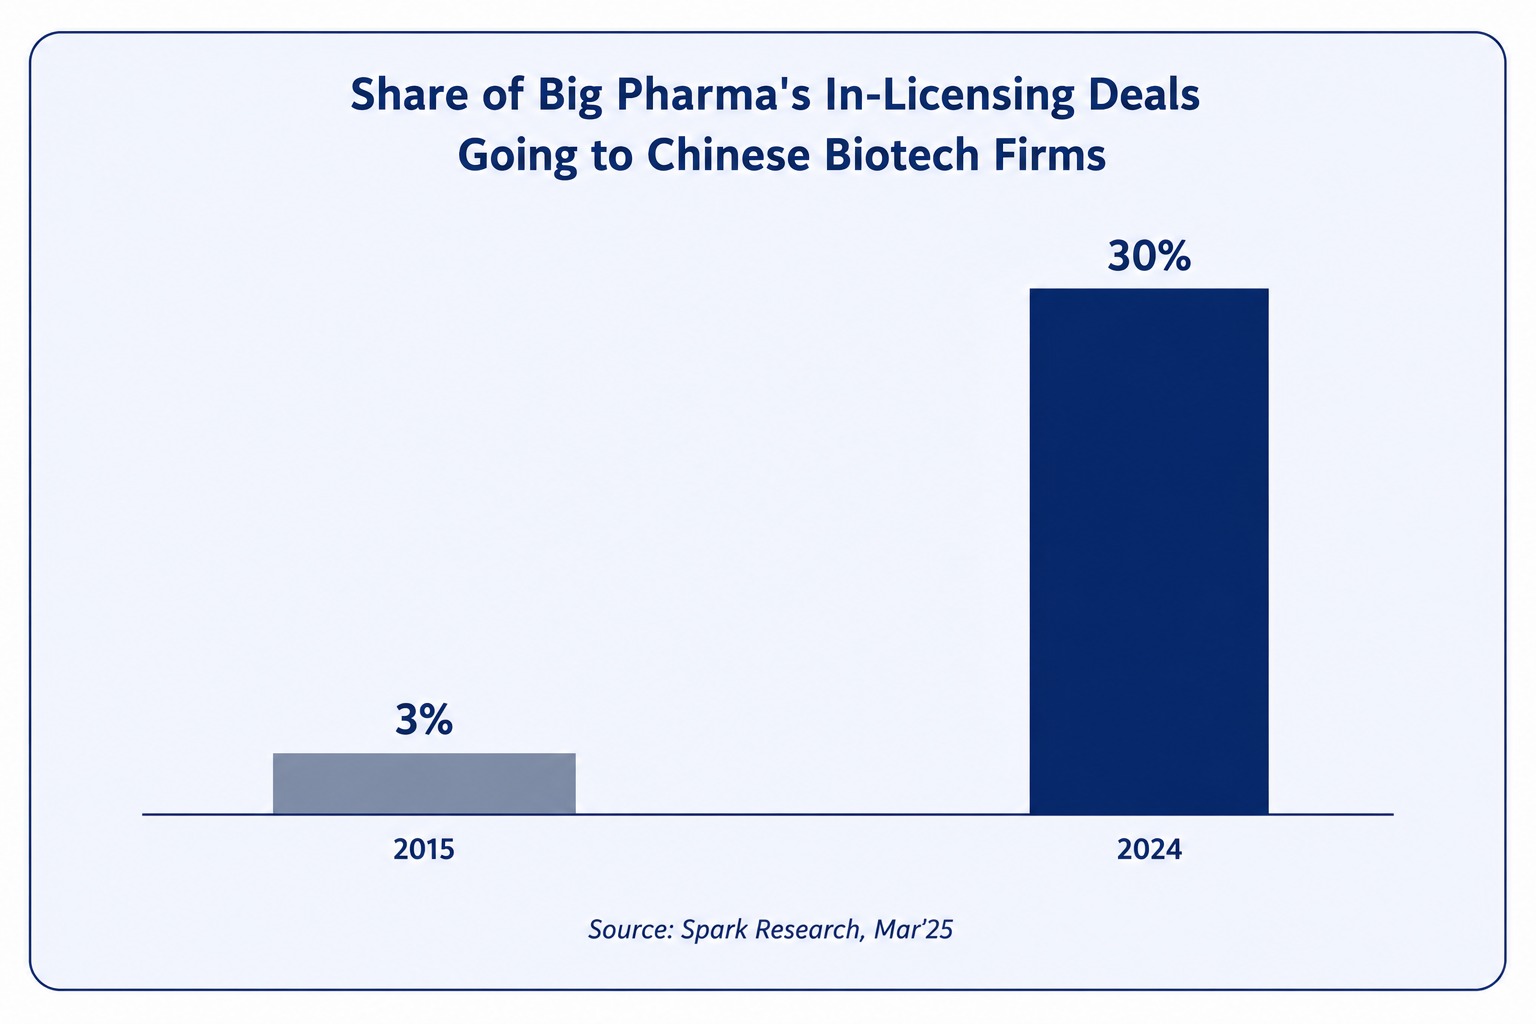
China didn’t win this business because it was low-cost. It won it because, molecule after molecule, it kept its word.
By 2024, big pharma companies were licensing Chinese-discovered drugs directly – skipping American investors altogether. Washington is now trying to legislate away a dependency that American pharma built on its own, simply because it worked.
CHAPTER 5
Depending heavily on one country’s supply chain was just how the industry worked – until COVID asked an uncomfortable question: what happens if the one factory making a critical ingredient can’t ship it?
The pandemic didn’t create that weak spot. It exposed one that had been building for years, and gave boardrooms a new shorthand: China+1. Not ‘leave China’ – its capacity is too large to replace – but ‘never be completely dependent on it again.’
This was never really a China story. It was a concentration-risk story that happened to be about China.
Which means the shift away from China was already quietly underway, years before Washington put anything into writing.
CHAPTER 6
The BIOSECURE Act is a US law that stops the American government from contracting with, or funding, a specific list of Chinese biotech companies. It’s the loudest confirmation of a shift already underway – not where the shift began. Its path to becoming law is also a lesson in how slowly geopolitics usually moves in pharma, right up until it briefly didn’t:
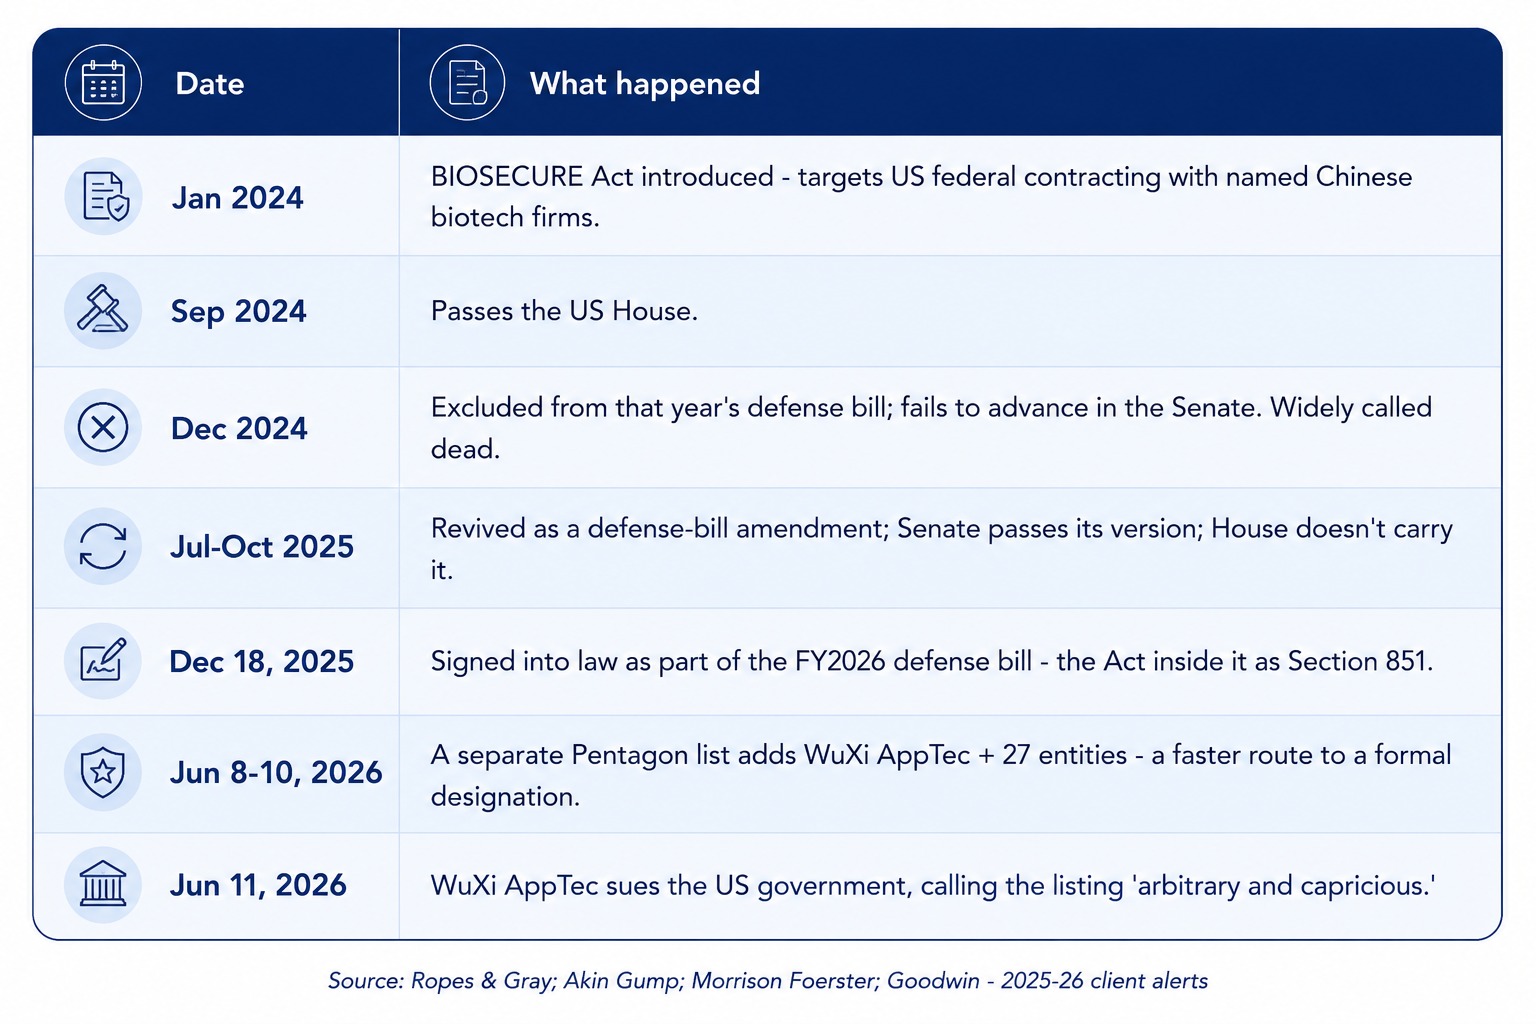
A company got listed, then sued the government – inside 72 hours. But what the law actually restricts is narrower than the headlines suggest: US federal agencies can’t buy from, contract with, or fund a company designated a ‘company of concern.’ It does not touch private, US-to-China commercial deals.
And the clock moves slowly – the government has a full year just to publish its list, and some restrictions won’t fully apply for almost 970 days after signing. Betting on an overnight shift means betting on the wrong timeline. Notably, WuXi Biologics wasn’t named at all – a caution against betting on business that hasn’t legally ‘spilled over’ yet.
CHAPTER 7
The scarce resource was never manufacturing capacity. It was qualified manufacturing capacity – and qualification cannot be rushed by writing a bigger cheque.
A factory only becomes a real business asset after clearing a sequence that simply cannot be compressed:
That is the real bottleneck behind every China+1 headline – not empty floor space, but the years it takes to turn that floor space into a factory regulators and customers actually trust. The companies best placed to benefit are, by definition, the ones who started walking through that gate the earliest.
CHAPTER 8
This isn’t ‘India replaces China.’ China’s headcount in this industry is roughly 5 times India’s, and that gap won’t close in a few years. The more accurate, narrower claim: India is becoming one of a small number of credible alternatives, in a world that wants more than just one supplier.
The foundation
Track record – two decades of clean inspections in complex, high-difficulty chemistry.
The gap
The industry’s growth has been shifting toward biologics – medicines made from living cells rather than chemistry. That is exactly where India is thinnest.
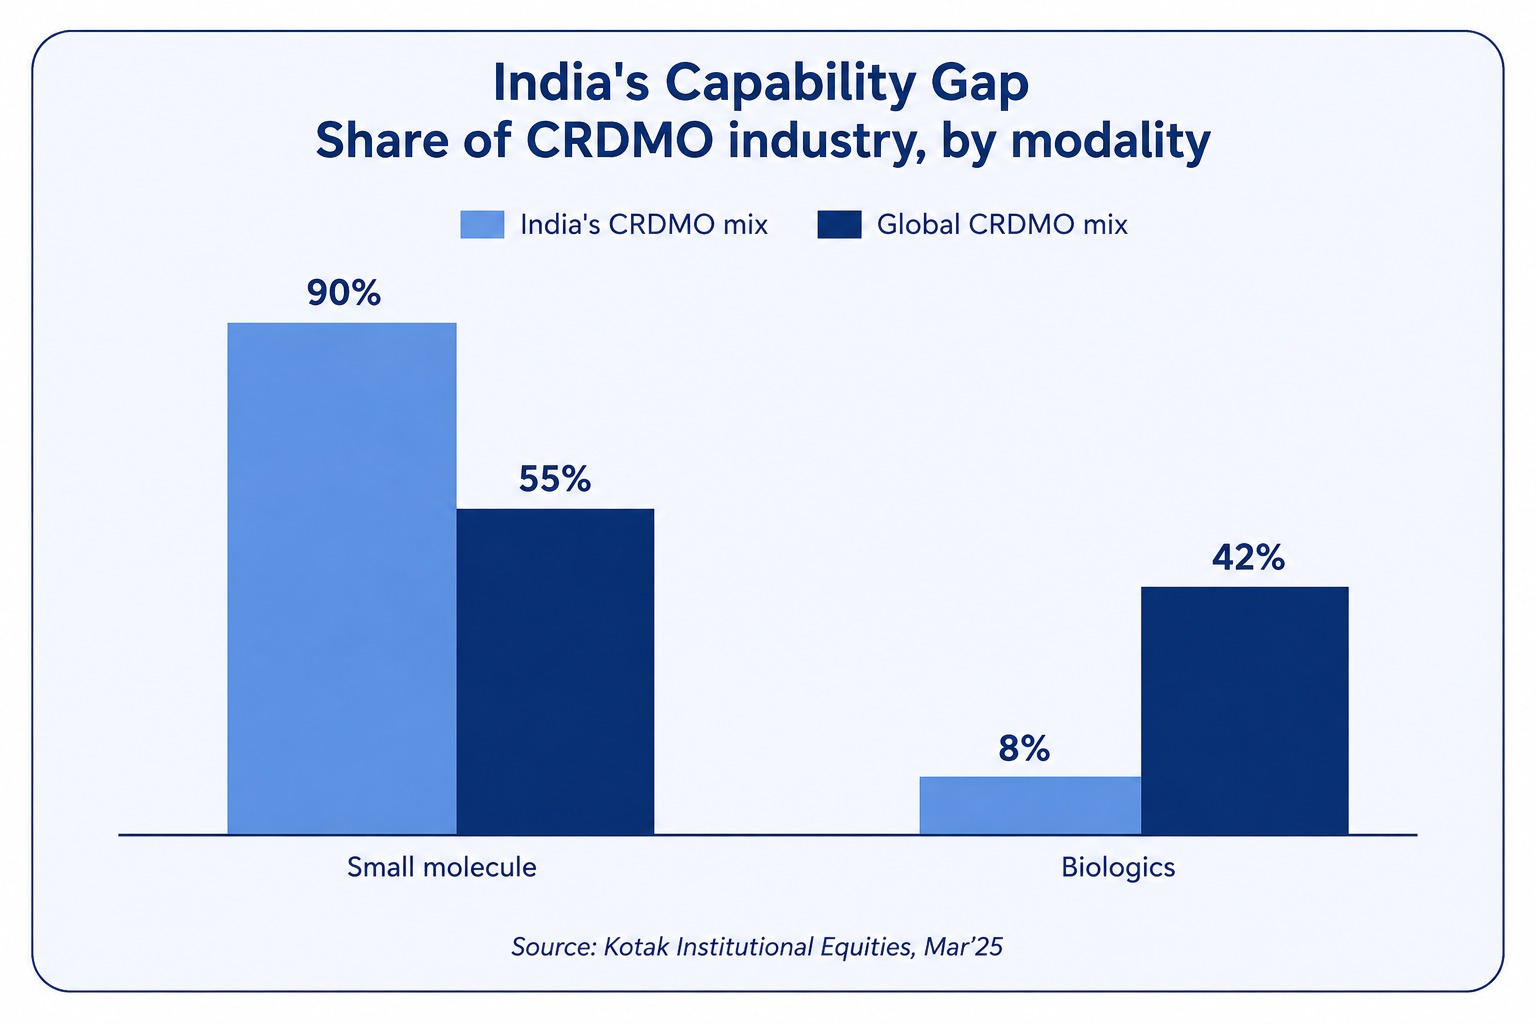
That gap is closing, partly through capital and partly through acquisitions – Suven Pharma buying NJ Bio for antibody-drug capability follows the same playbook WuXi AppTec itself used for fifteen years.
Who’s actually built this
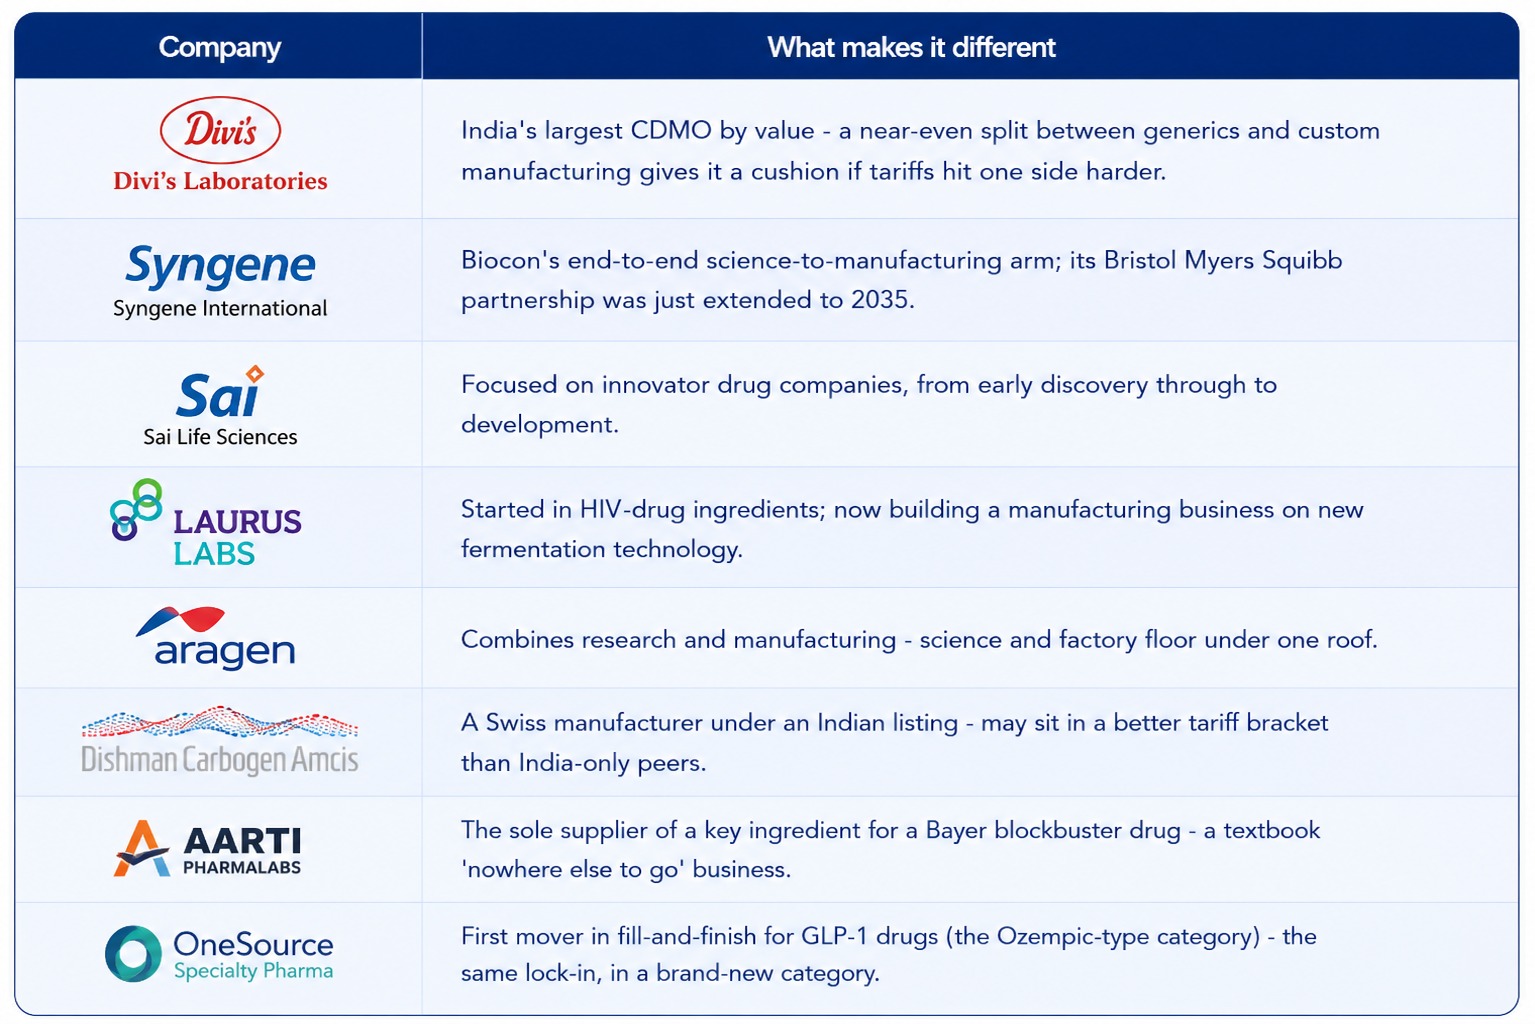
The global names sitting above all of them: Lonza, Samsung Biologics, Fujifilm Diosynth, Thermo Fisher, Siegfried – and, at the centre of the geopolitical story, WuXi.
The twist almost nobody is pricing in
In April 2026, a separate US tariff placed a 100% duty on patented-drug ingredients. The UK got 0%. The EU, Japan, Korea and Switzerland got 15%. India got no special treatment at all – grouped with China in the same 100% bucket.
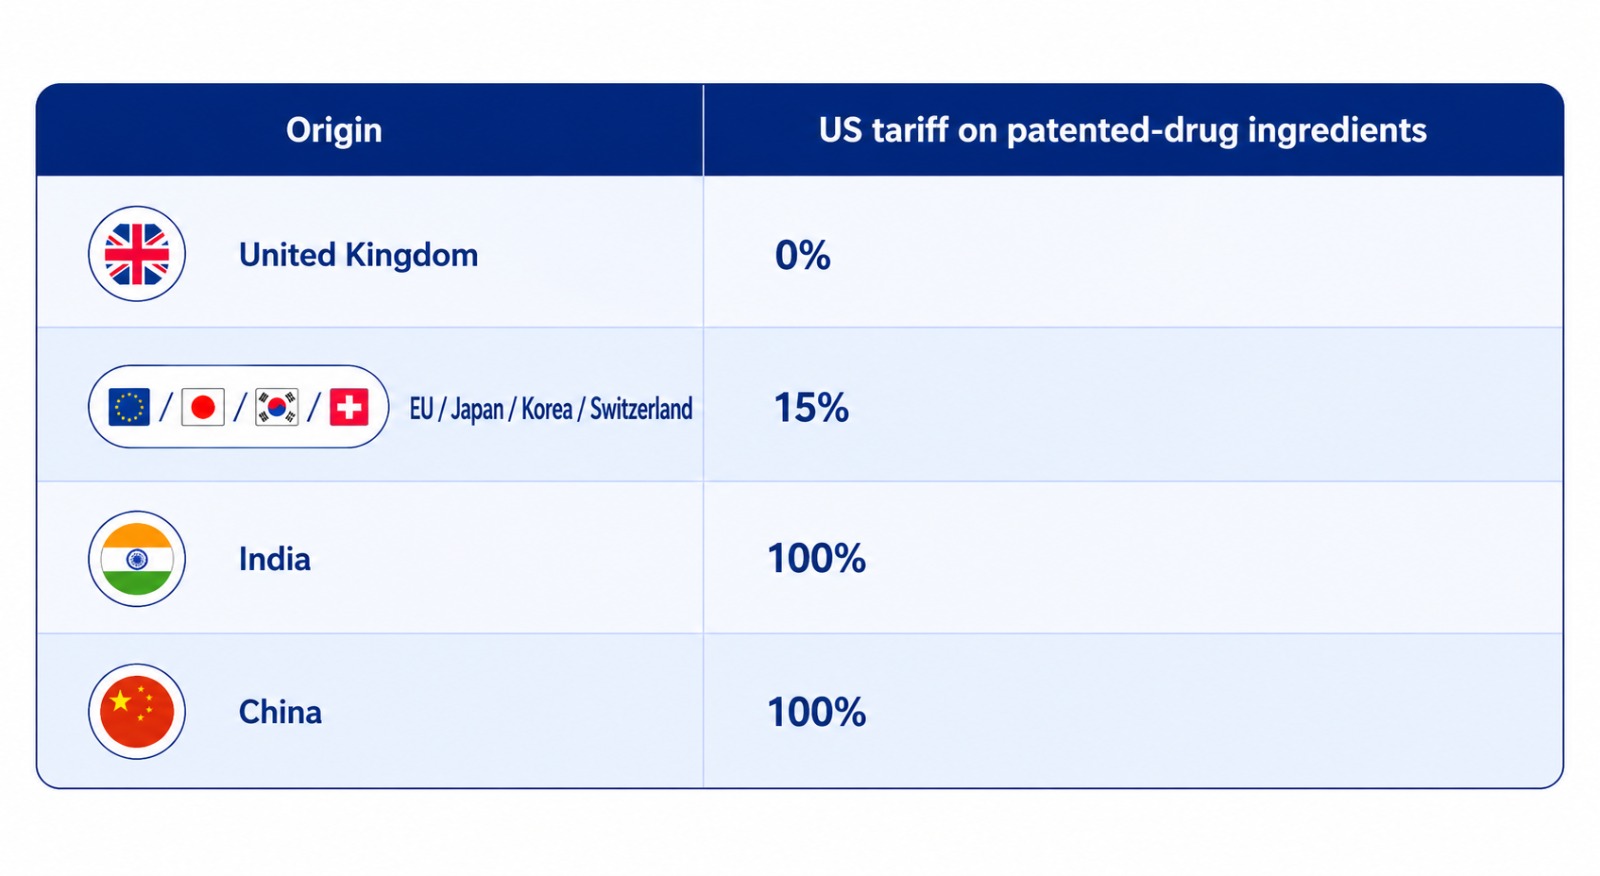
Right now, the market is pricing India’s deep pharma relationships as a tariff risk – exactly the kind of mismatch patient capital has learned to look through before.
India’s usual 20-30% cost advantage over Europe doesn’t close an 85-point tariff gap on its own. Generic medicines are excluded for now, protecting the bulk of India’s export book. And the innovator-linked work sitting exposed today is also the work most likely to get a negotiated exemption later, given how much both governments have riding on this relationship. Two signals from the same government – worth tracking separately.
CHAPTER 9
The Investment Thesis
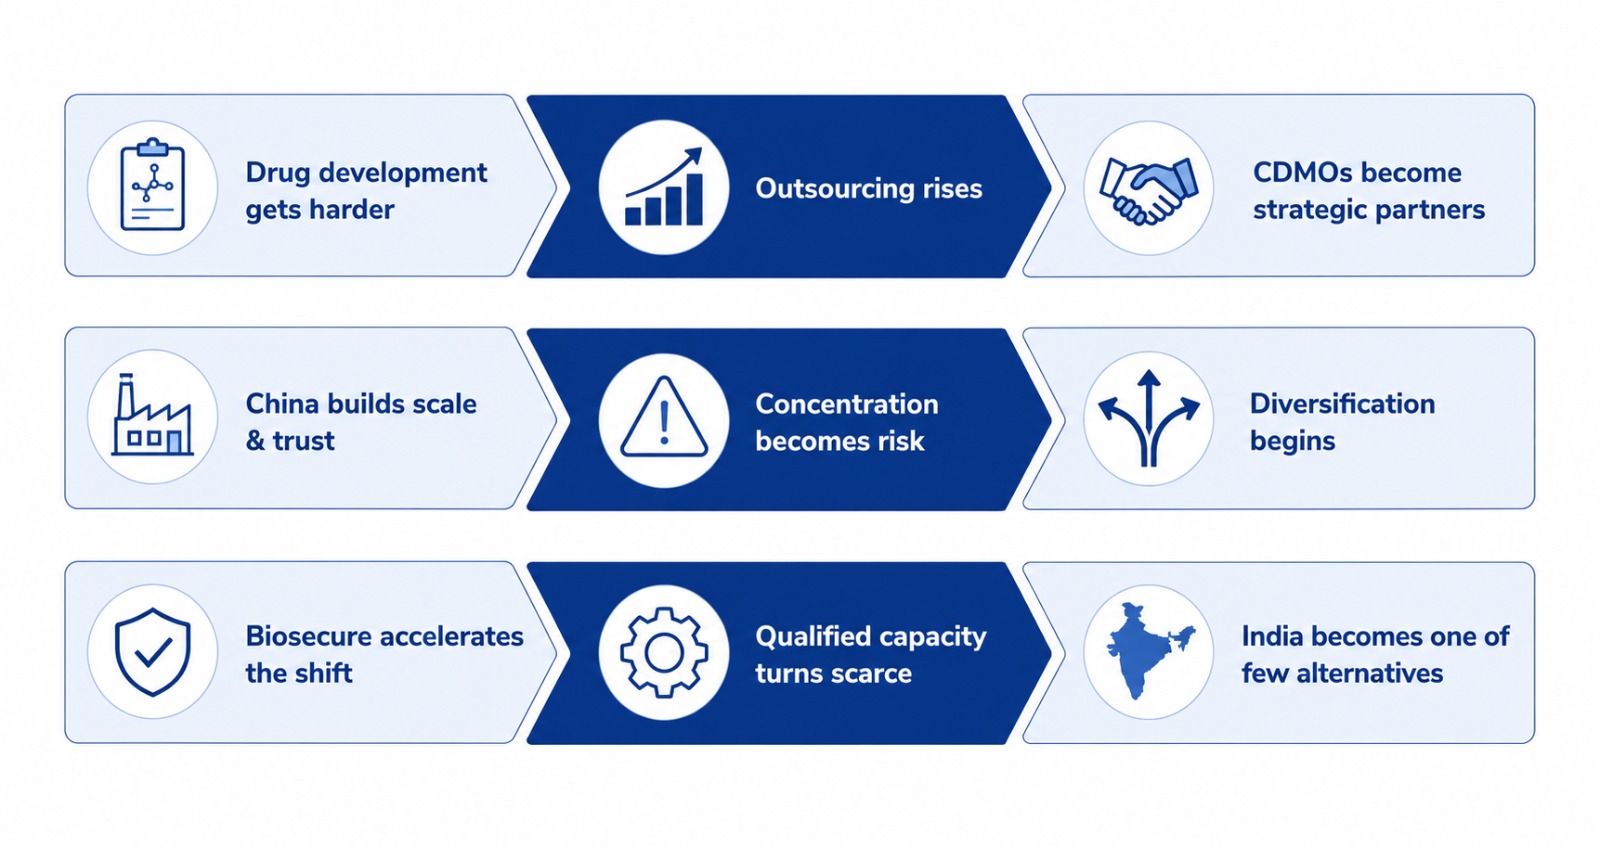
India’s own domestic engine supports this chain regardless of how Washington resolves either issue.
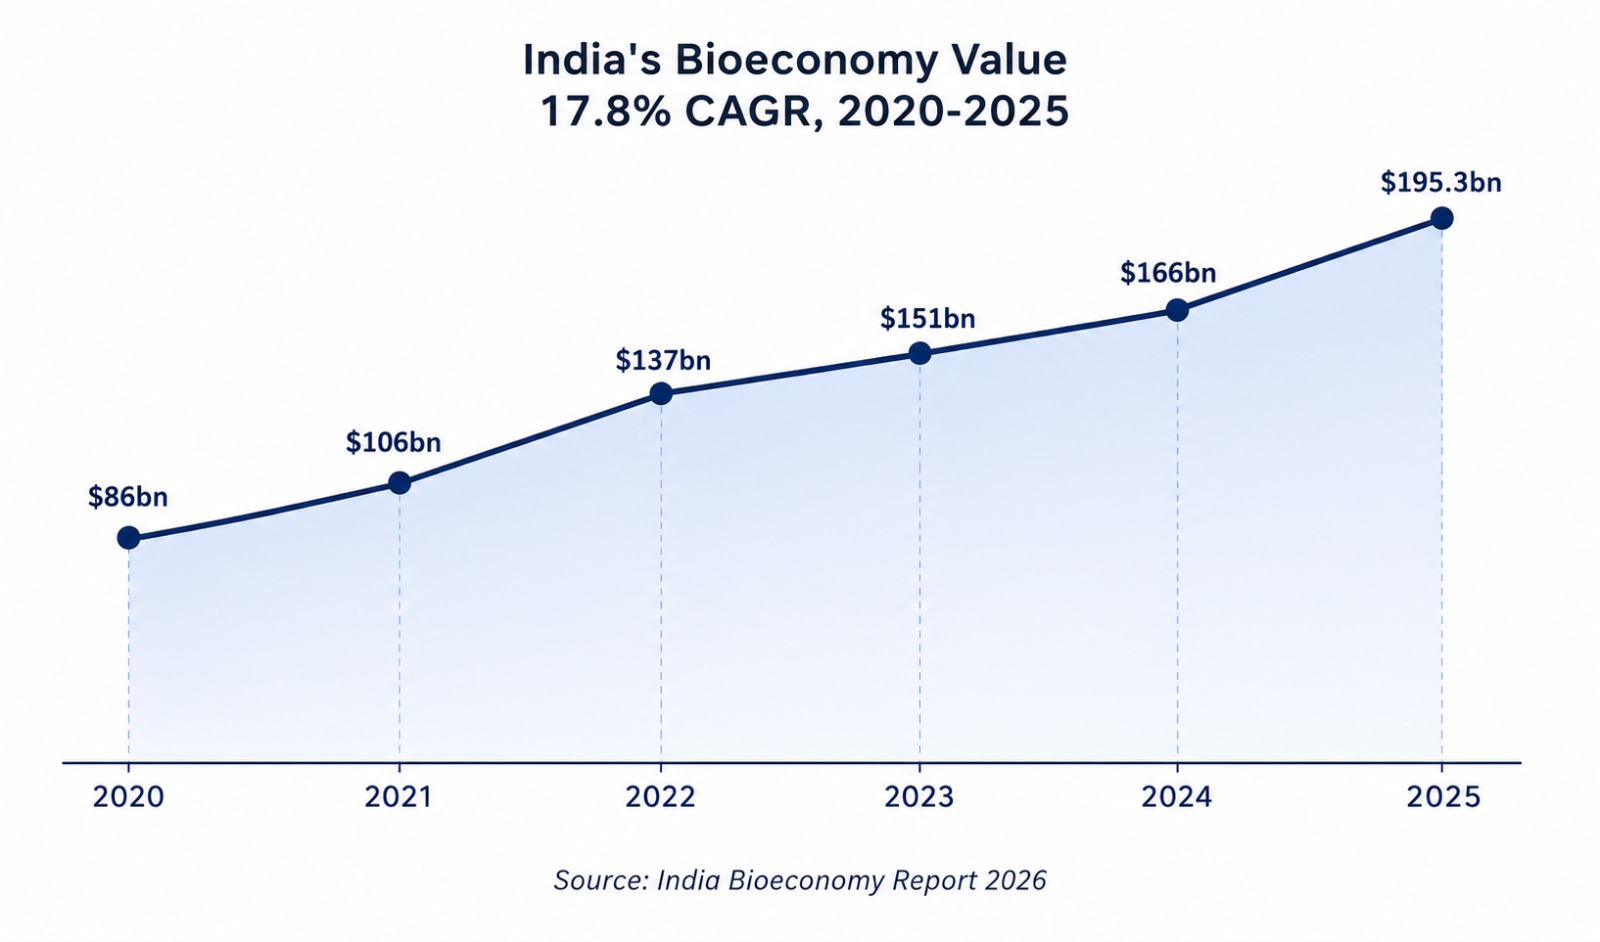
That growth happened while Biosecure sat stuck in Congress, and before the tariff even existed. Neither US policy caused it – which is the strongest reason to hold this theme regardless of how either one plays out.
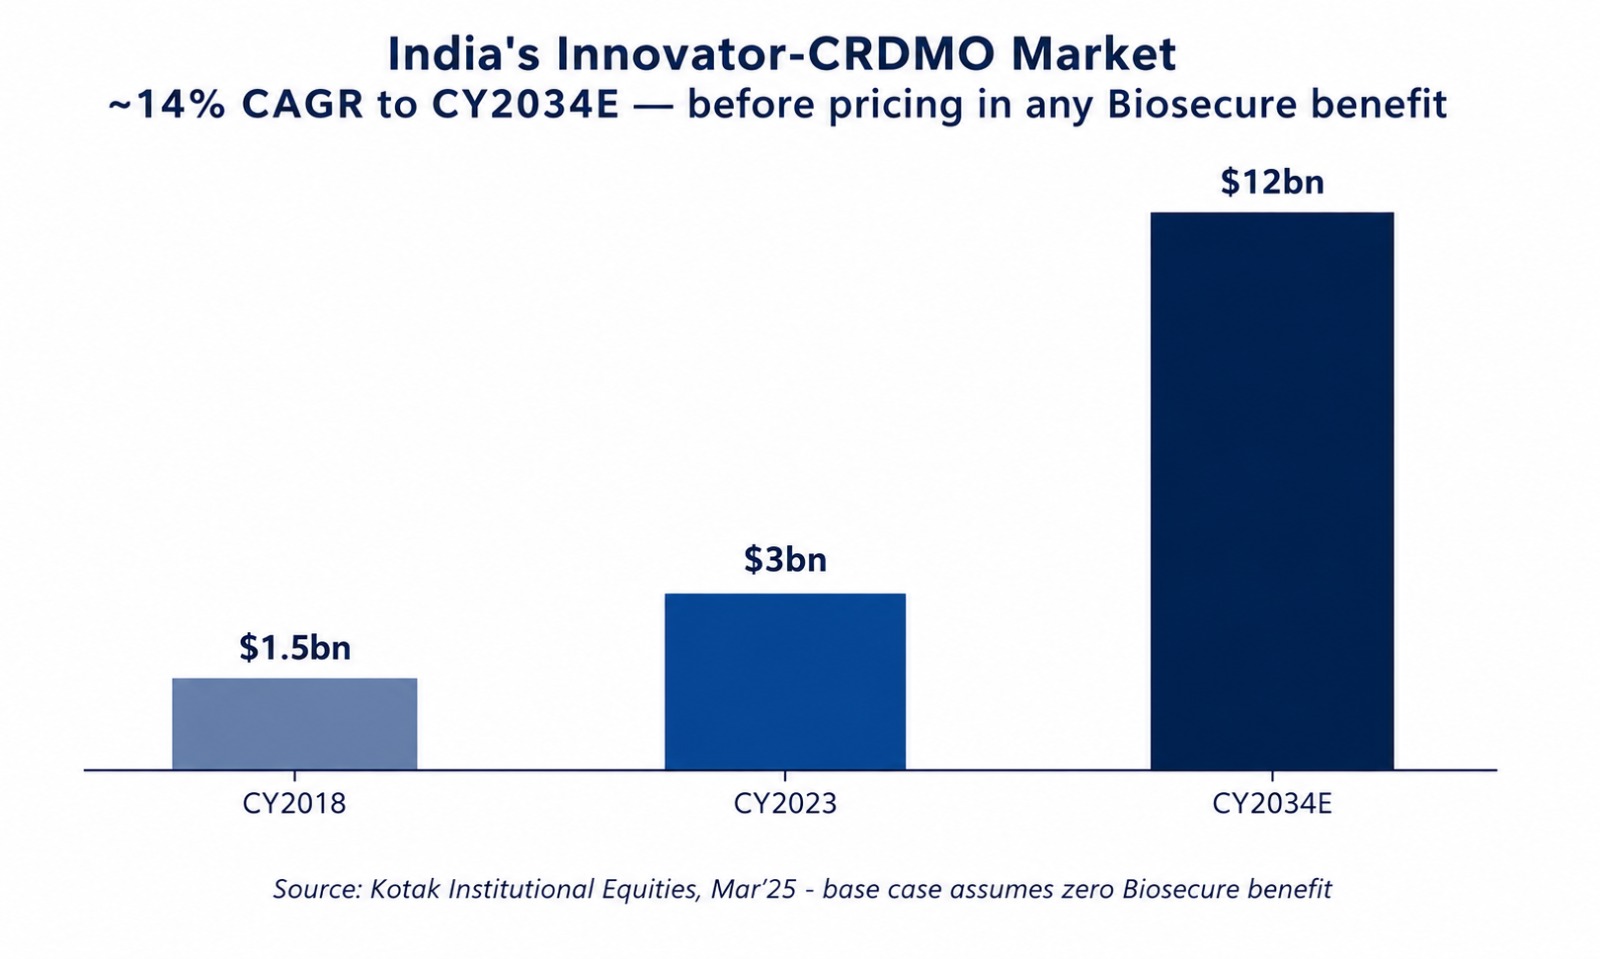
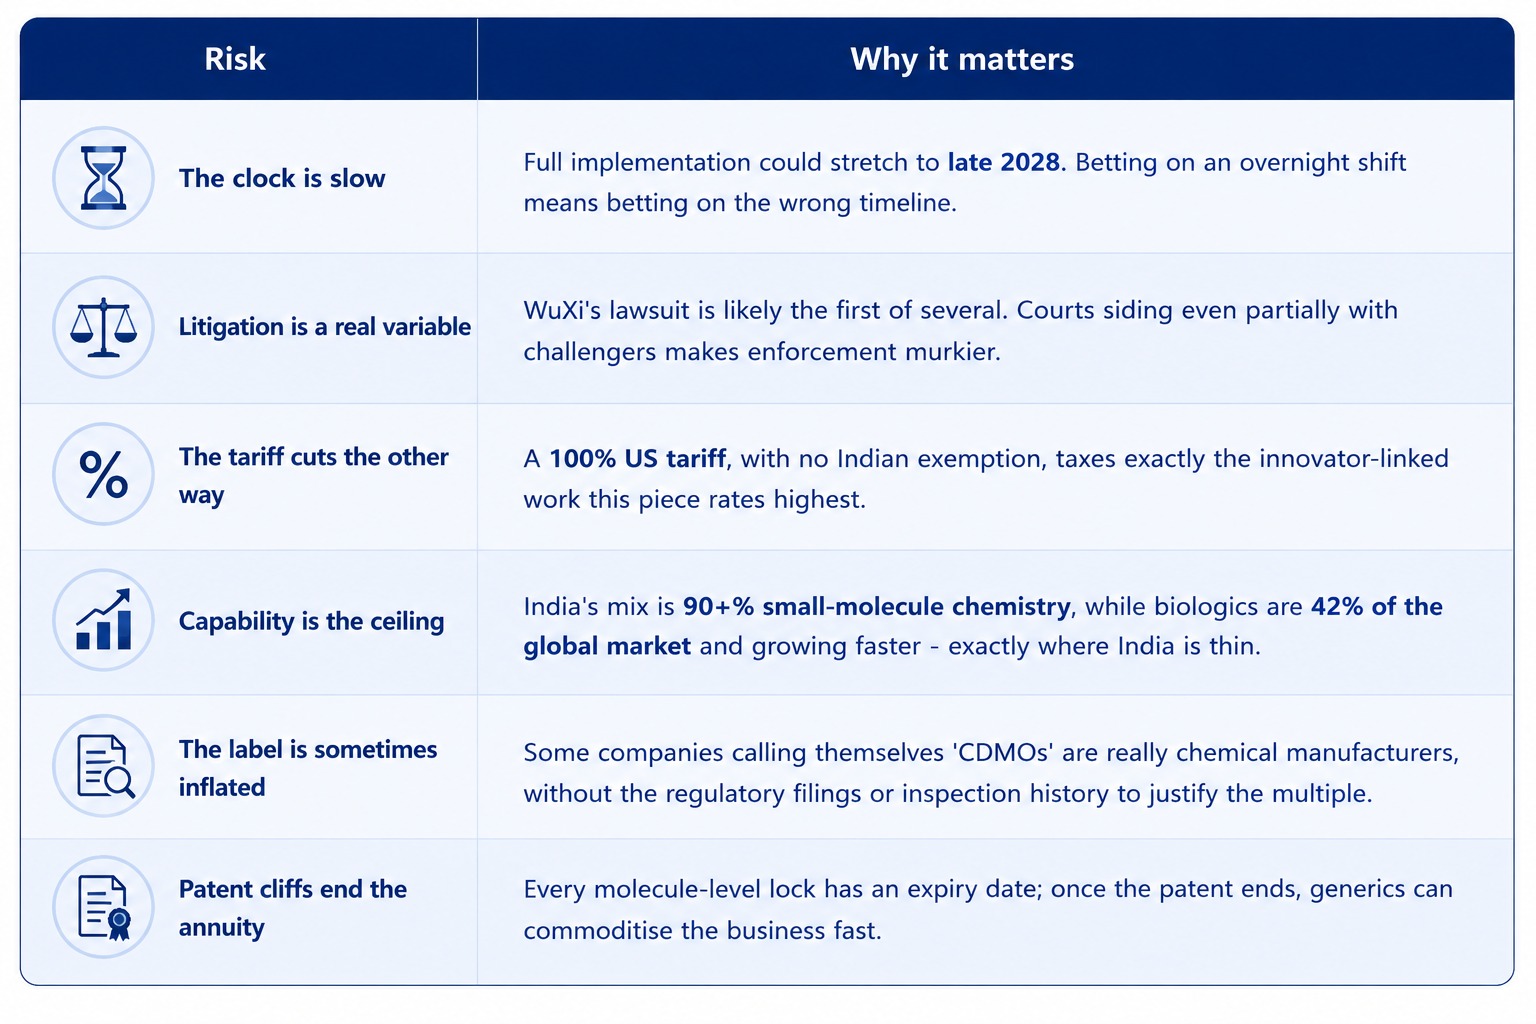
The pharmaceutical industry is quietly rewriting how medicines are made. Biosecure is one loud chapter inside that rewrite – not the plot.
The deeper shift is the rising value of three things money alone cannot rush: regulatory trust, qualified capacity, and long-term partnership between the company that invents a drug and the one that makes it. A factory can be built in eighteen months. The trust a regulator and a global customer place in one process, at one plant, takes far longer to earn – and that is the asset India’s best CDMOs have spent two decades quietly building, with or without a bill in Washington.
Electronic Manufacturing Services
CDMO Industry : India’s Medicine Growth Story
Everyone knows China dominates CDMOs. Fewer people ask why. It wasn't cheap labour. That advantage faded years ago. India doesn't need to recreate that scale overnight. It only needs to become one of the few manufacturing ecosystems global pharma is comfortable depending on.
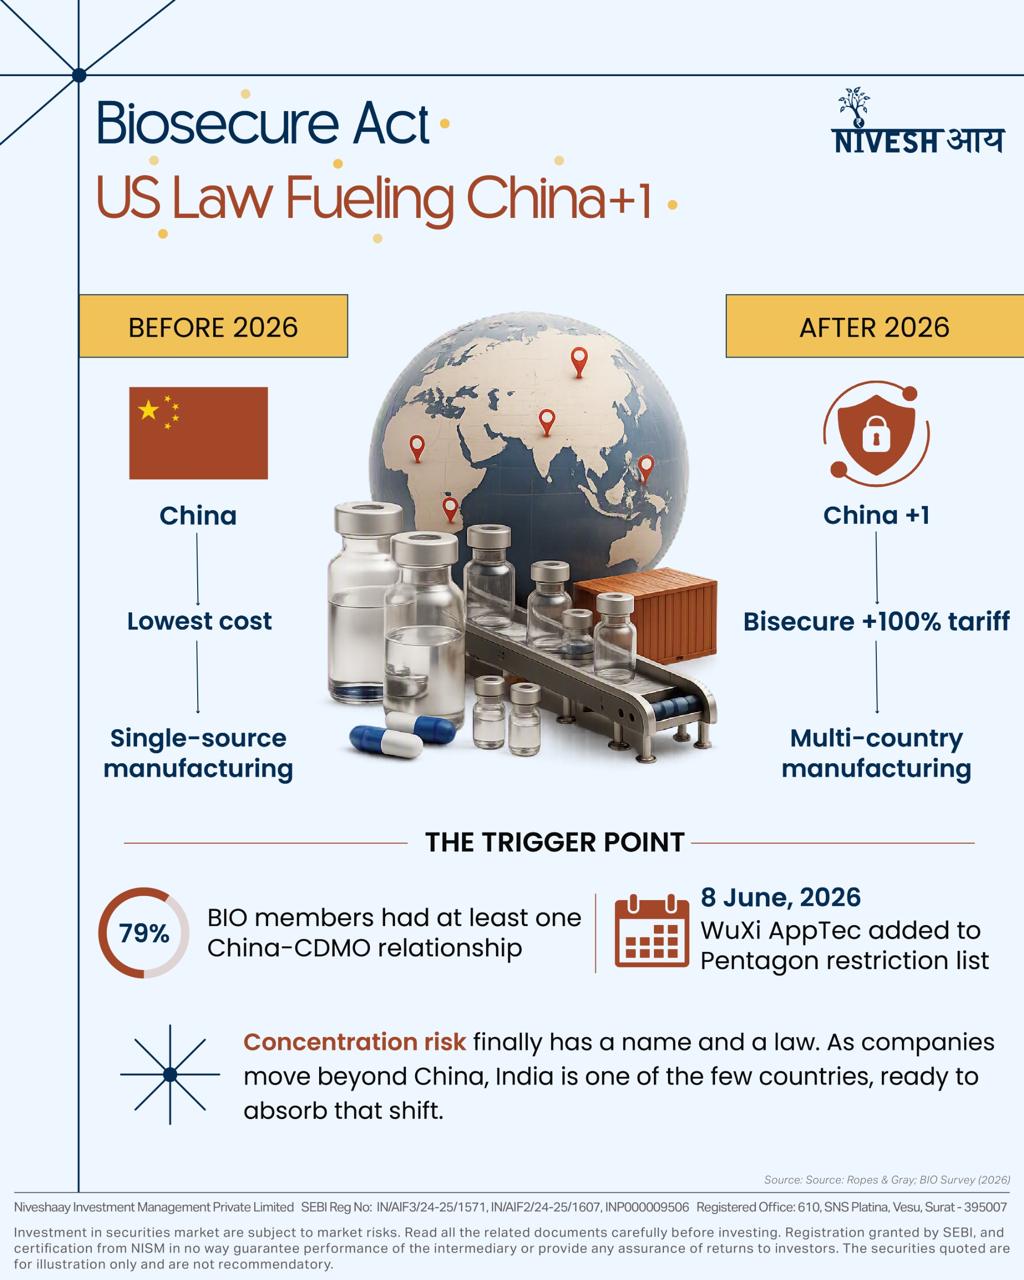
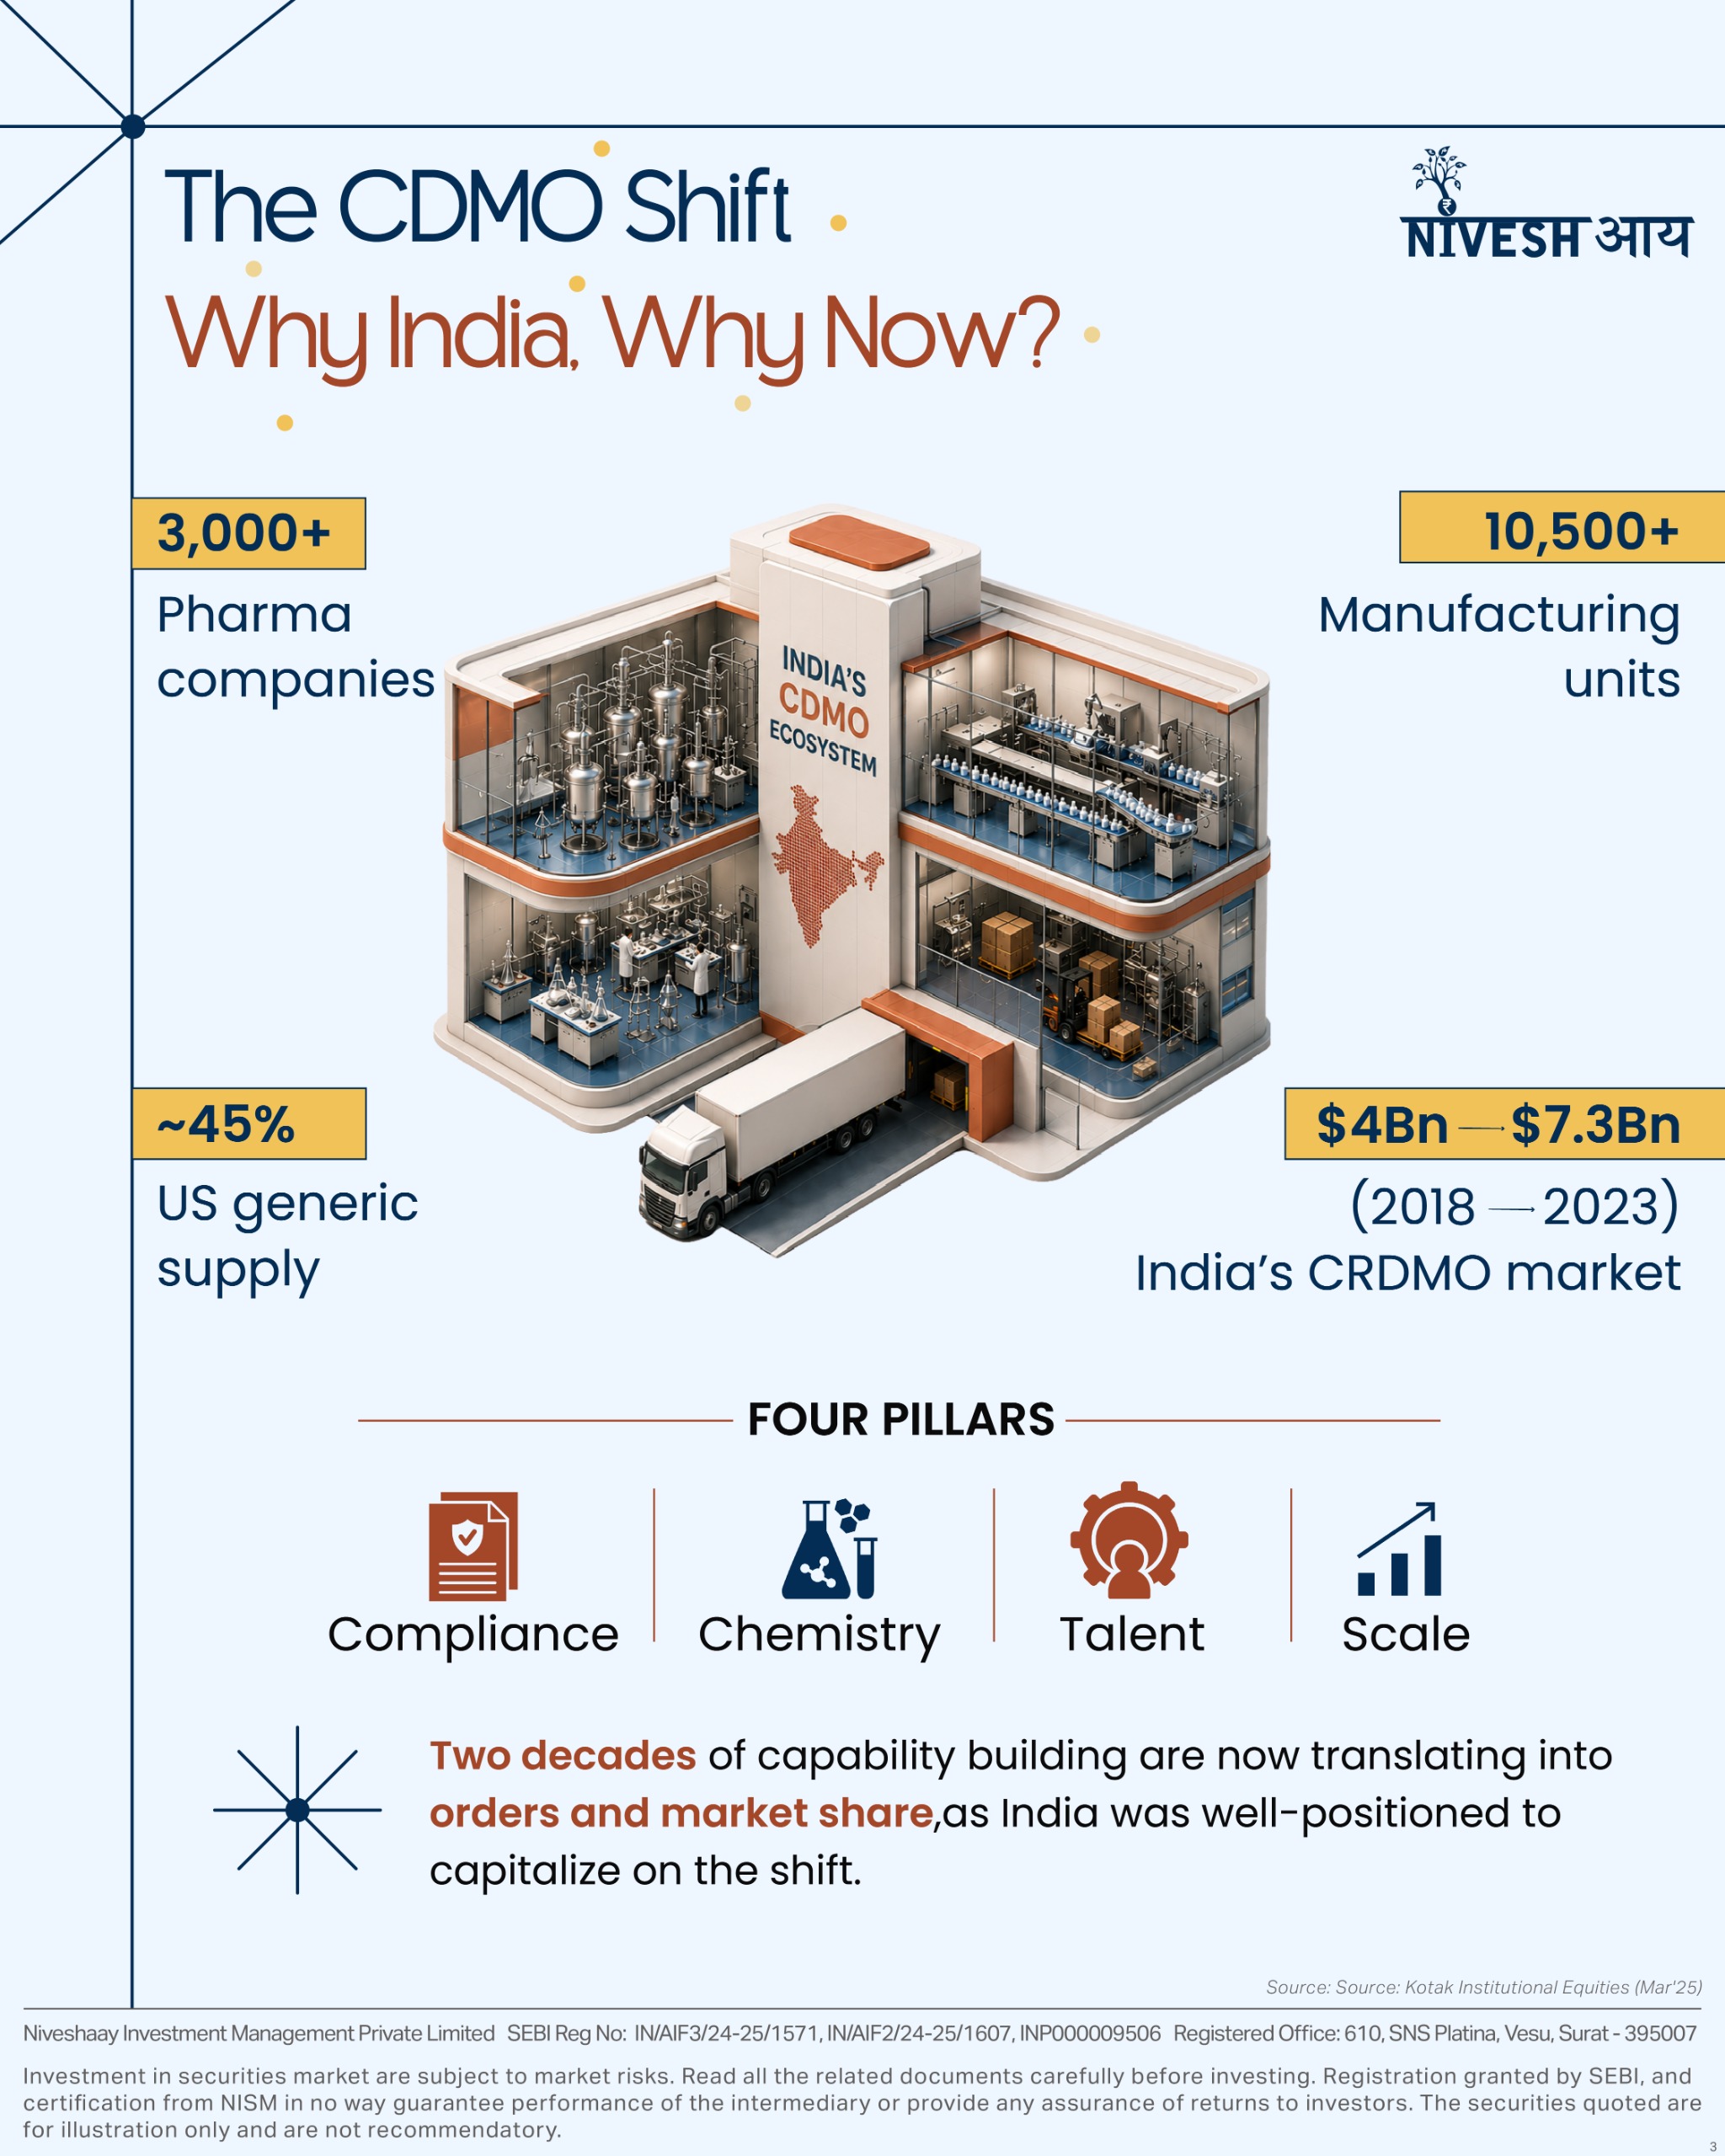
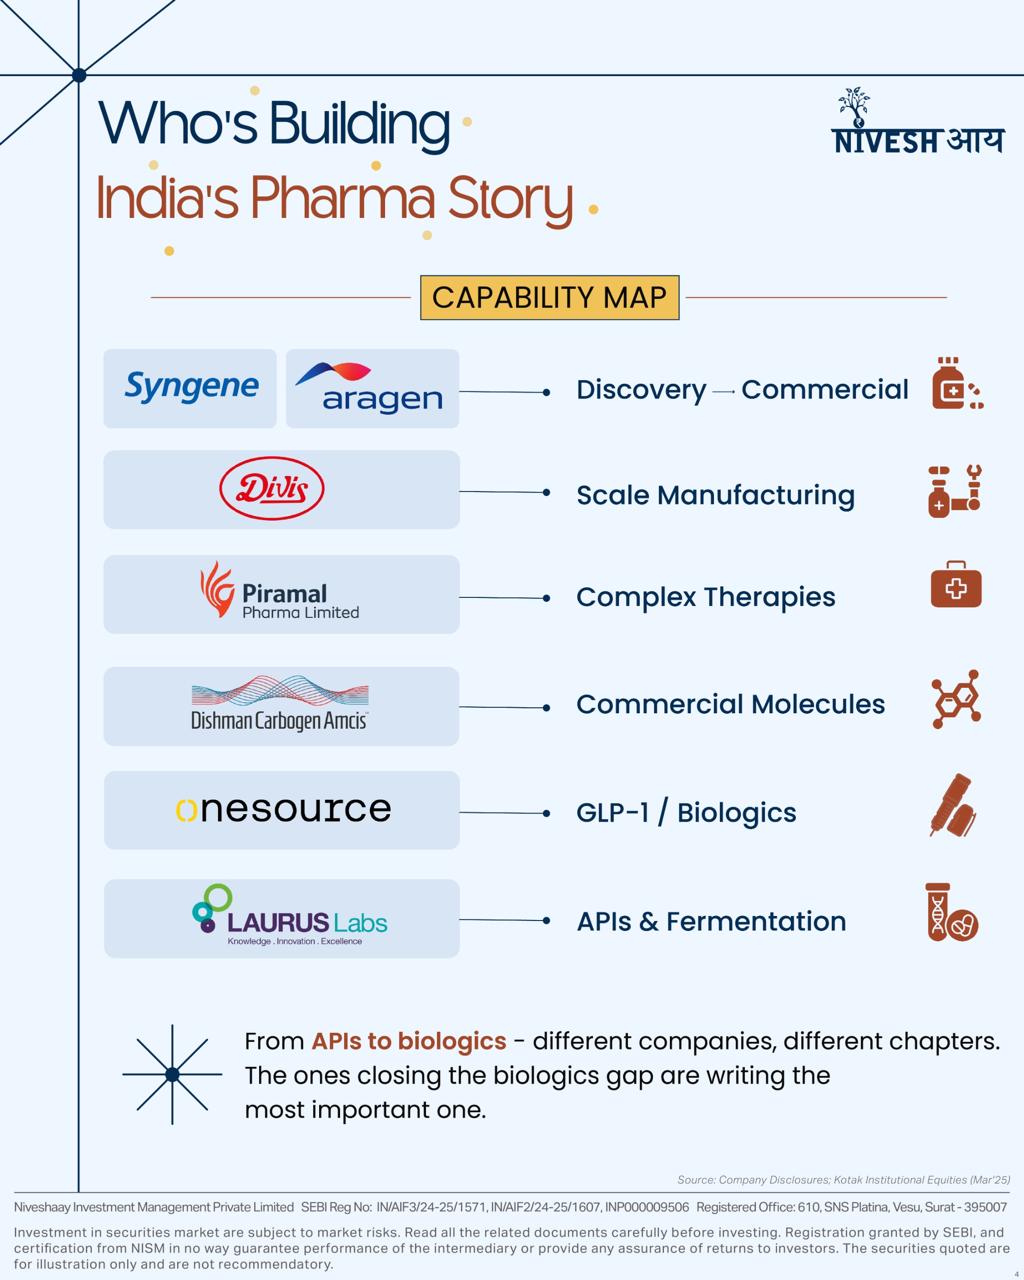
The Biosecure Act isn’t just another policy update – it could reshape the global CDMO landscape.
For decades, China dominated pharma outsourcing.
Today, geopolitical risk and supply chain diversification are pushing global innovators to look beyond a single manufacturing hub.
And India is already part of that shift way ahead of others.
• Approx. 45% of US generics supplied by India.
• India has the most USFDA-approved plants outside the US.
• A $195.3B bioeconomy, growing at a 17.8% CAGR since 2020 – independent of any US policy.
Swipe through to understand why this isn’t just about the Bio secure Act – it’s one of the biggest structural shifts shaping the future of global pharma.
To READ in detail click here.
AI & Data Center
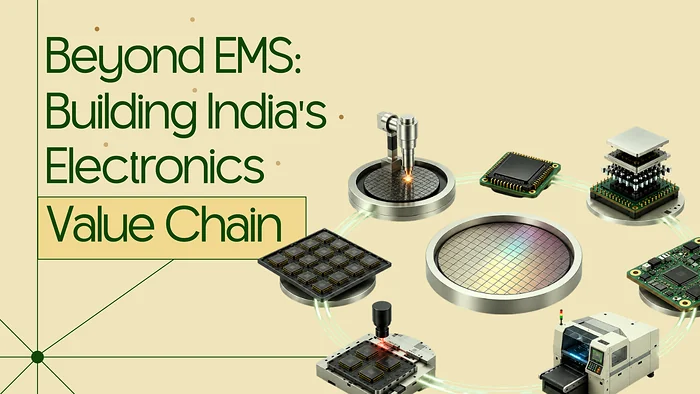
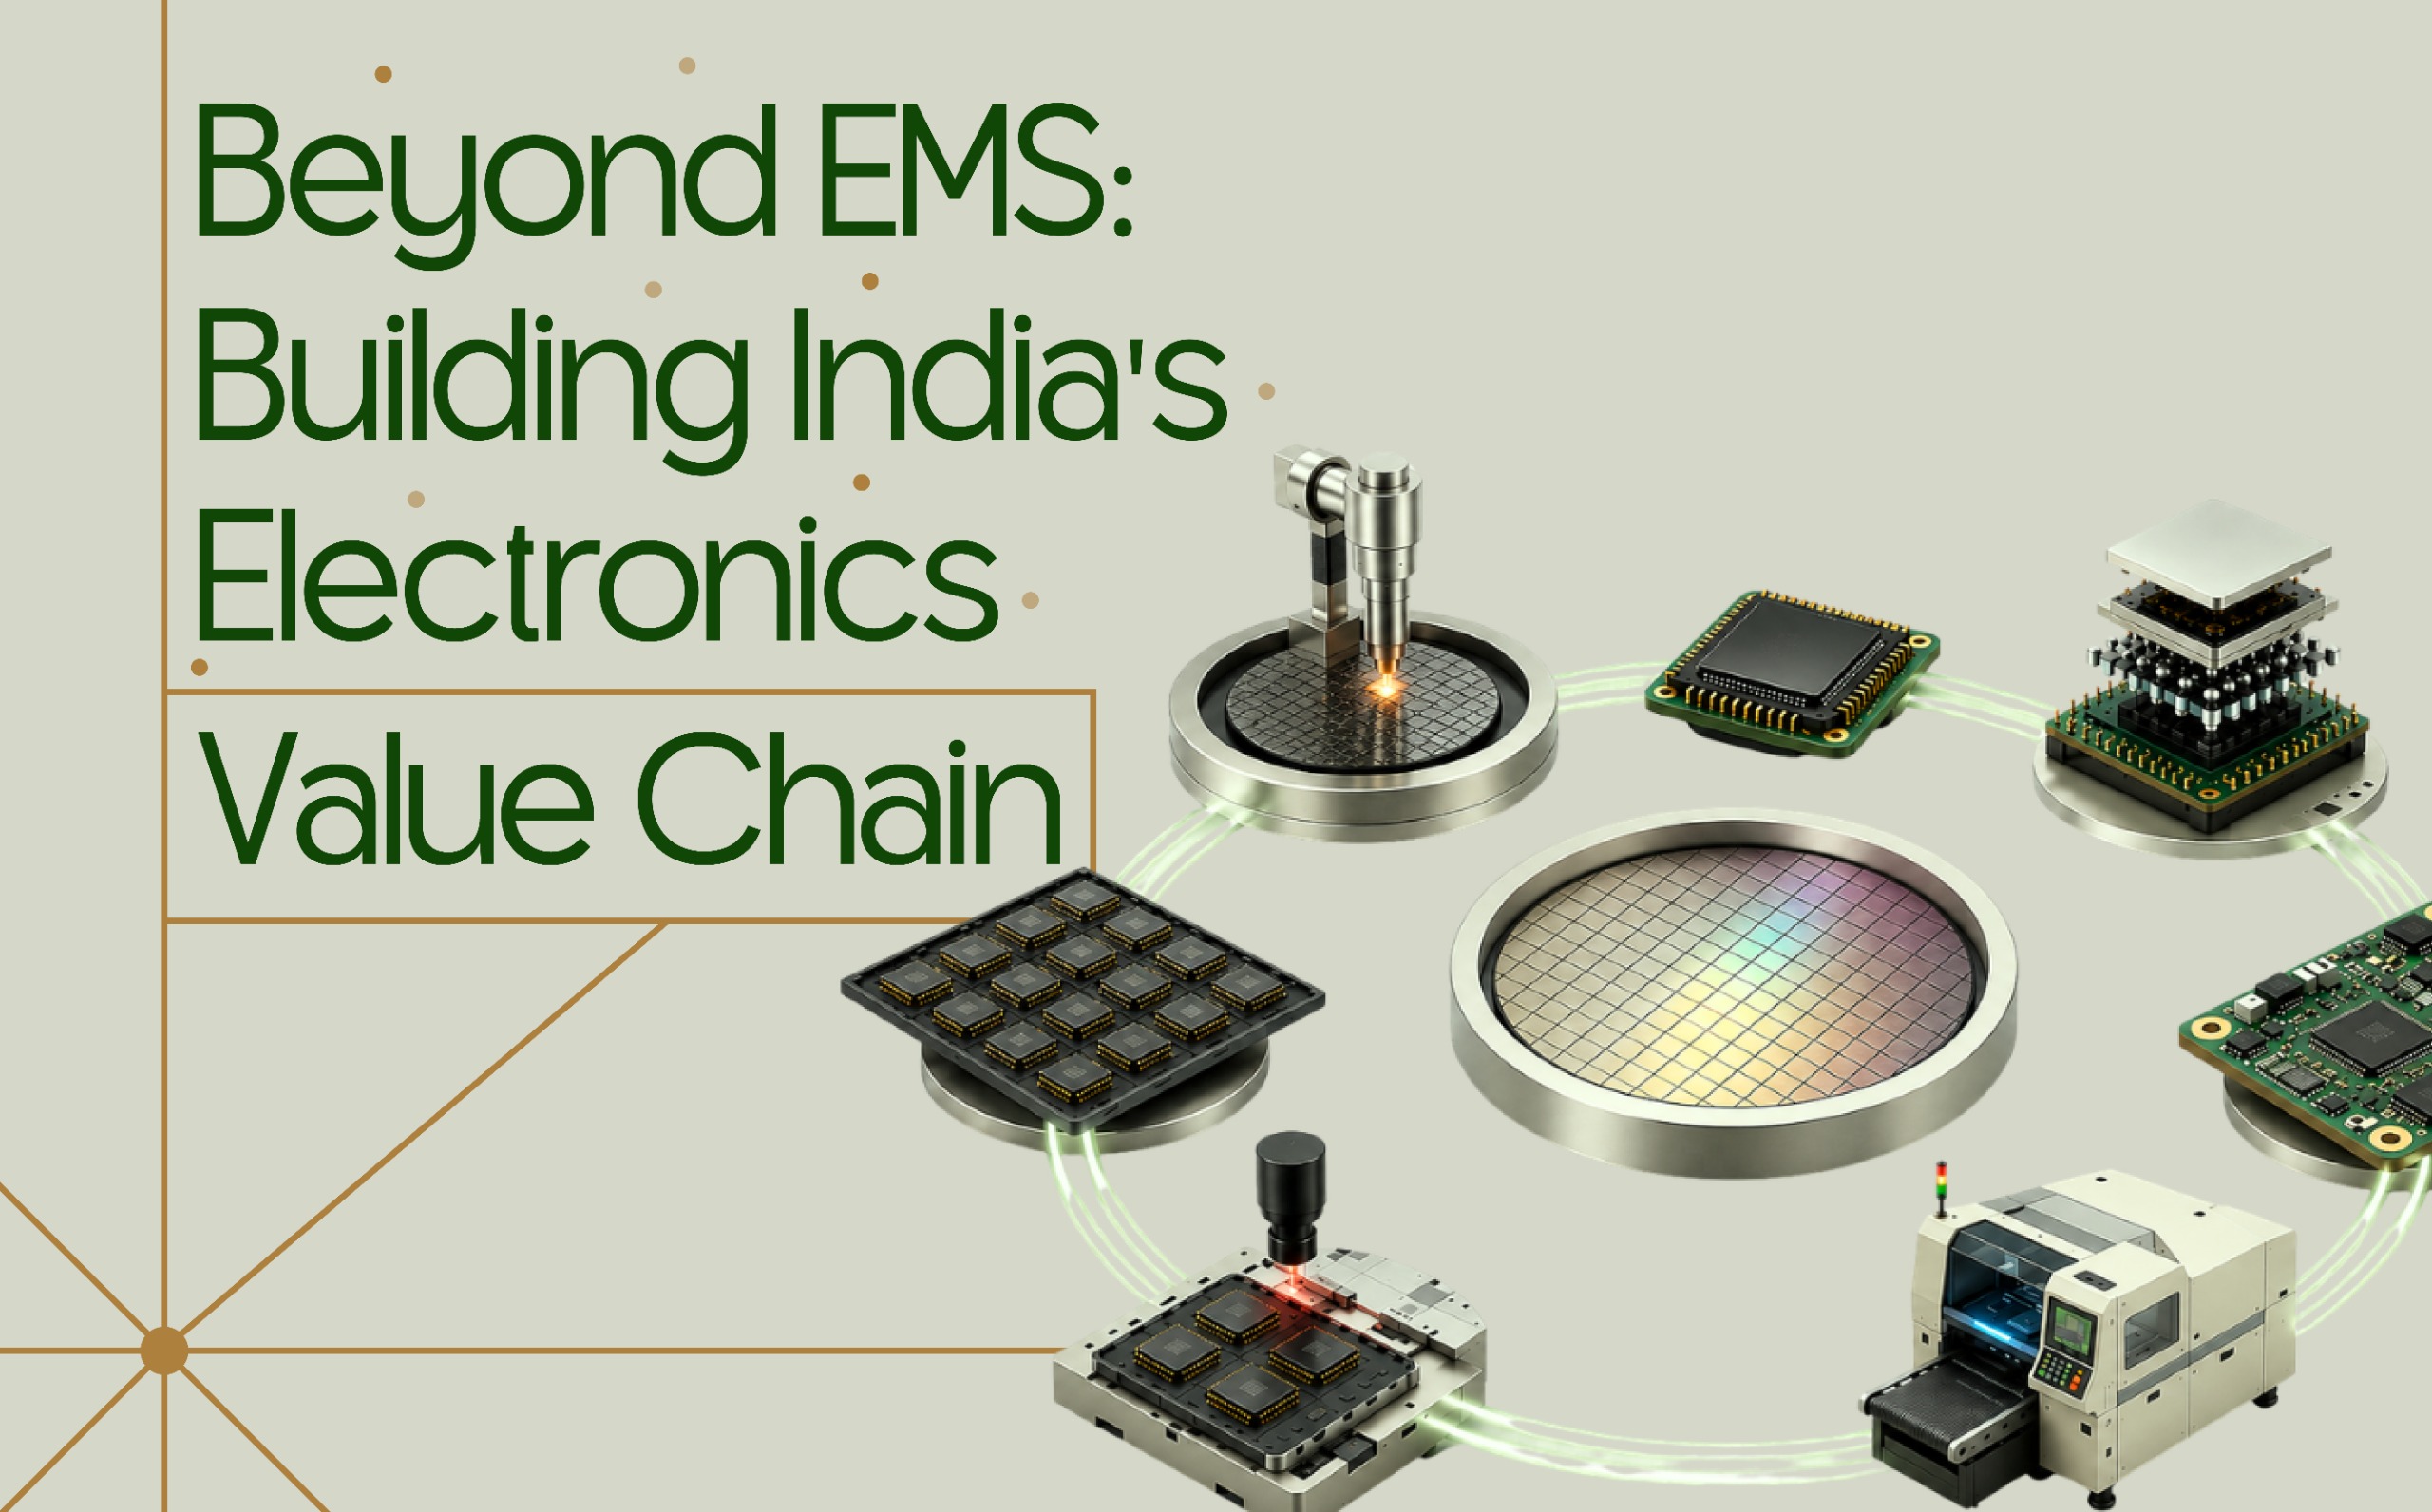
Beyond EMS: India’s Electronics Value Chain
India is moving up the electronics value chain, from assembly to components, chips, and design. Here's what's driving the shift.
For most of the last decade, India’s electronics industry meant assembly: importing components, printed circuit boards, displays, camera modules, chips, and putting them together into a finished phone, television, or appliance.
This activity is called Electronics Manufacturing Services, or EMS, and it became one of India’s genuine industrial successes.
Electronics production grew six times in a decade, from ₹1.9 lakh crore in FY15 to ₹11.3 lakh crore in FY25. Mobile phone manufacturing alone went from two plants in 2014 to more than 300 today.
But assembly sits at the lower-margin end of the supply chain. The company doing the assembling earns a thin return on each device; the larger part of the value sits upstream, in the components and the chips themselves.
For India’s electronics industry to grow beyond an assembly base, it needed to build backward into that value chain. That shift is now underway.
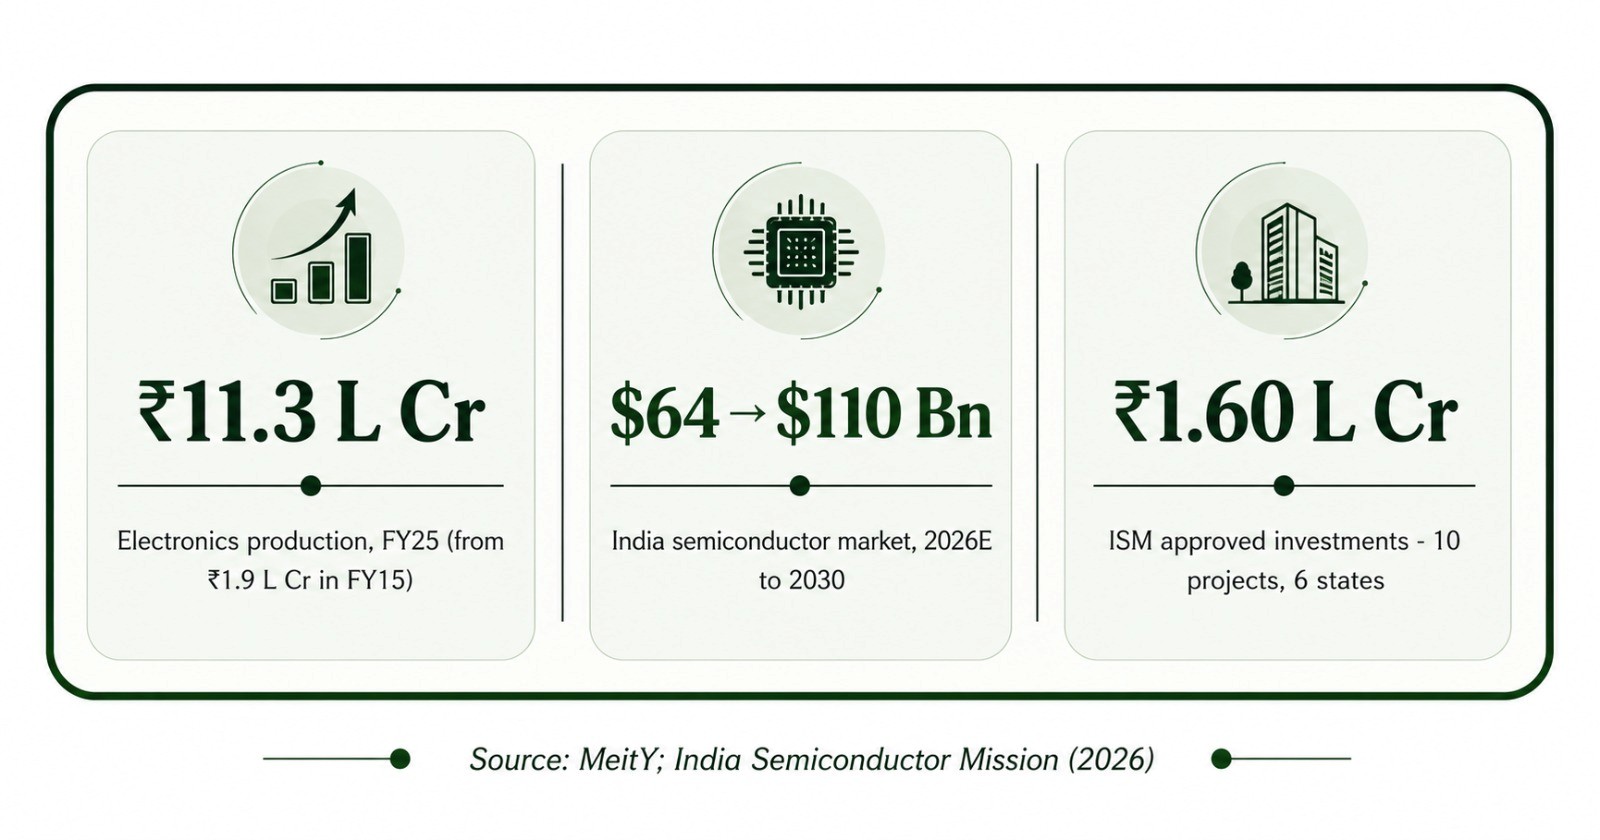
The clearest evidence of how far assembly had outpaced component manufacturing is a single figure: more than 90% of the printed circuit boards used in Indian electronic products are still imported, mostly from China, Taiwan, and South Korea.
A printed circuit board is not a minor part – it is the base almost every other electronic component sits on. For a country producing ₹11.3 lakh crore of electronics a year to import nearly all its PCBs says less about a weakness and more about how much of the value chain still sits outside the country.
This is the gap the Electronics Component Manufacturing Scheme is built to close.
A relationship that began with assembling Apple’s phones is now extending into manufacturing the components those phones are built from.
Components are one layer of backward integration. Semiconductors are a deeper one, and considerably harder to enter – chip manufacturing is more precise, more capital-intensive, and slower to qualify than assembling a finished device.
India’s entry point into this layer has not been full chip fabrication. It has been assembly, testing, and packaging, an activity the industry calls OSAT: a chip is fabricated on a silicon wafer inside a cleanroom, then cut apart, mounted, wire-bonded, and sealed into the package that ends up inside a phone or a car.
It is where India’s semiconductor mission chose to begin, because it needs less capital than a fabrication plant and can be brought online faster.
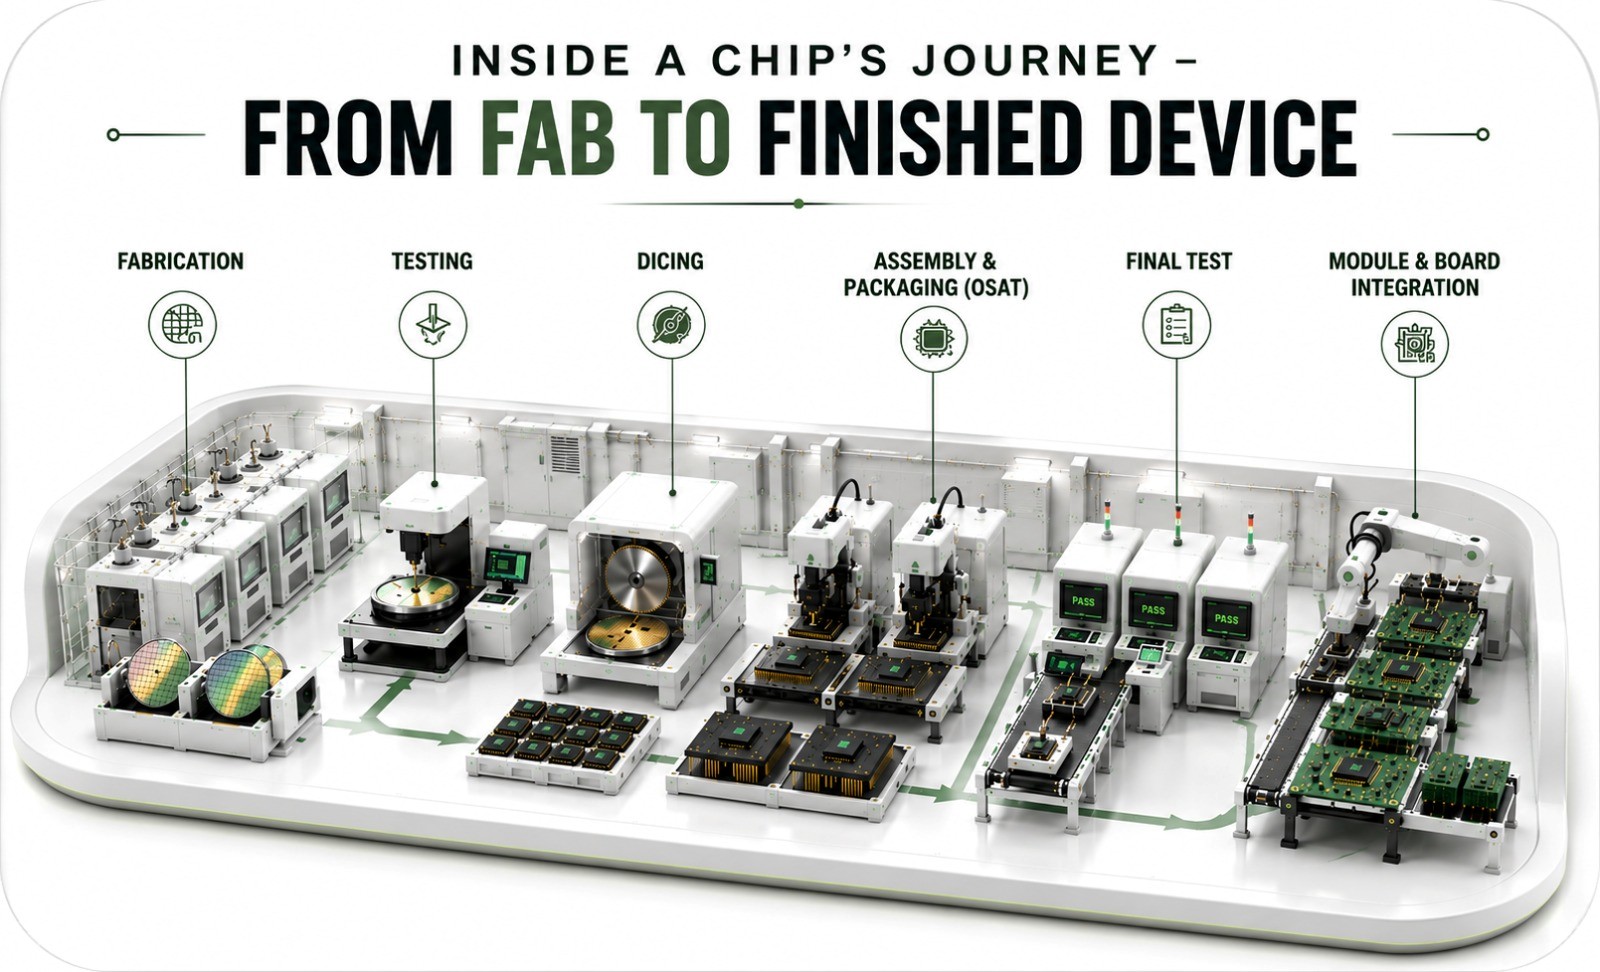
Micron, Sanand, Gujarat began partial production in early 2025, India’s first advanced semiconductor packaging line, backed by roughly $825 million of its total $2.75 billion India investment.
Kaynes Semicon, also in Sanand, built its OSAT facility from groundbreaking to commercial production in 14 months, a genuinely fast timeline for anything resembling a chip plant.
CG Power’s OSAT line, running since August 2025, already processes 500,000 chip units a day, with a roadmap toward 14.5 million a day at full capacity.
Fabrication itself, the stage before OSAT, is the layer India is only now entering. Tata Electronics planned facility in Dholera, Gujarat, is intended to be India’s first chip fabrication plant, and its commissioning date is the single most closely watched milestone in the country’s semiconductor programme.
Tata is separately building an OSAT facility in Assam, giving the same company a position at both the fabrication and packaging ends of the process.
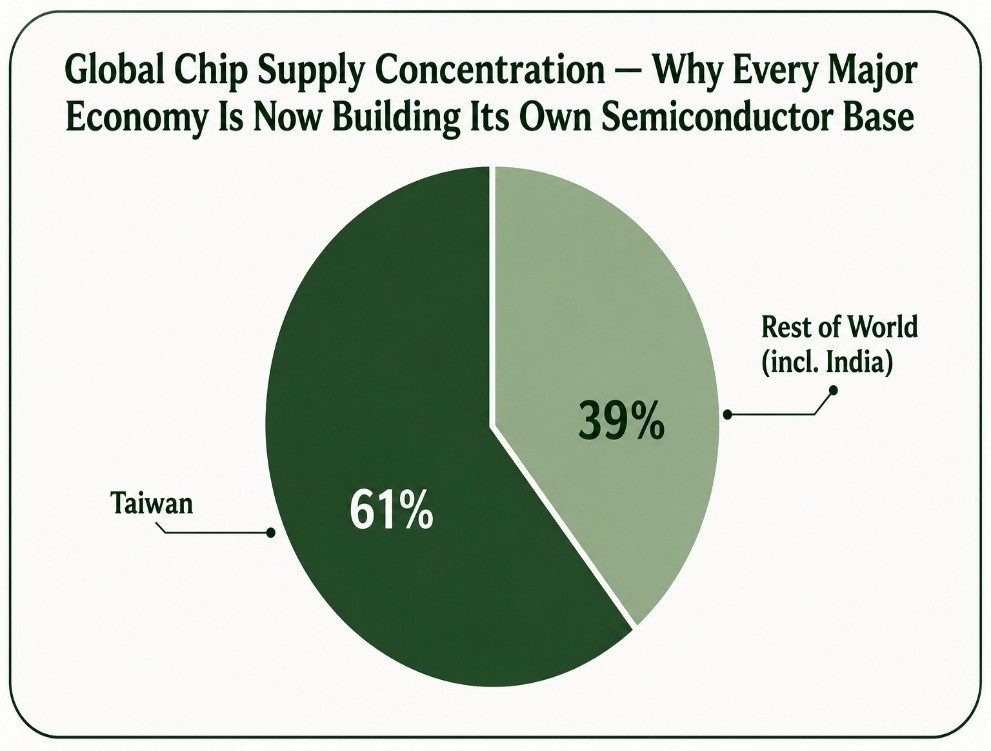
Taiwan alone produces more than 60% of the world’s chips. That concentration is a large part of why the US CHIPS Act ($52 billion),the EU Chips Act, and India’s own Semiconductor Mission (₹76,000 crore) have all emerged within a similar window – every major economy is building some form of domestic capacity, and India’s programme is one part of that wider reconfiguration.
Fabrication and packaging are the manufacturing end of the semiconductor chain. Design sits earlier and separately – deciding what a chip does before it is fabricated – and is generally the highest-margin part of the industry, since it does not require owning a factory.
India’s Design Linked Incentive scheme backs this stage directly: a performance-linked incentive of 4 to 6% of net sales turnover for five years, capped at ₹30 crore per applicant, plus subsidised access to EDA design software and fabrication slots. Since 2022 it has committed ₹234 crore across 22 companies, against a total project cost of ₹690 crore.
InCore Semiconductors, incubated at IIT Madras, licenses its RISC-V processor cores, Azurite and Calcite, to other chipmakers rather than manufacturing chips itself, a moat built on validated IP rather than capital. It has raised $3 million from Peak XV Partners.
Mindgrove Technologies, also Chennai-based, had its V2600 SoC supported under the first round of DLI and has raised $10.35 million to date, including backing from Peak XV Partners and Surge, and has reached tape-out.
Both companies show the same pattern: real capital, real tape-outs, and an IP-first or licensing model that does not require owning a fabrication plant to compete.
None of these layers, components, OSAT, fabrication, design, were built in isolation. Behind them sits a set of decisions made across roughly the last eighteen months.
Private capital has started to move alongside the policy. In 2026, a coalition of Accel, Blume, Celesta, Premji Invest, Qualcomm Ventures, and Kalaari, with NVIDIA advising, committed more than a billion dollars to India’s deep-tech ecosystem, the first-time capital at this scale has aligned specifically with the semiconductor and EMS timeline.
The move from assembly toward components, packaging, and design is visible company by company. Grouping them by the layer they operate in makes the shift easier to see than any single company profile would.
Each company below is included for a specific reason: a genuine capital commitment, a manufacturing capability, or a technical position that is difficult for a competitor to simply replicate. Companies without a clear structural story of this kind are left out, rather than filled in for the sake of completeness.
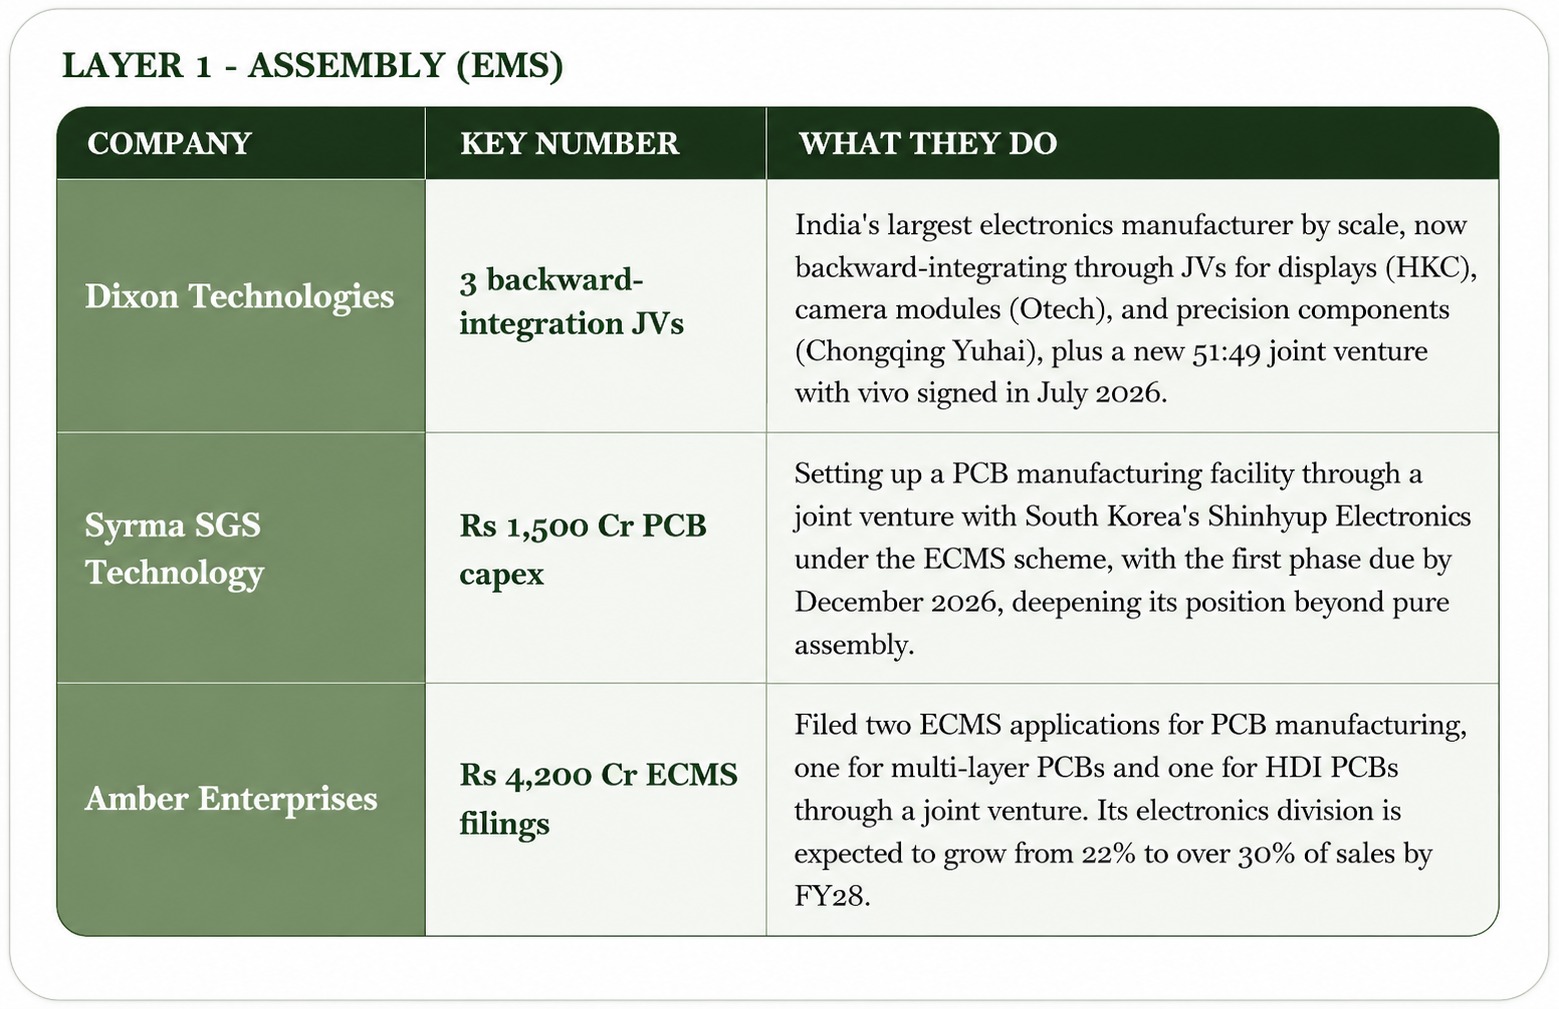
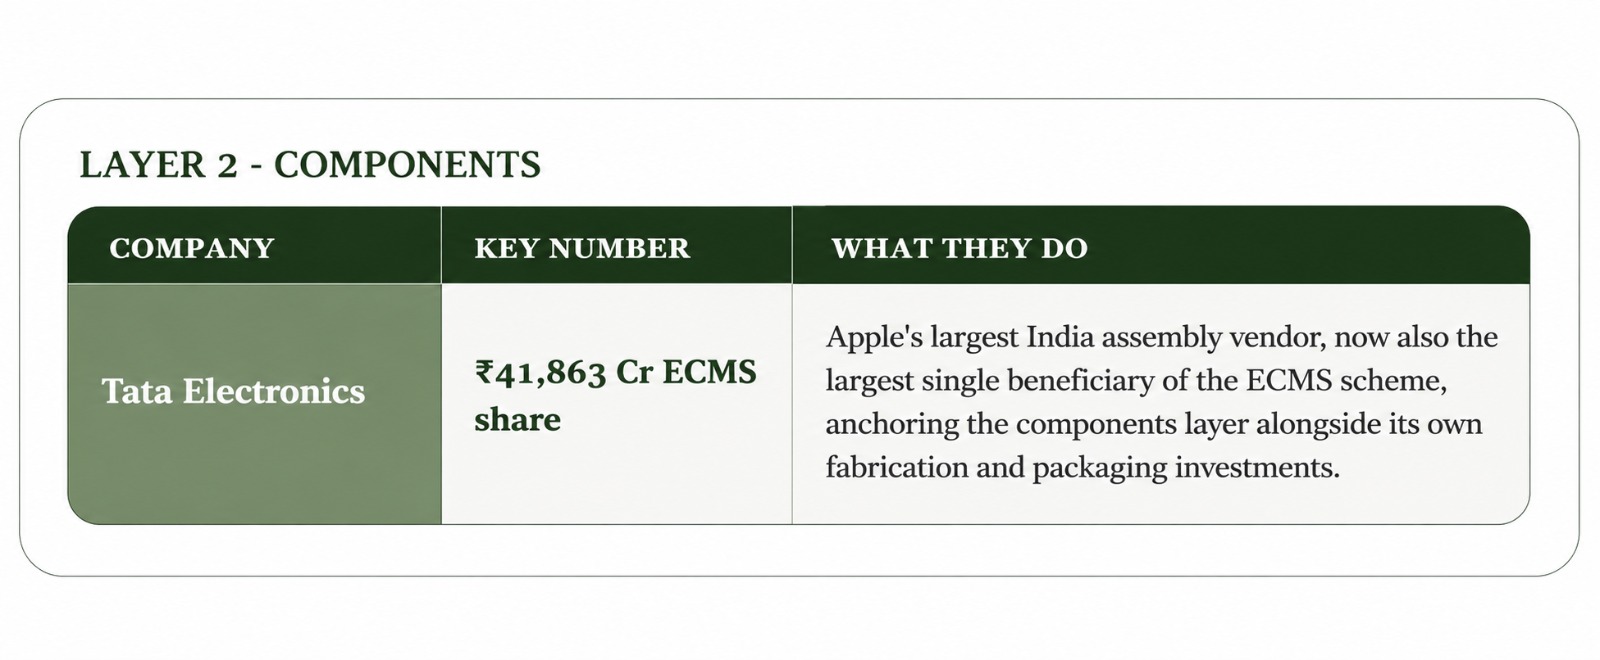
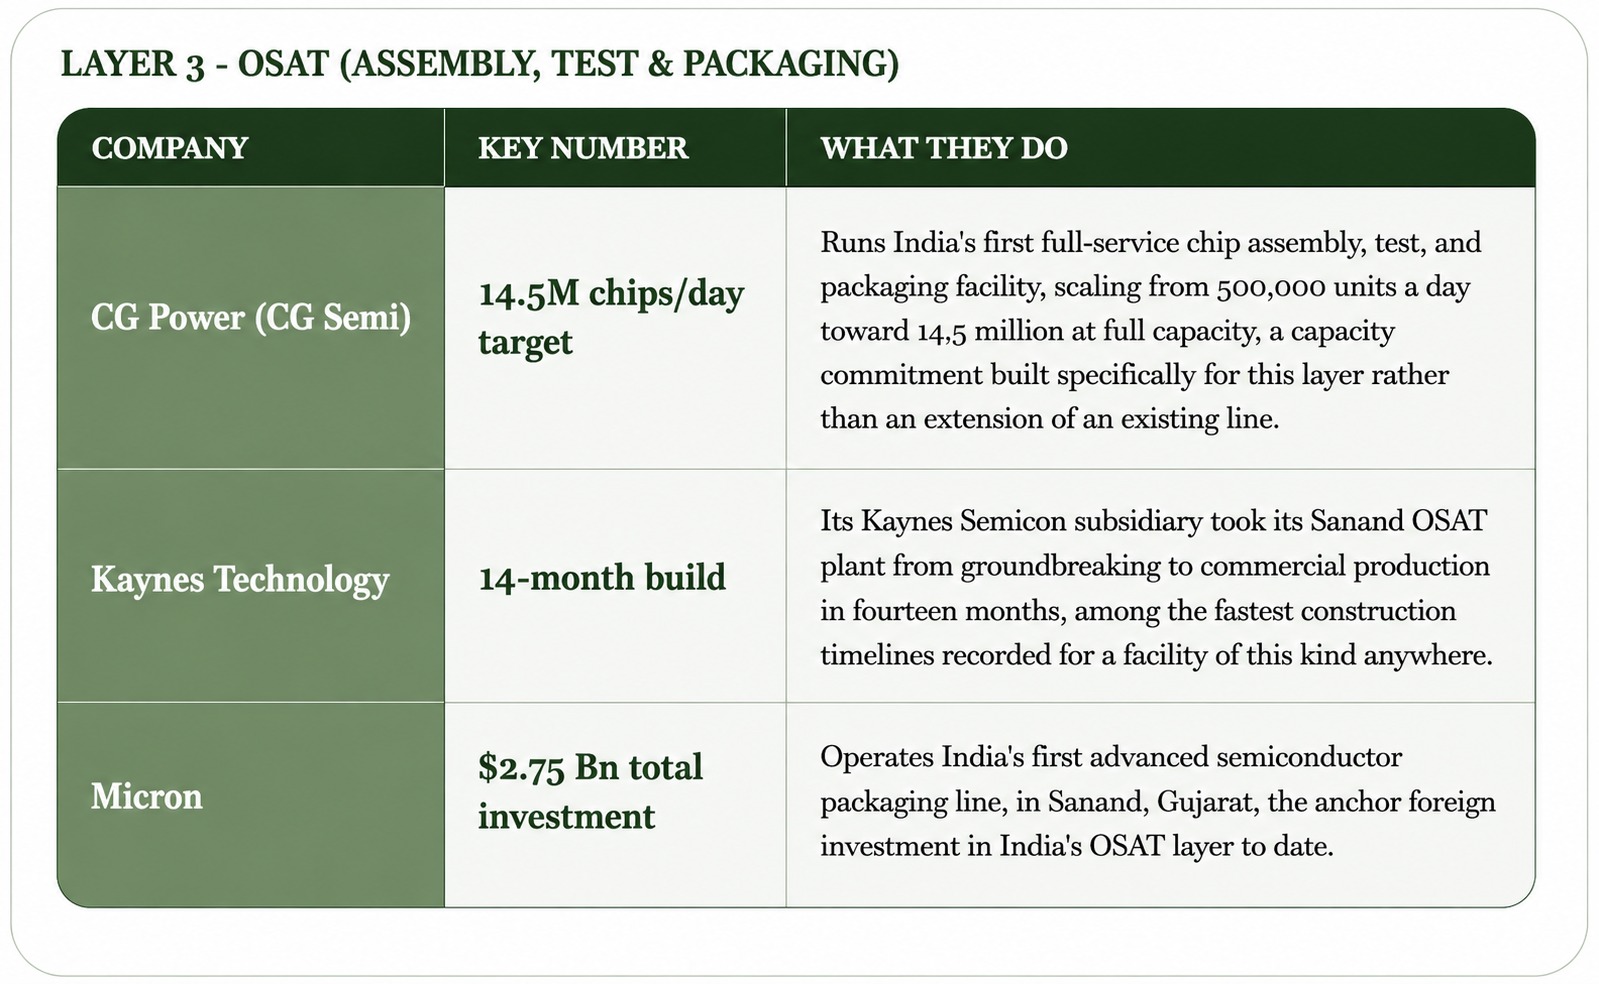
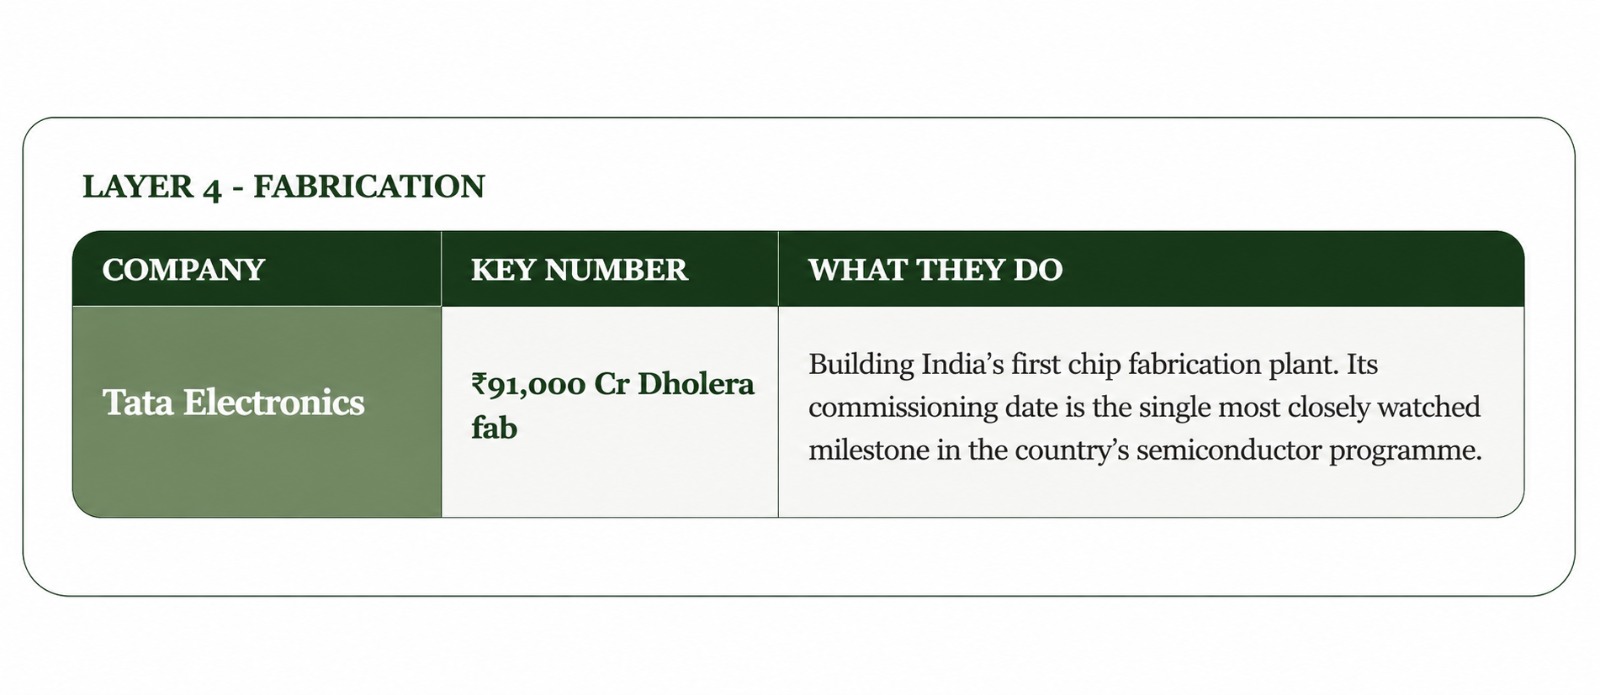
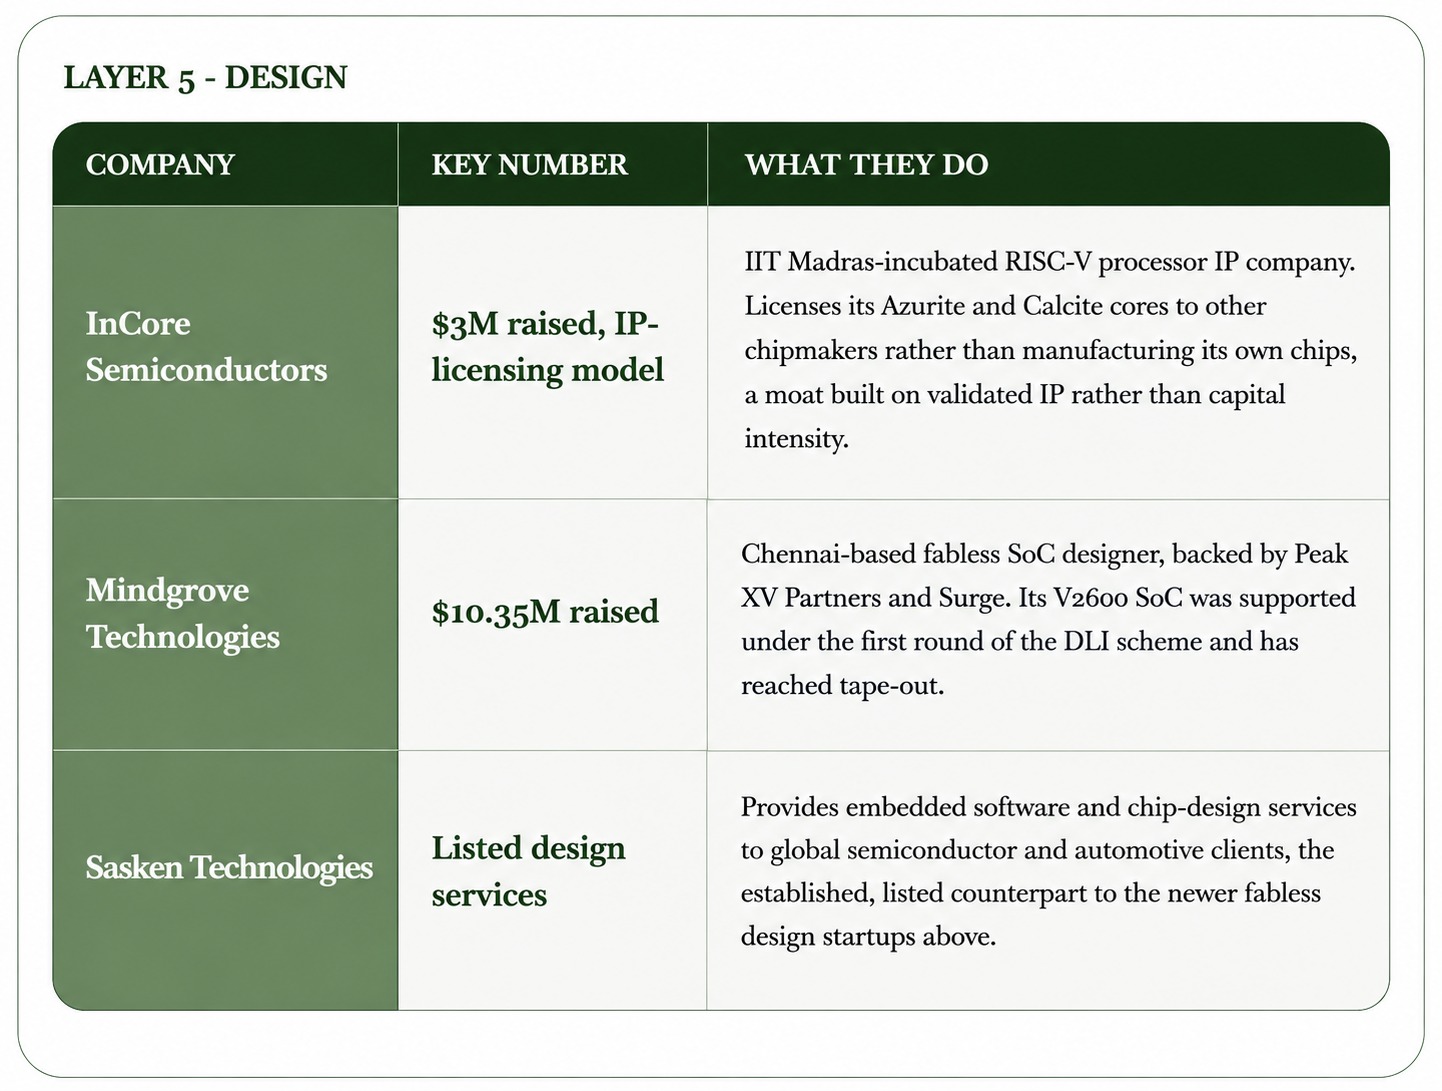
Electronics is rarely the final product a customer buys. It is almost always a component inside someone else’s, which is what makes this shift matter well past its own sector.
Smart meters make the point concretely: 5.08 crore have been deployed from a near-zero base only a few years ago, and each one is an electronics product built on the same manufacturing base described throughout this piece.
Three other measures show the same shift from the EMS side of the industry, in exports and infrastructure rather than in chips.
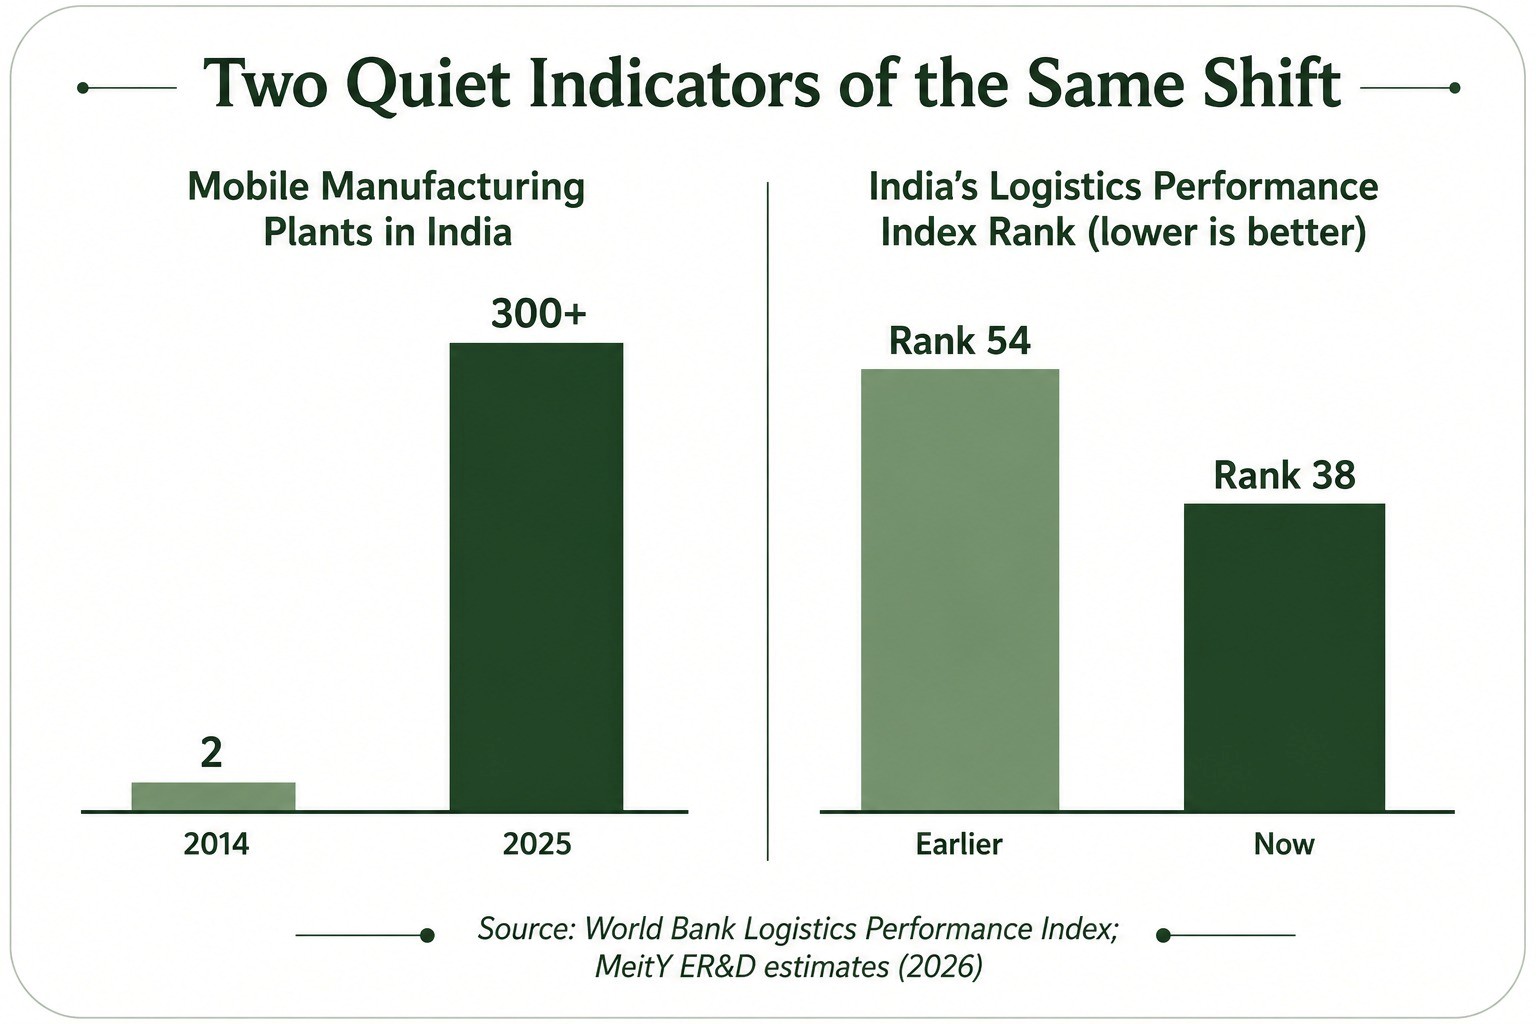
KEY INSIGHT : The companies doing EMS work five years ago are, in several cases, the same companies now building components, packaging chips, or funding chip design, Kaynes and Tata Electronics among them.
What has changed is not the industry’s starting point, but the layer of the value chain it is choosing to compete in next, with policy, private capital, and individual company decisions now pointed in the same direction at the same time.
None of this replaces the assembly industry India already built. It sits on top of it, extending a manufacturing base that took a decade to reach ₹11.3 lakh crore into the components, packaging, and design layers that base did not previously include.

Textiles
Bharat Tex 2026: On Ground For India’s Textile Story
India's textile industry isn't asking "if" anymore - it's asking "how fast." Field notes from our research analyst - straight off the floor at Bharat Tex 2026. Four days on ground, dozens of conversations - here's everything that stood out to us:
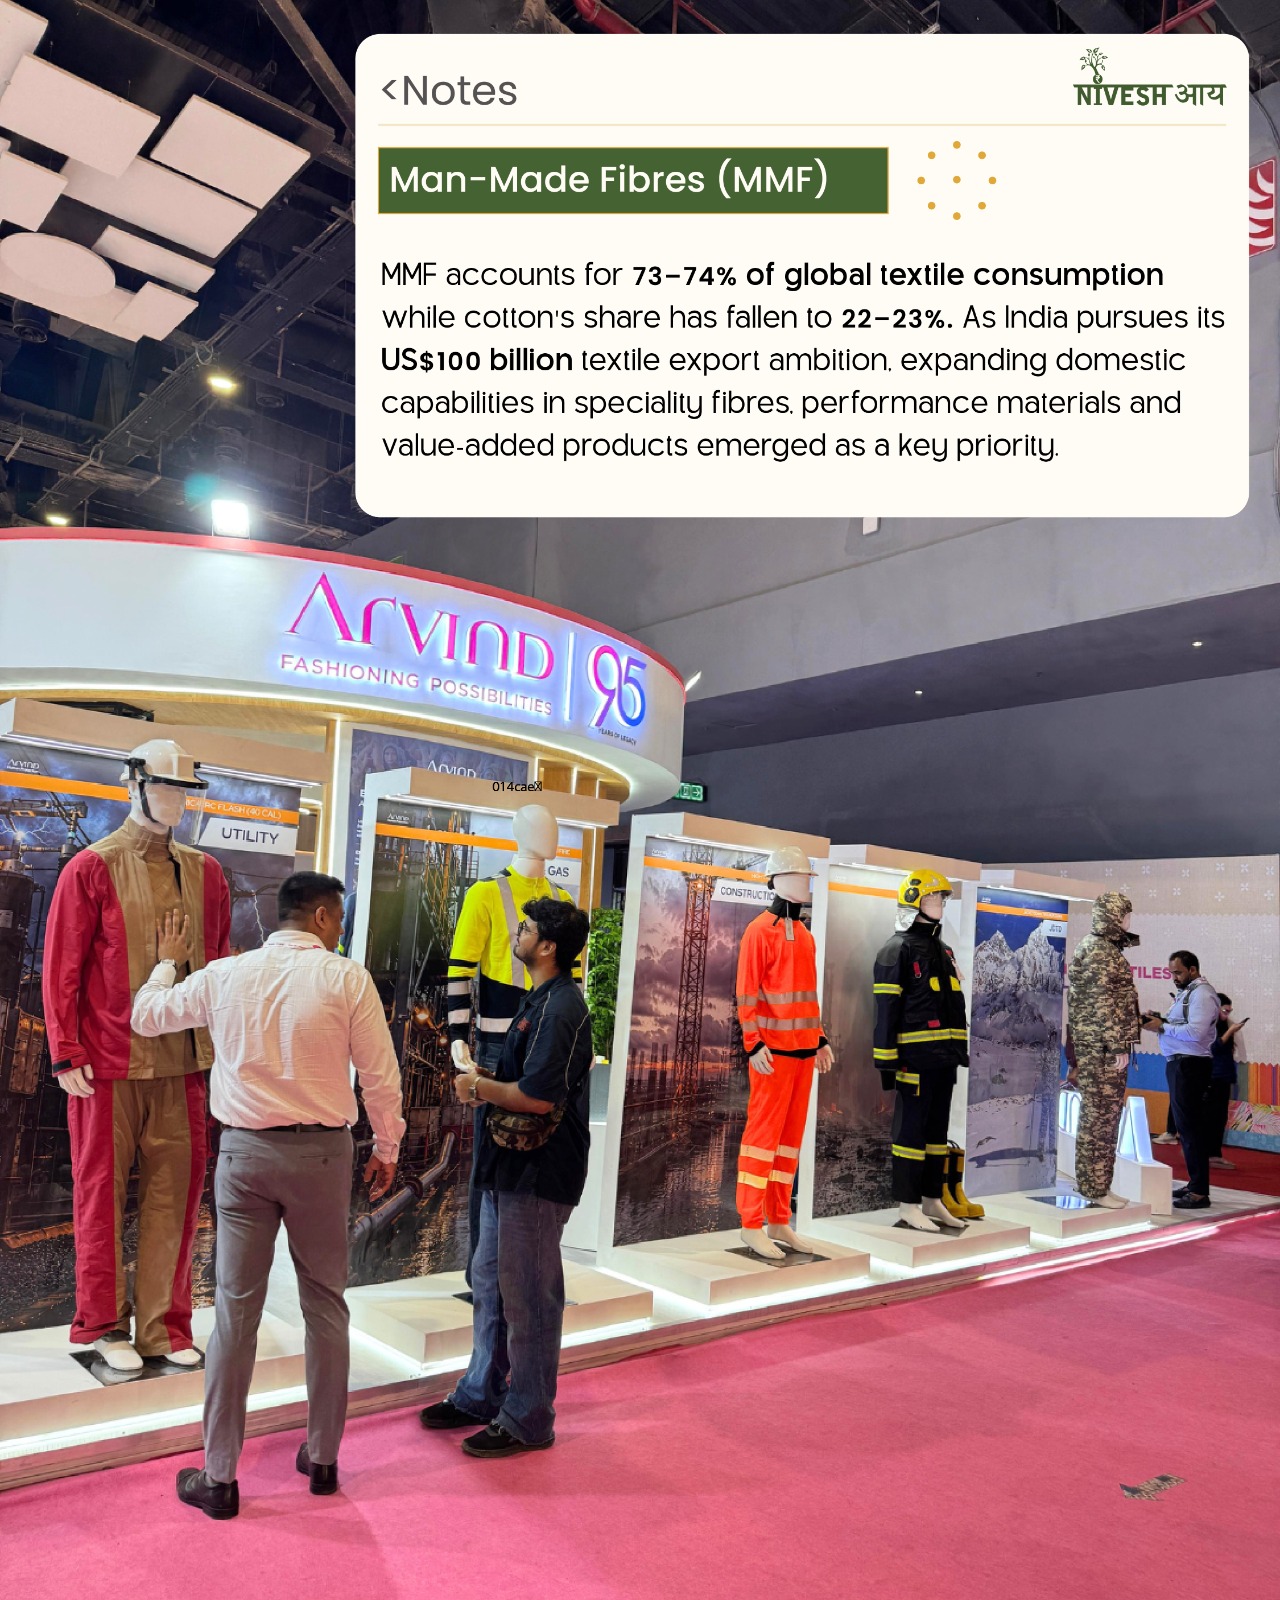

1) Man-Made Fibres (MMF): MMF now accounts for 73-74% of global textile consumption, while cotton’s share has fallen to 22-23%.
As India pursues its US$100 billion textile export ambition, expanding domestic capabilities in speciality fibres, performance materials, and value-added products emerged as a key priority across every session we attended.
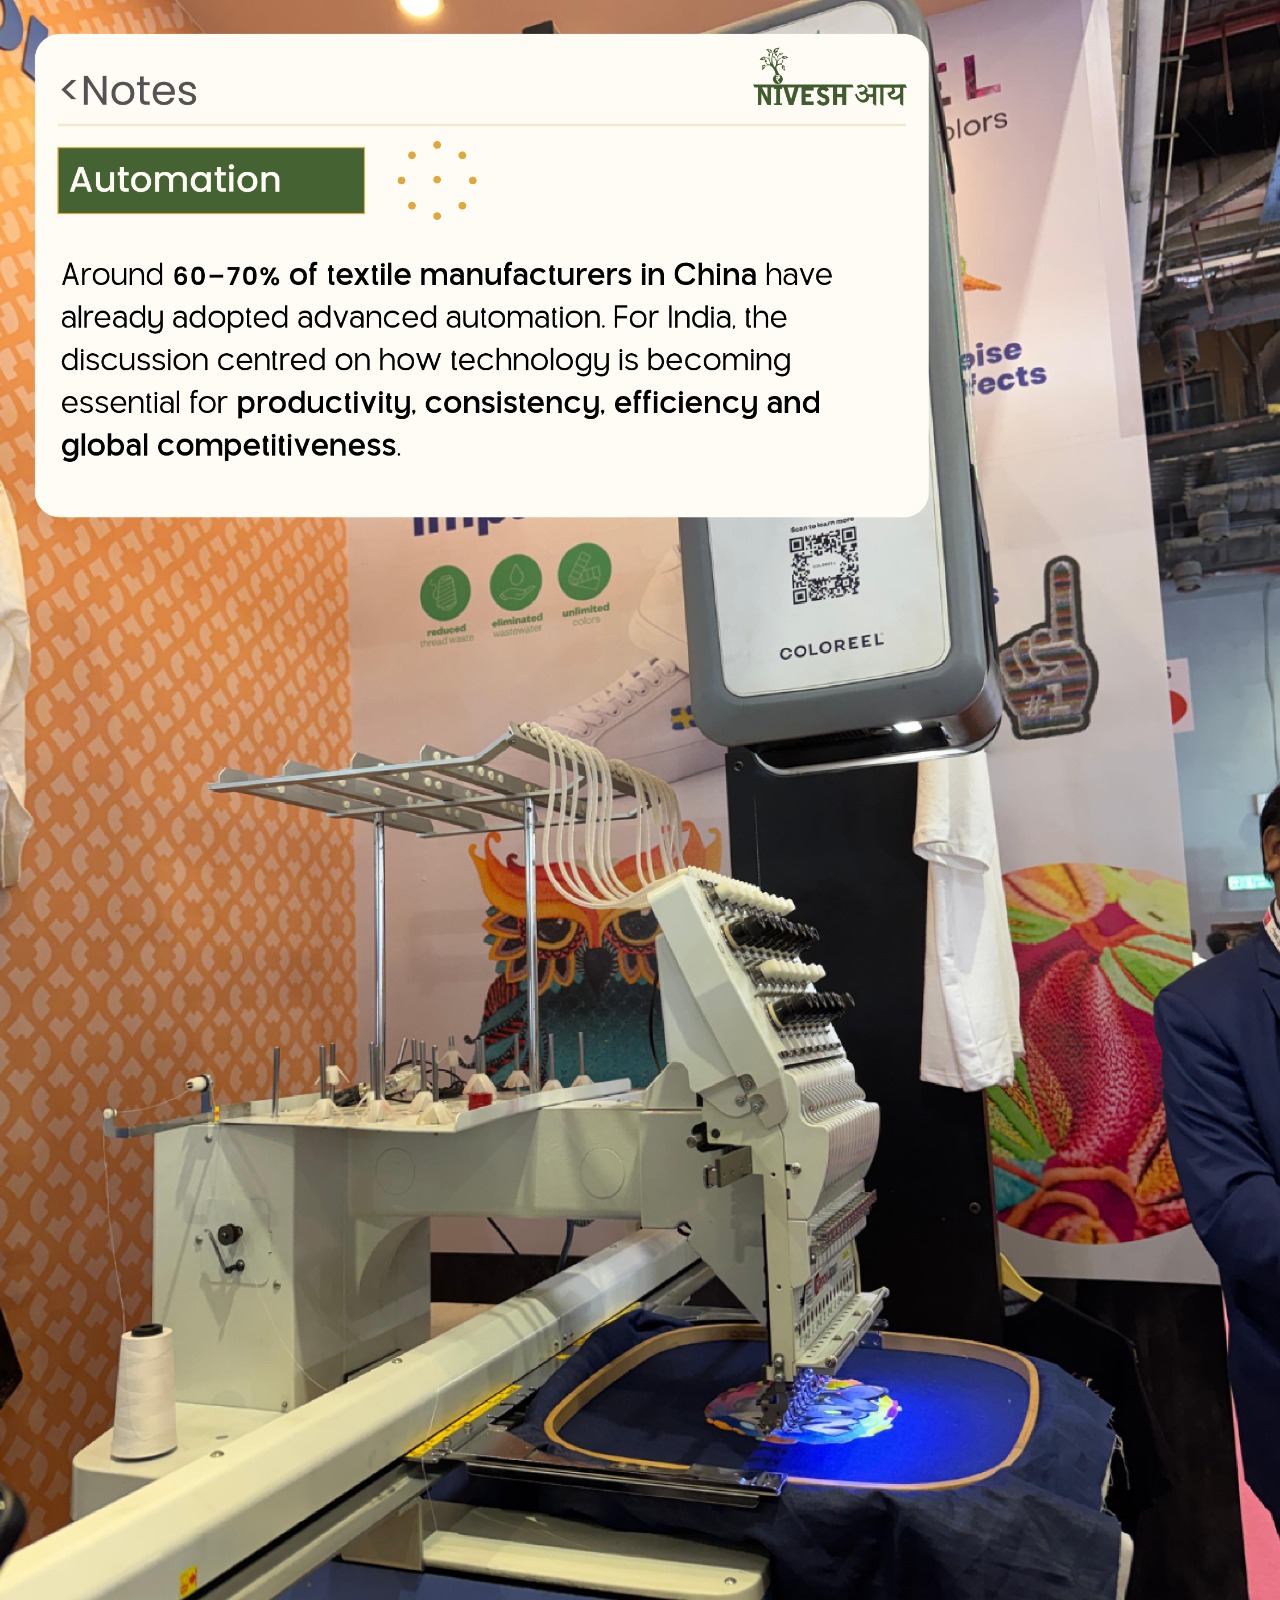
2) Automation: Around 60-70% of textile manufacturers in China have already adopted advanced automation.
For India, the discussion centred on how technology is becoming essential – not optional – for productivity, consistency, efficiency, and staying globally competitive.
3)Free Trade Agreements (FTAs): With 56 FTAs now in place and the China+1 opportunity gaining real momentum, industry leaders were unanimous on one thing: FTAs are only the starting point.
Quality standards, reliable execution, compliance, and long-term customer relationships will ultimately decide who wins this export race – not tariffs alone.
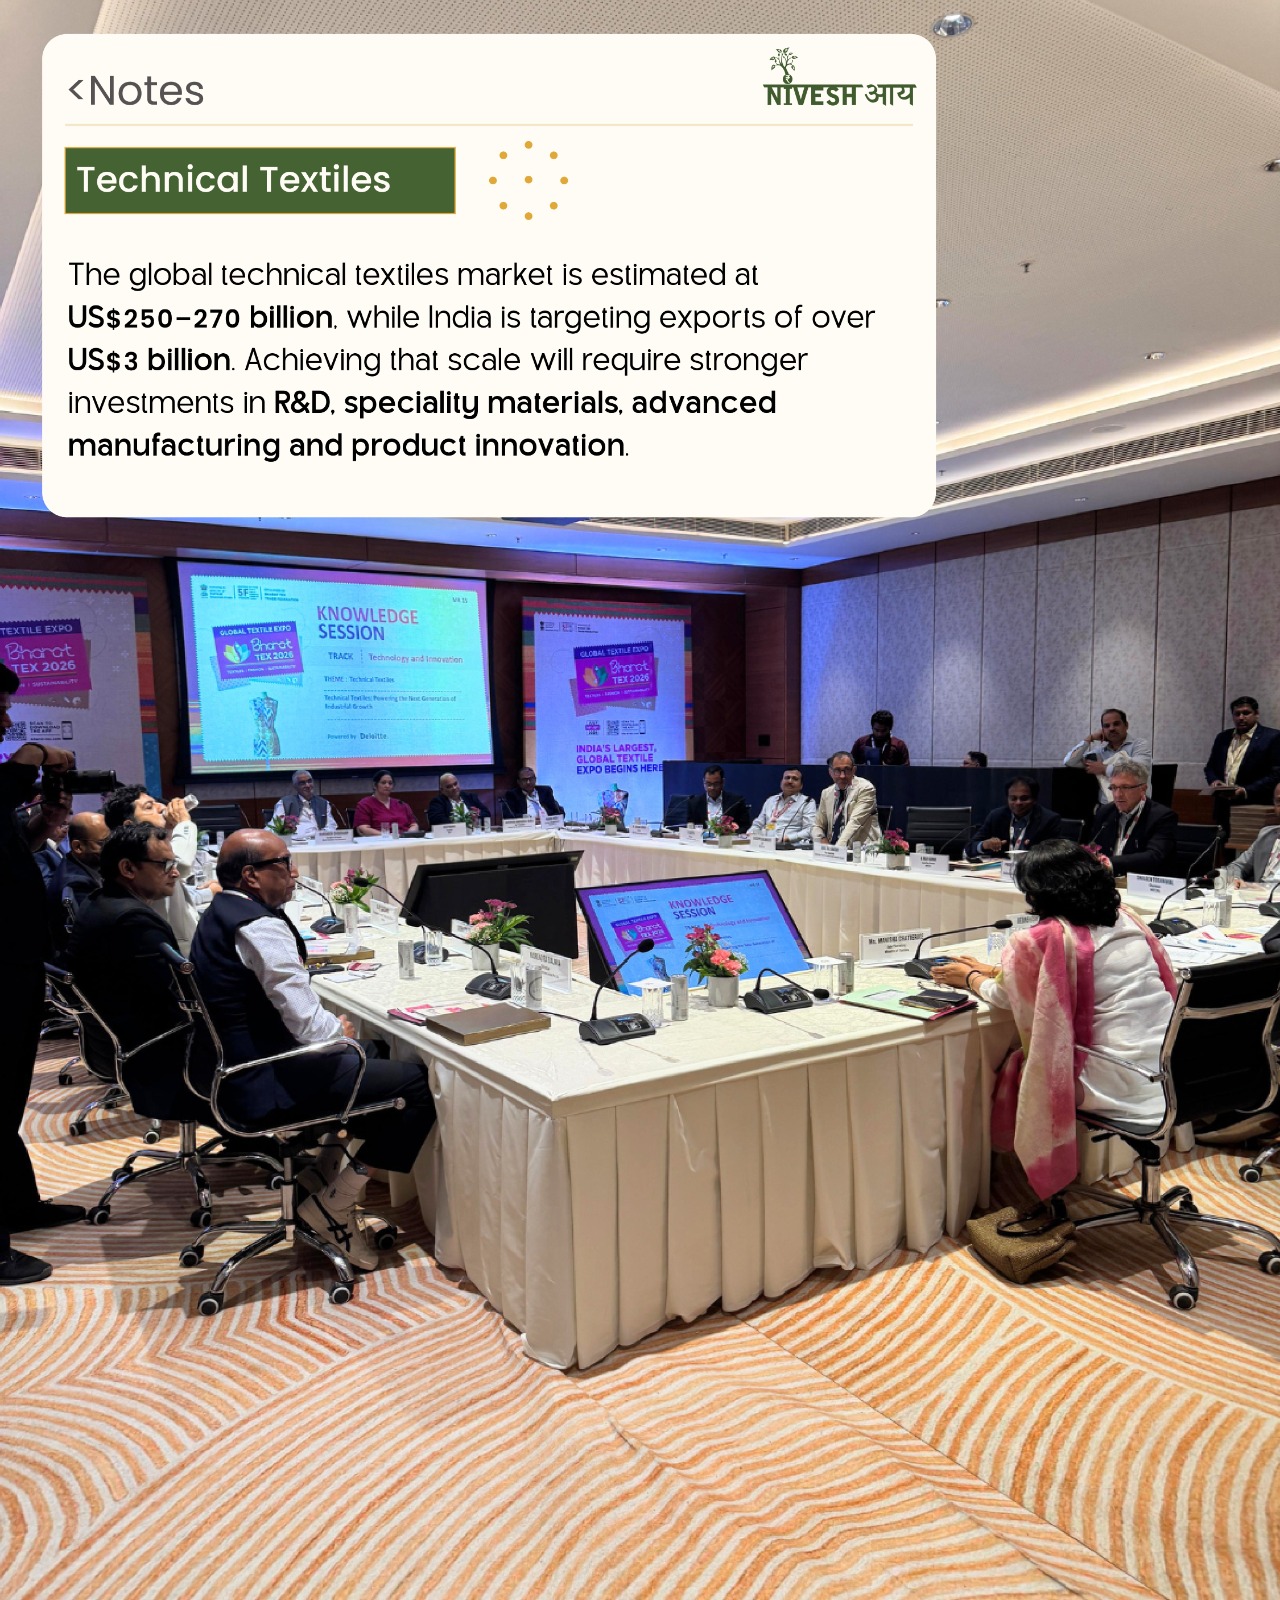
4) Technical Textiles: The global technical textiles market is estimated at US$250-270 billion, while India is targeting exports of over US$3 billion.
Achieving that scale will require far stronger investment in R&D, speciality materials, advanced manufacturing, and product innovation.
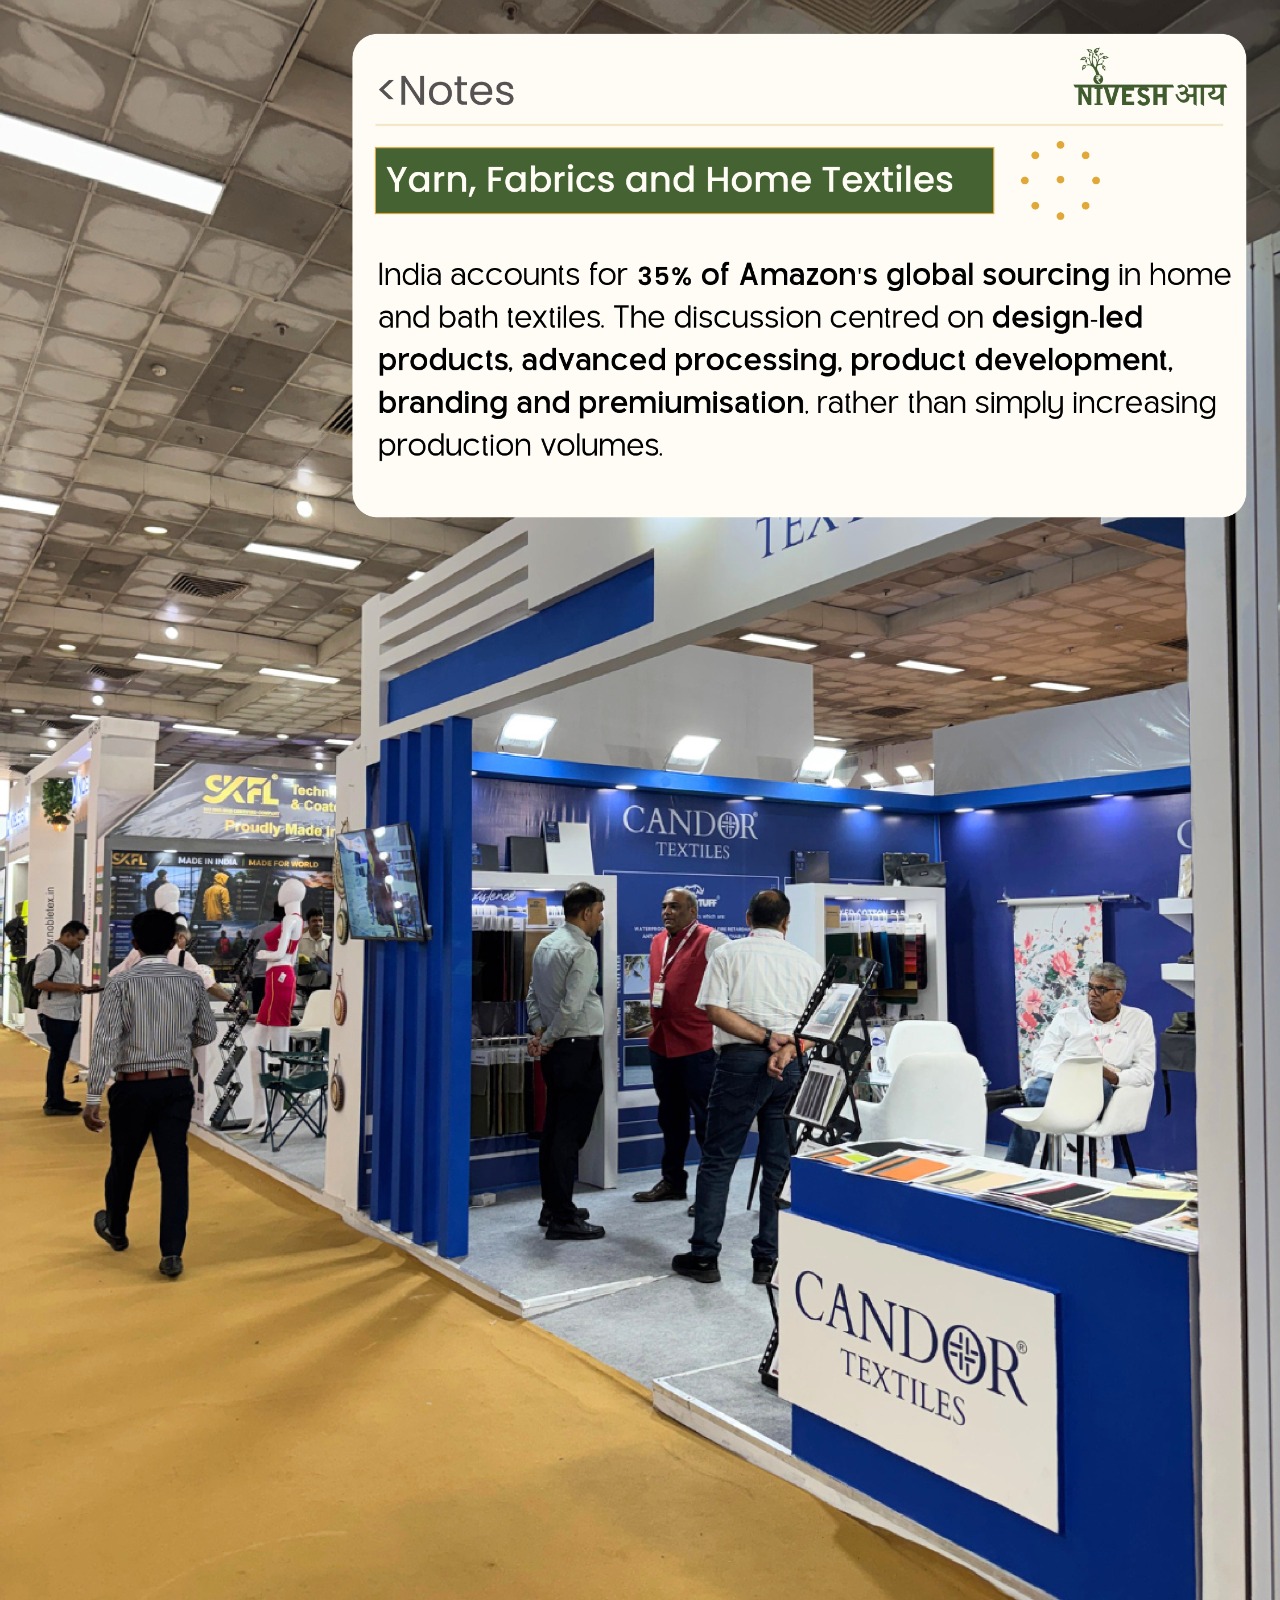
5) Yarn, Fabrics & Home Textiles: India accounts for 35% of Amazon’s global sourcing in home and bath textiles.
But the conversation on ground wasn’t about producing more – it was about design-led products, advanced processing, product development, branding, and premiumisation.
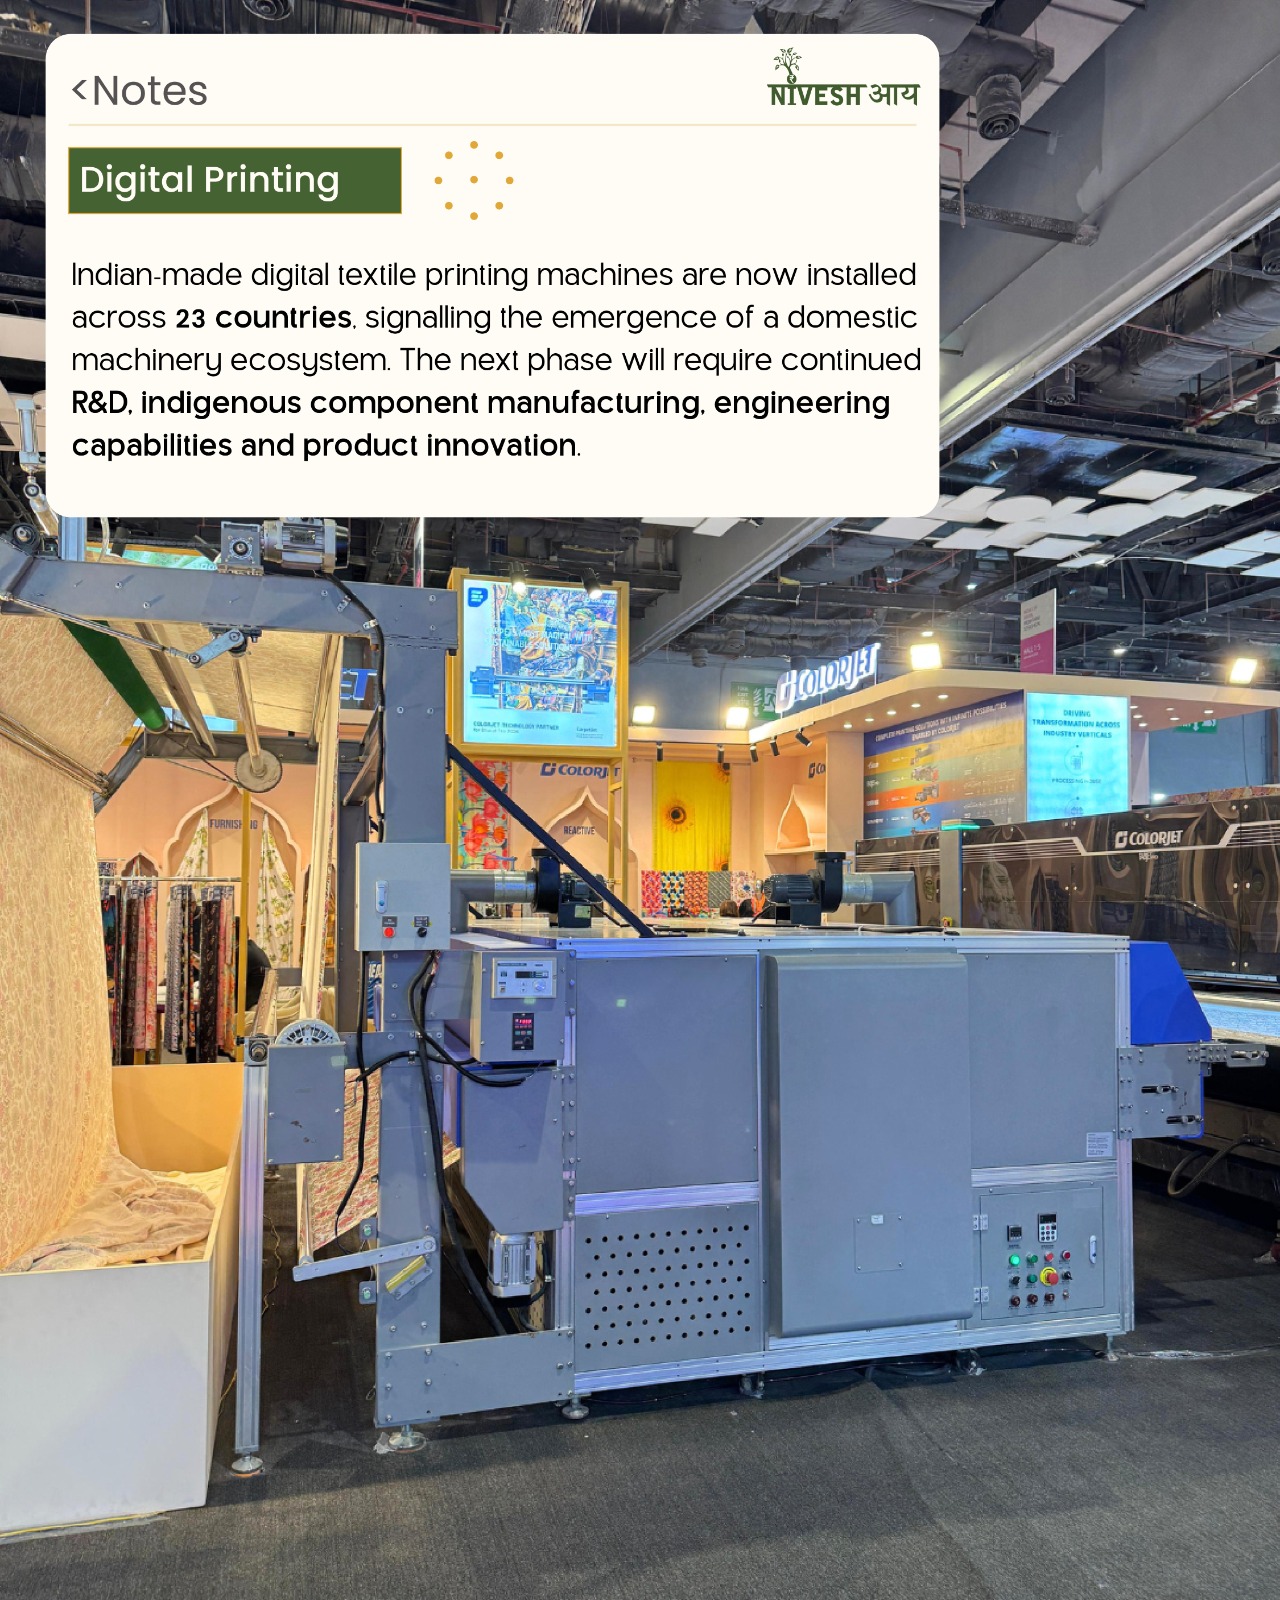
6) Digital Printing: Indian-made digital textile printing machines are now installed across 23 countries, signalling the quiet emergence of a genuine domestic machinery ecosystem.
The next phase will need continued R&D, indigenous component manufacturing, stronger engineering capabilities, and product innovation to sustain this momentum.
Space Ecosystem
India’s Private Space Industry: The Investment Opportunity Beyond Vikram-1
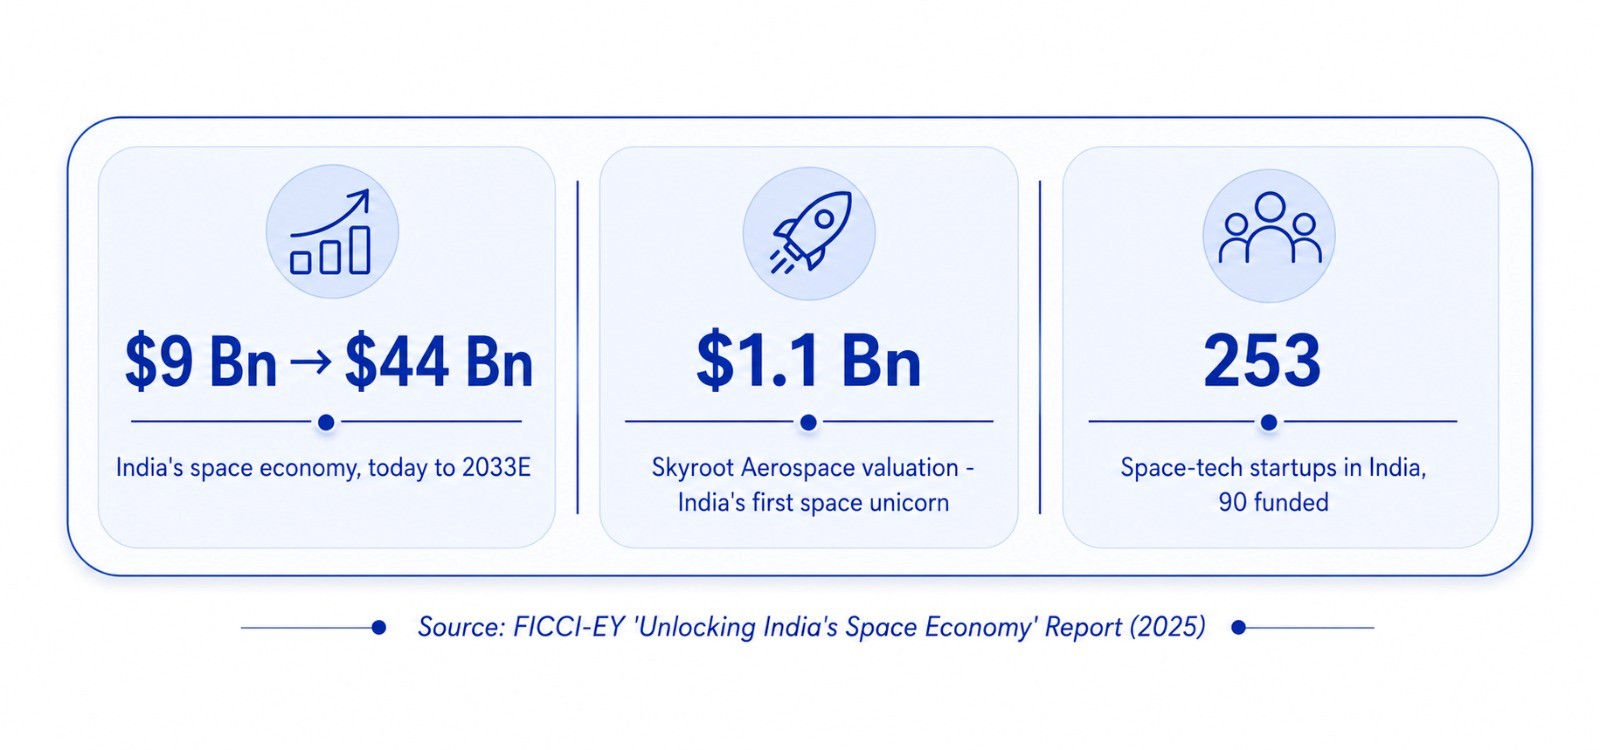
Today, India is home to 250+ space-tech startups, and the sector is projected to become a $44 billion opportunity by 2033. But the bigger story isn't one rocket - it's the ecosystem quietly taking shape behind it.
The rocket made headlines. The ecosystem could create the next wave of opportunities. 🚀
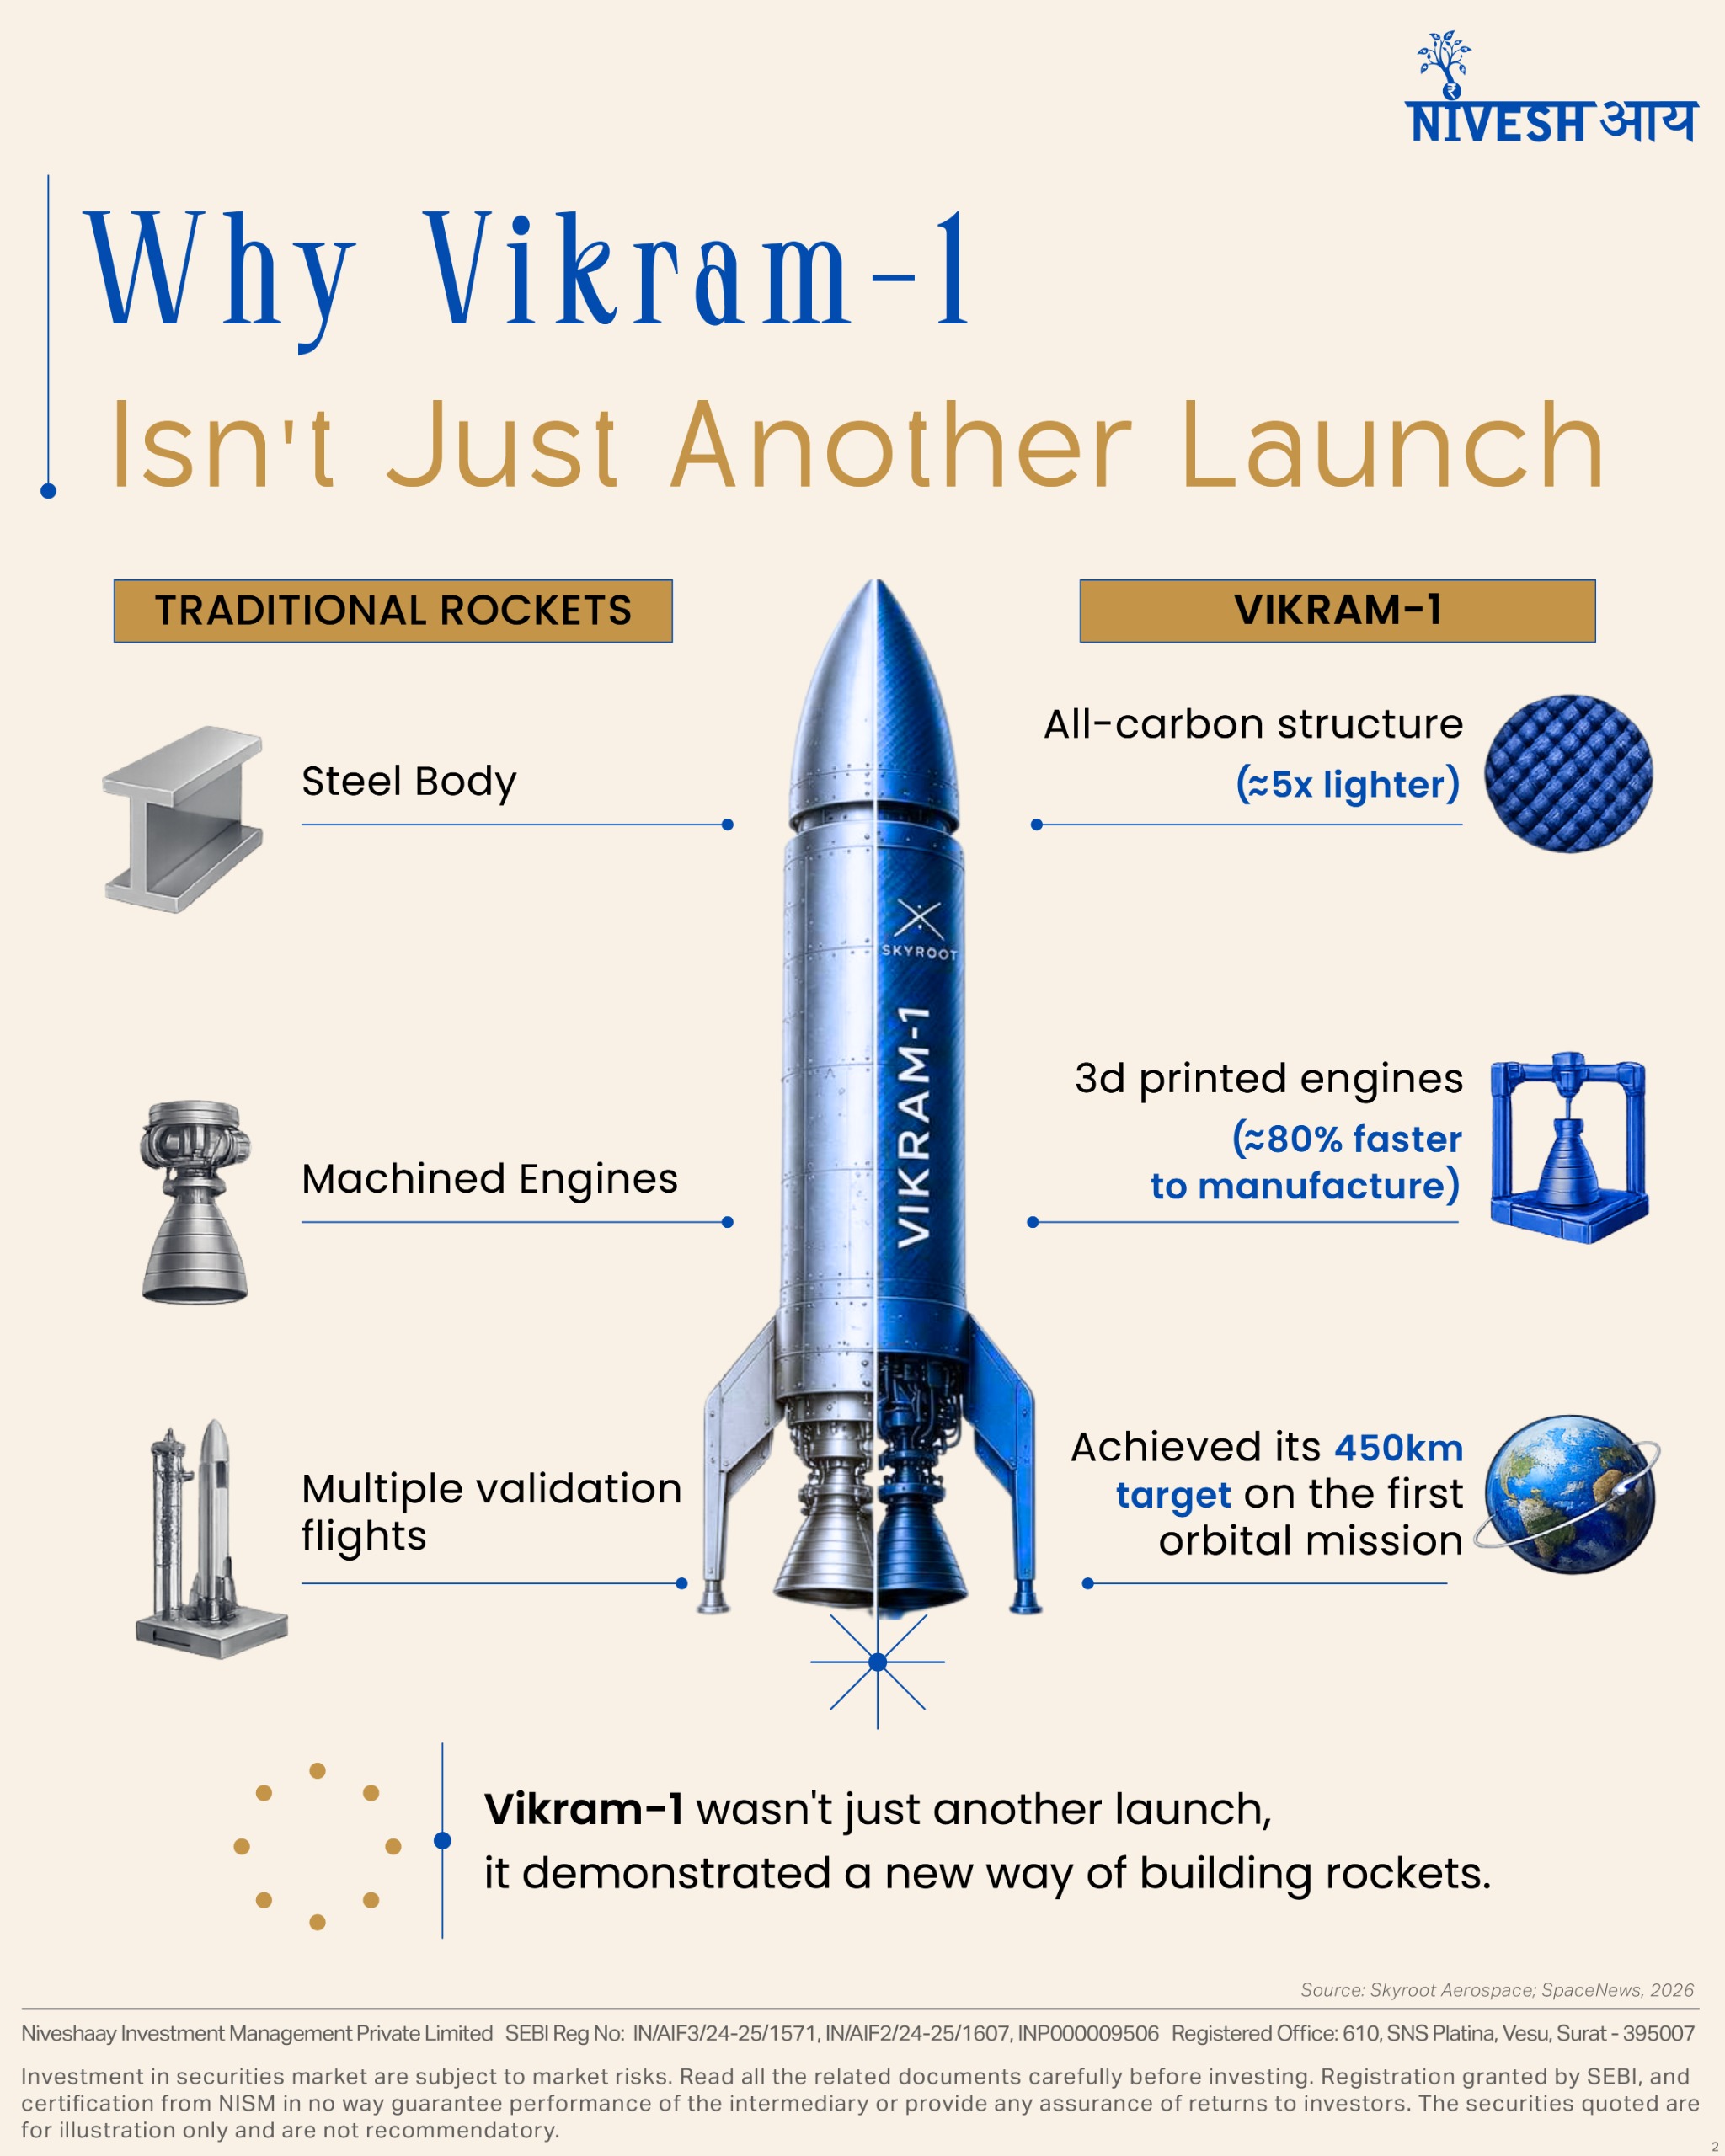
Vikram-1’s successful launch wasn’t just a technological milestone – it signalled that India’s private space industry is beginning to mature.
Today, India is home to 250+ space-tech startups, and the sector is projected to become a $44 billion opportunity by 2033. But the bigger story isn’t one rocket – it’s the ecosystem quietly taking shape behind it.
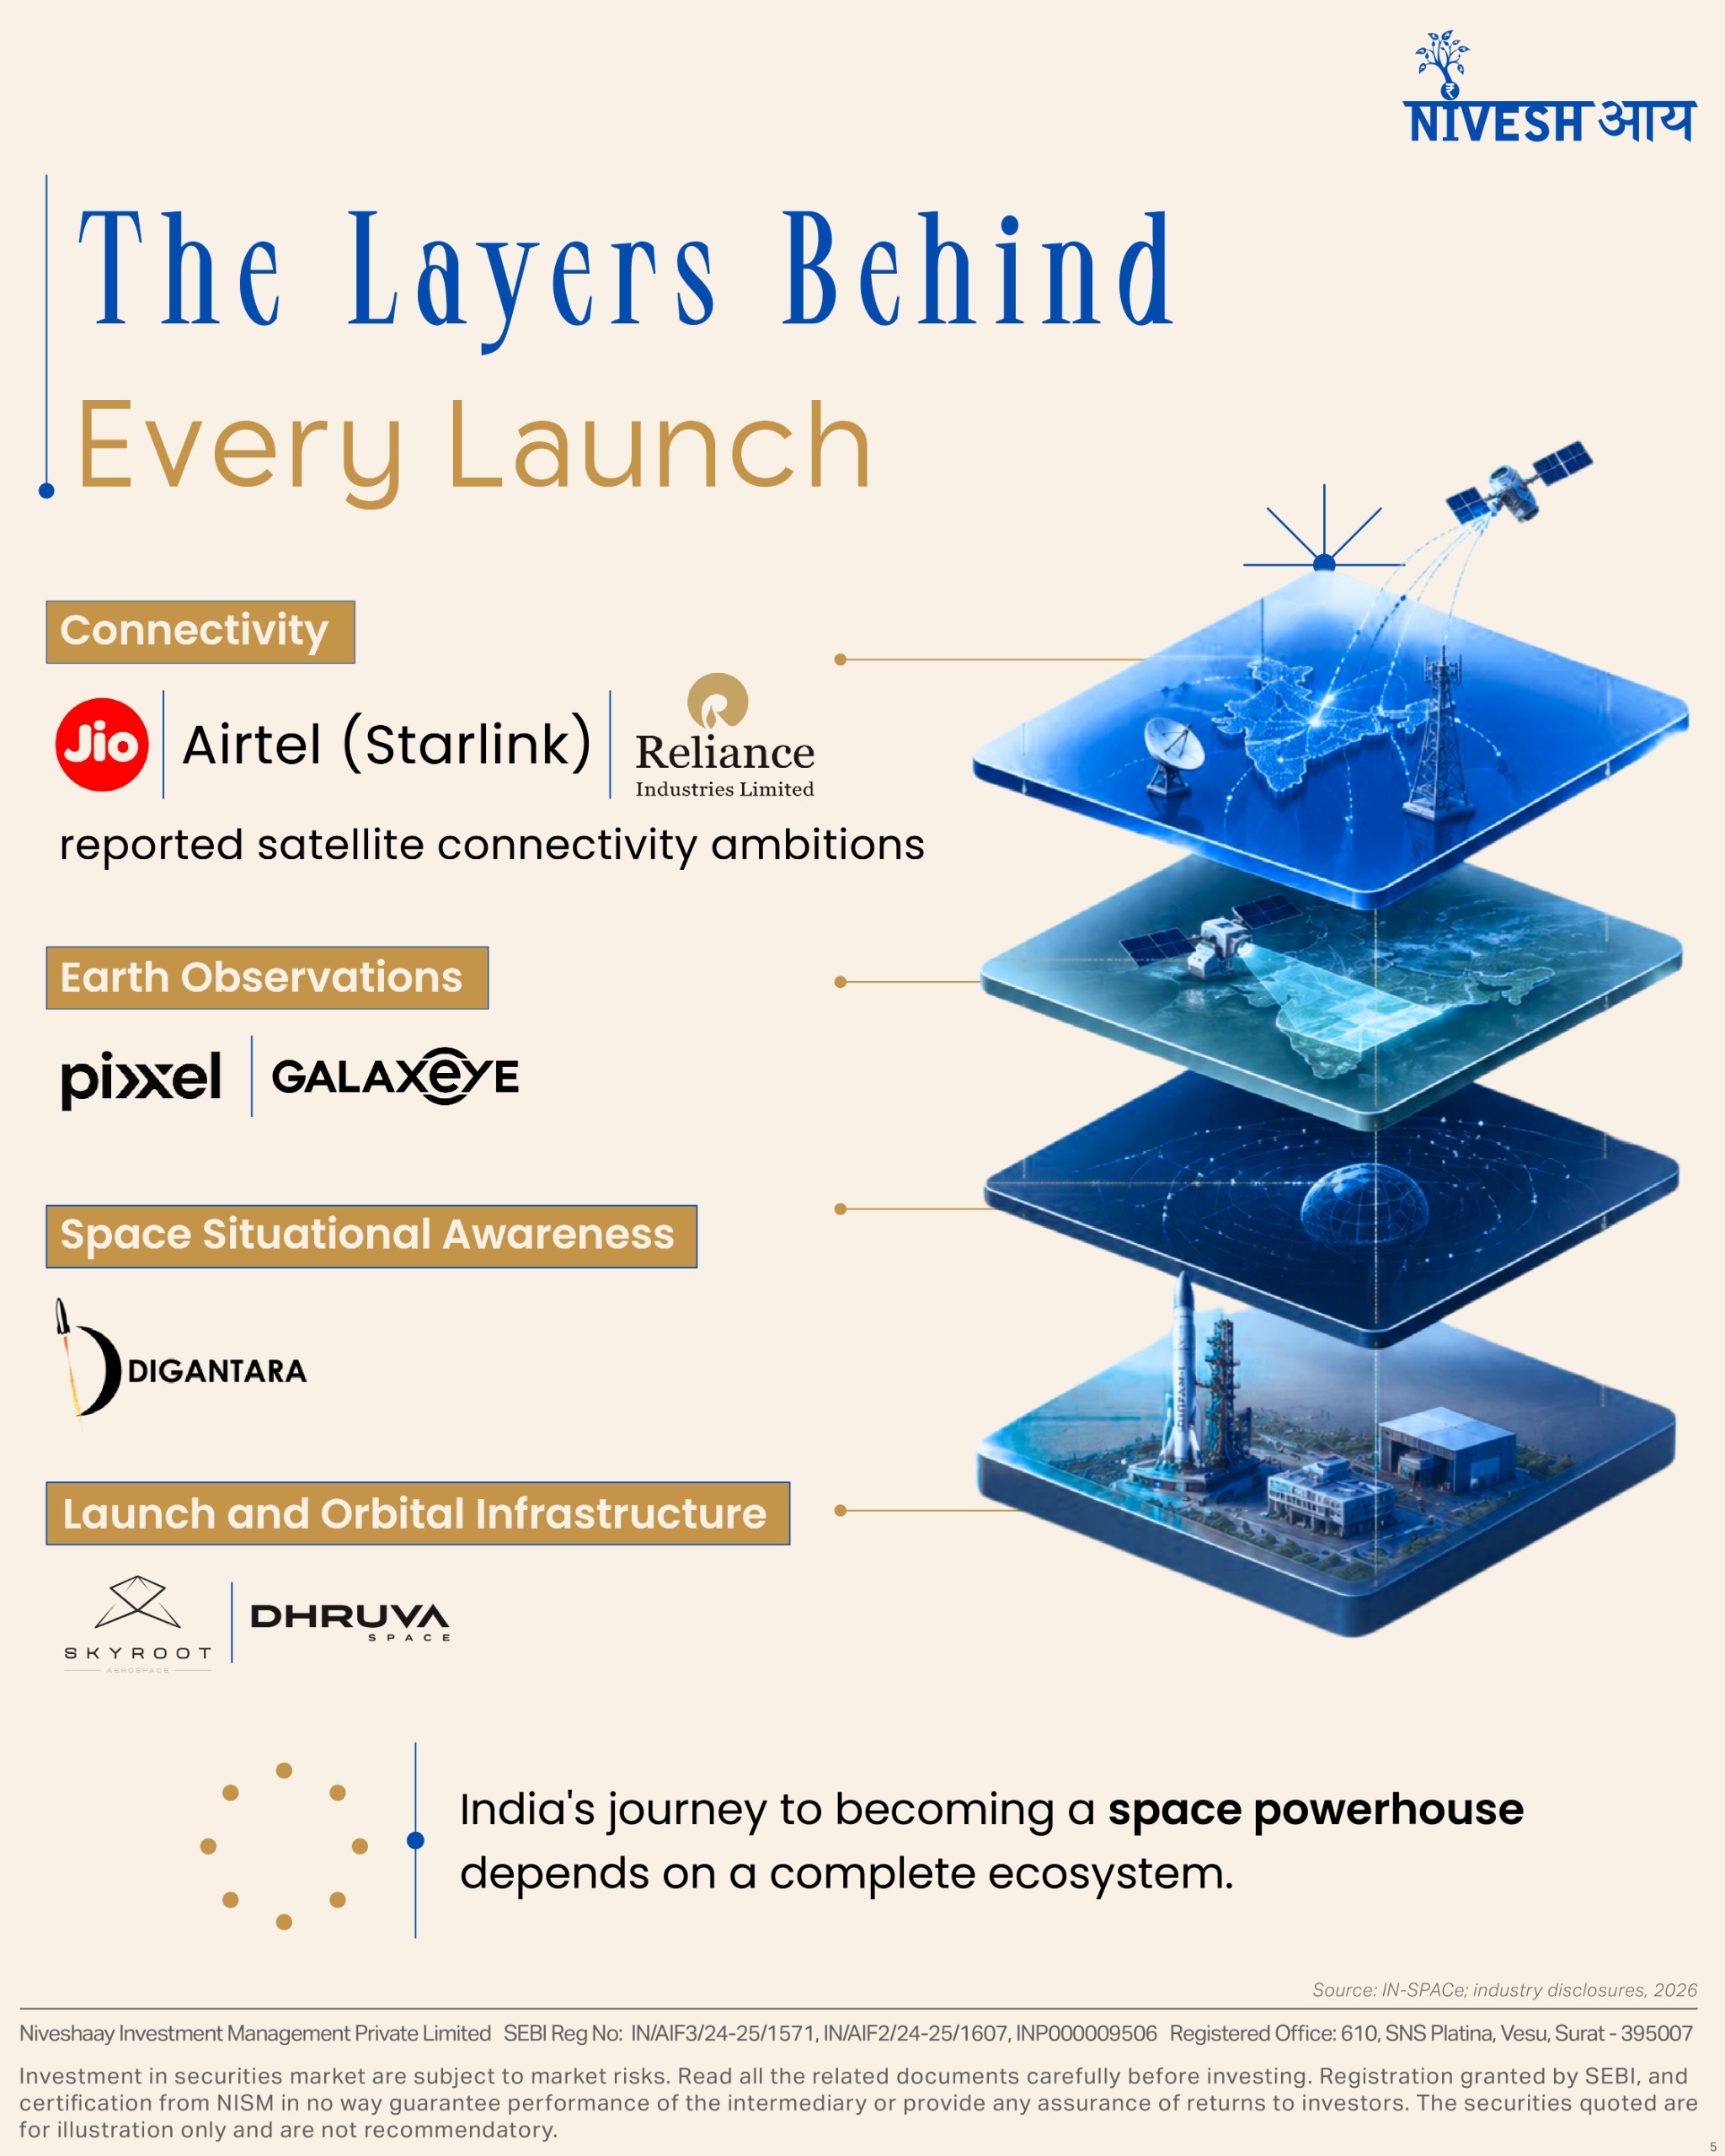
From satellite data and precision manufacturing to orbital intelligence and launch infrastructure, every layer is creating businesses with distinct revenue models and long-term potential.
For investors, the ecosystem is often as important as the event itself.
💬 Which part of India’s space ecosystem do you think could create the biggest long-term opportunity?
READ our Blog in detail here.

Space Ecosystem
India’s Space Leap: Private. Ambitious. Taking off.
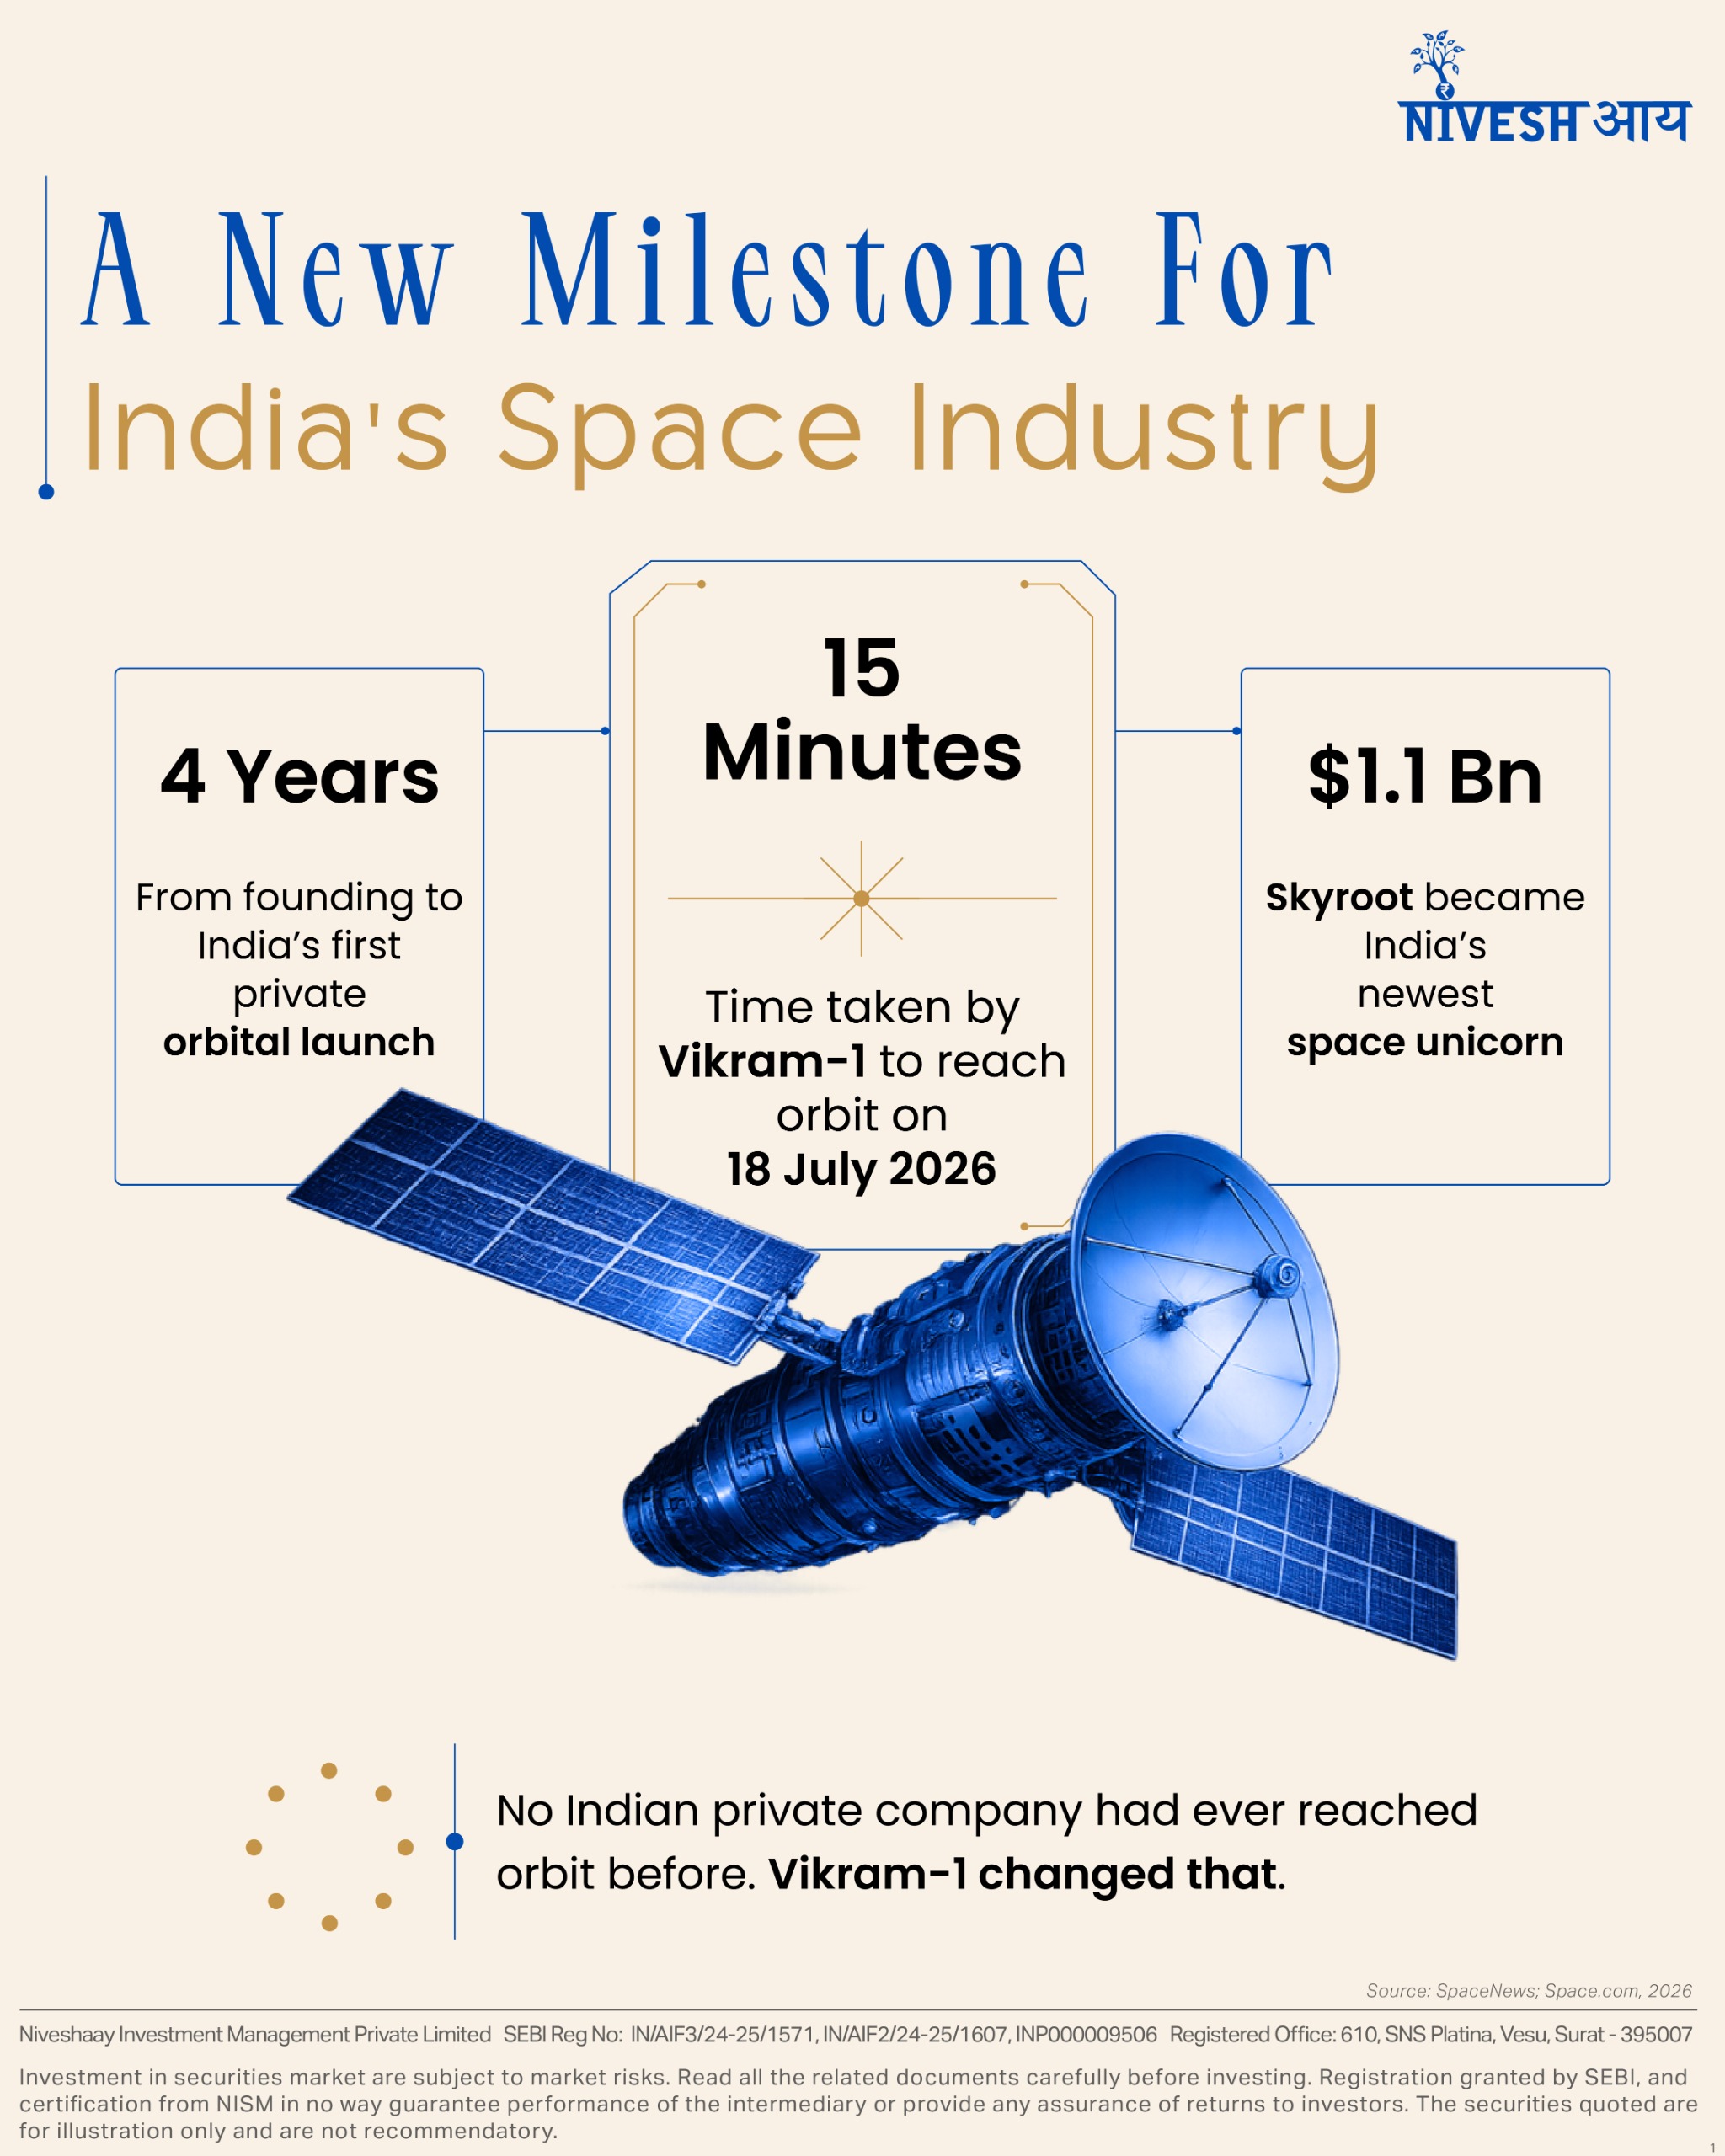
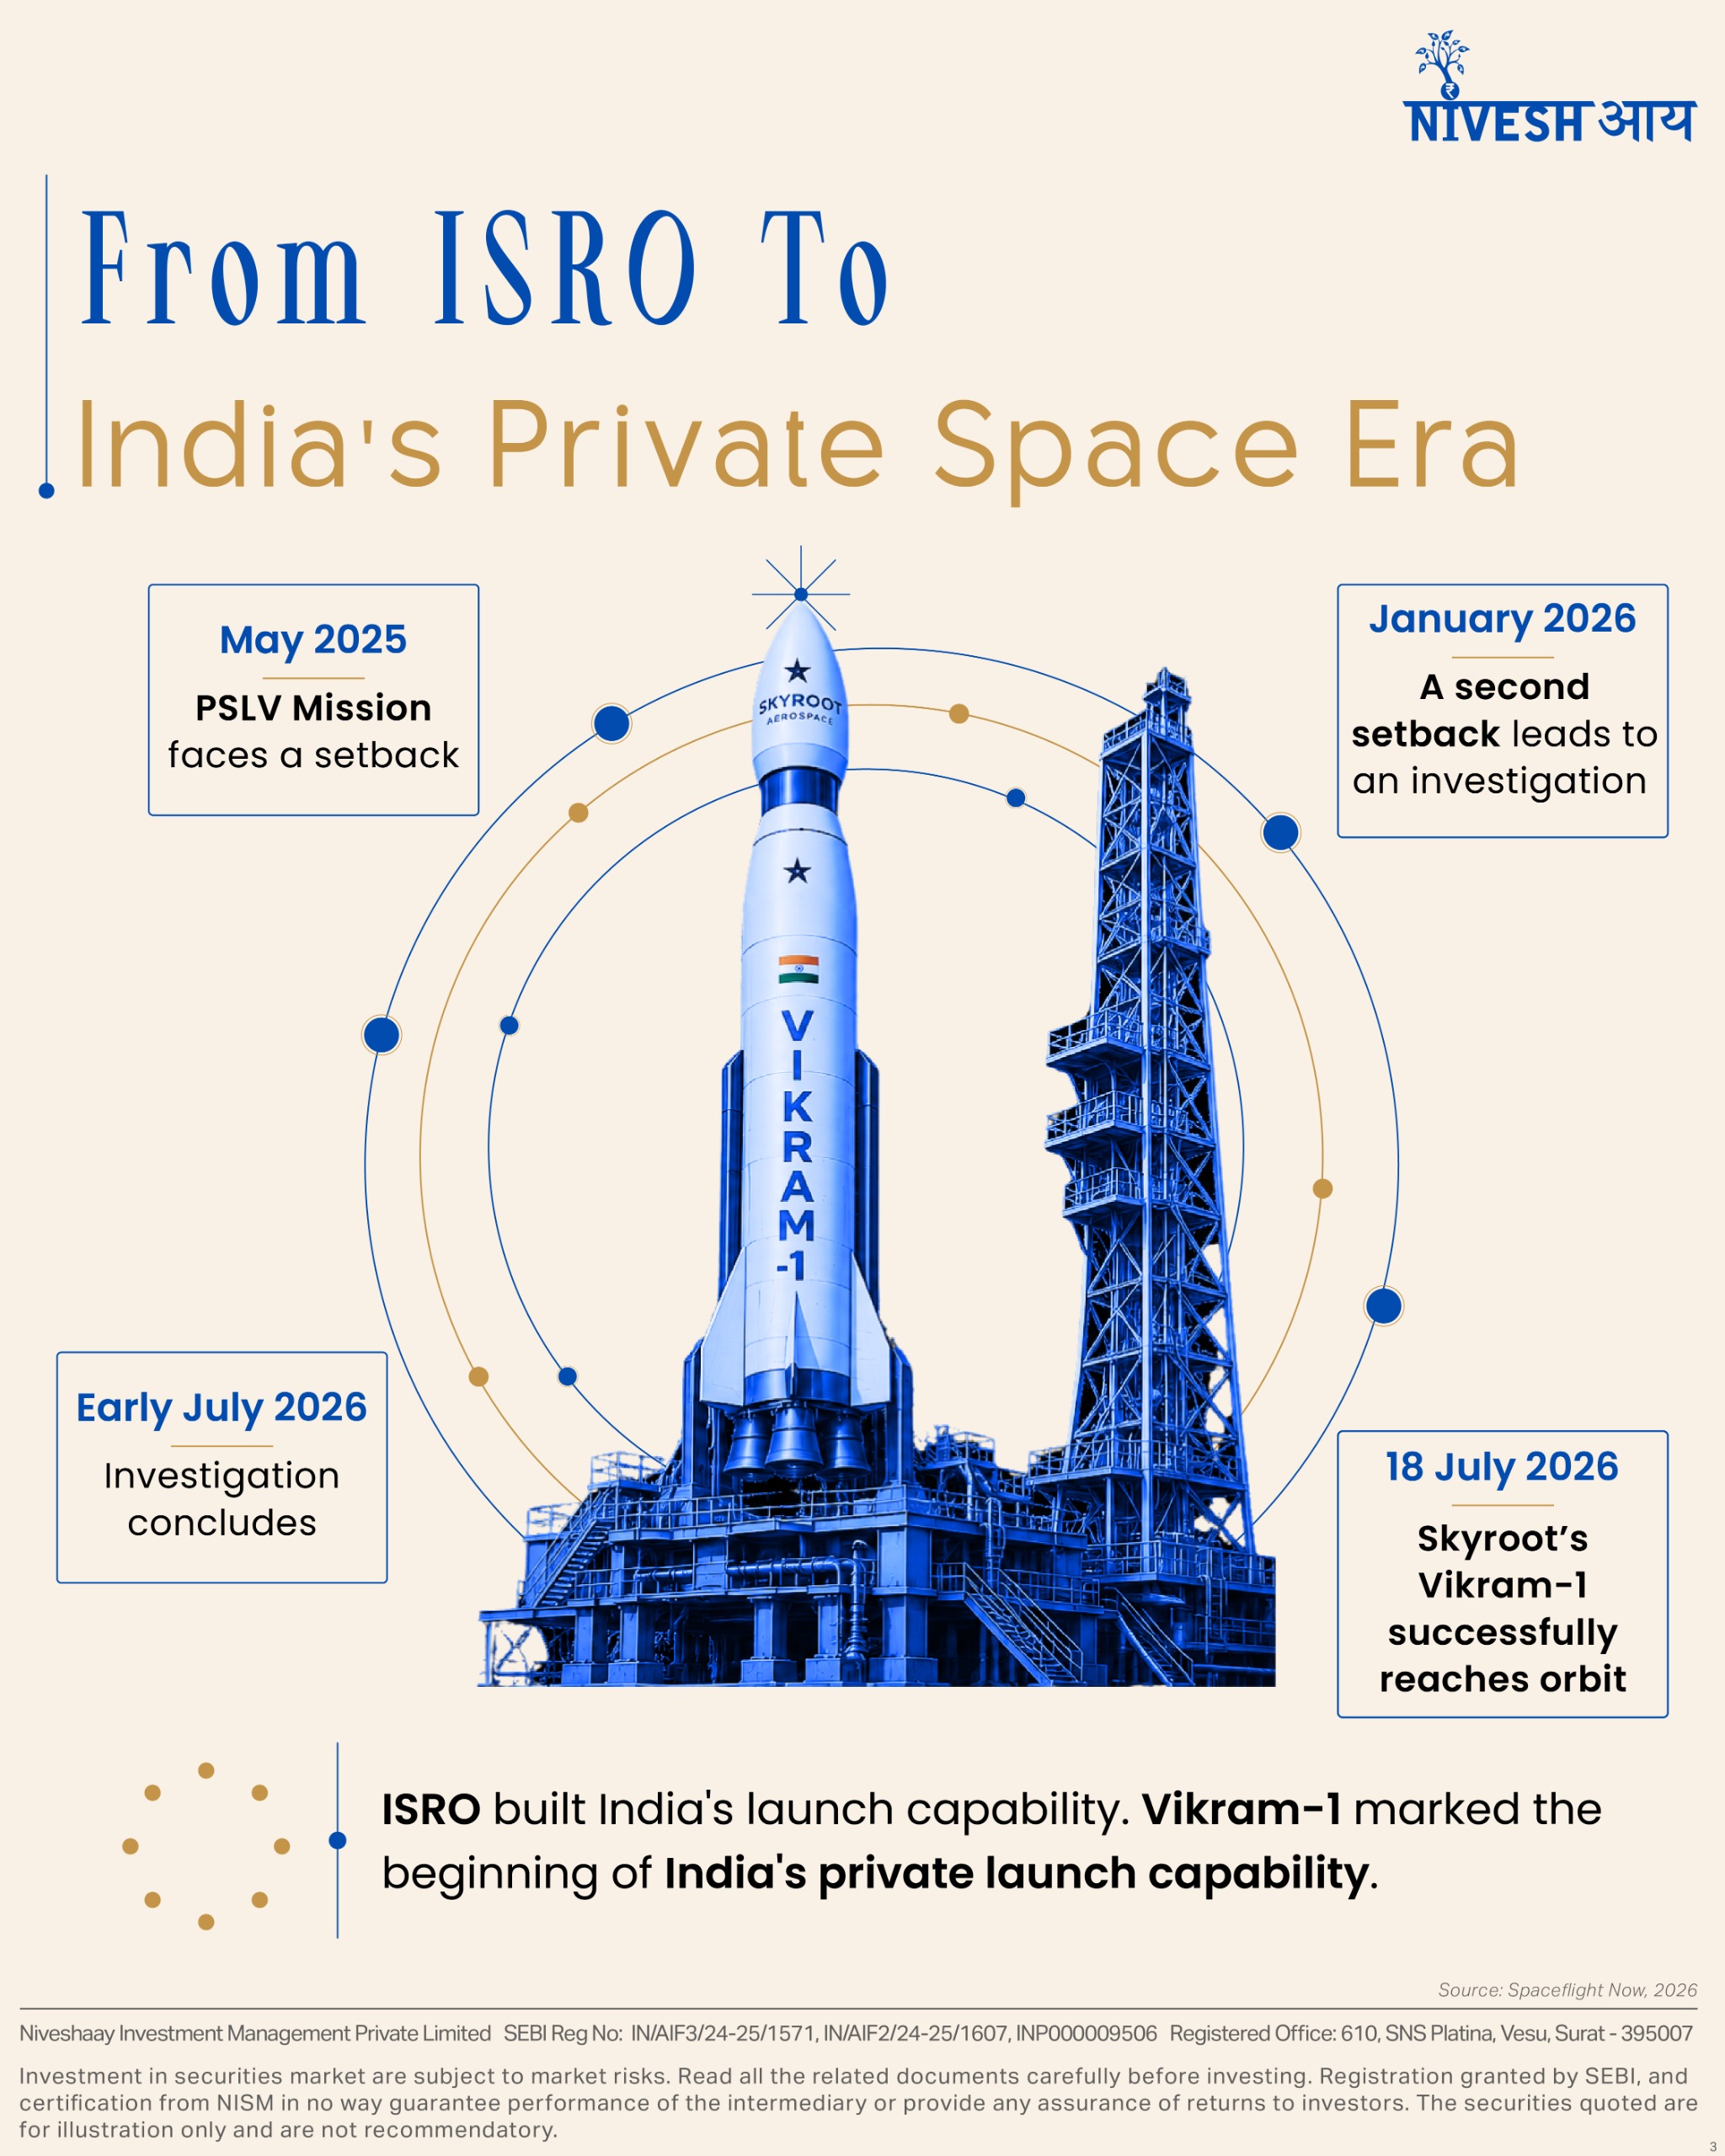
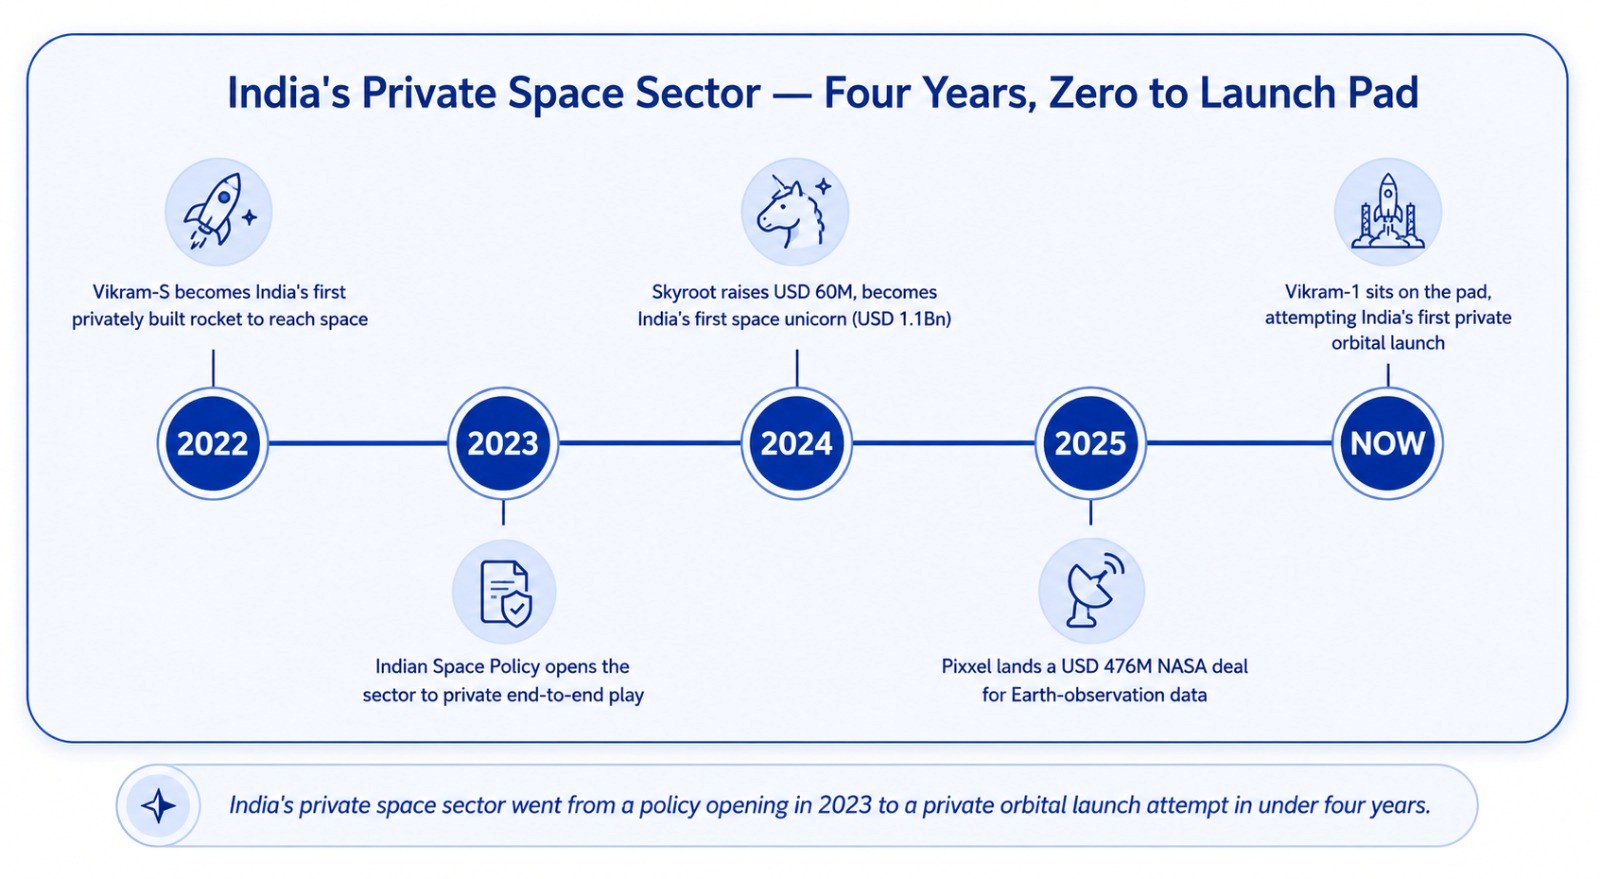
On July 18, 2026, a rocket built entirely by a private Indian company lifted off from Srihari Kota and reached orbit. No Indian company had done this before. Skyroot Aerospace's Vikram-1 carried two small satellites to a 450-kilometre orbit, fifteen minutes after liftoff. The mission was named Aagaman - Sanskrit for arrival.

On July 18, 2026, a rocket built entirely by a private Indian company lifted off from Srihari Kota and reached orbit. No Indian company had done this before.
Skyroot Aerospace’s Vikram-1 carried two small satellites to a 450-kilometre orbit, fifteen minutes after liftoff. The mission was named Aagaman – Sanskrit for arrival.
A four-year-old startup has now done what ISRO spent six decades building toward.
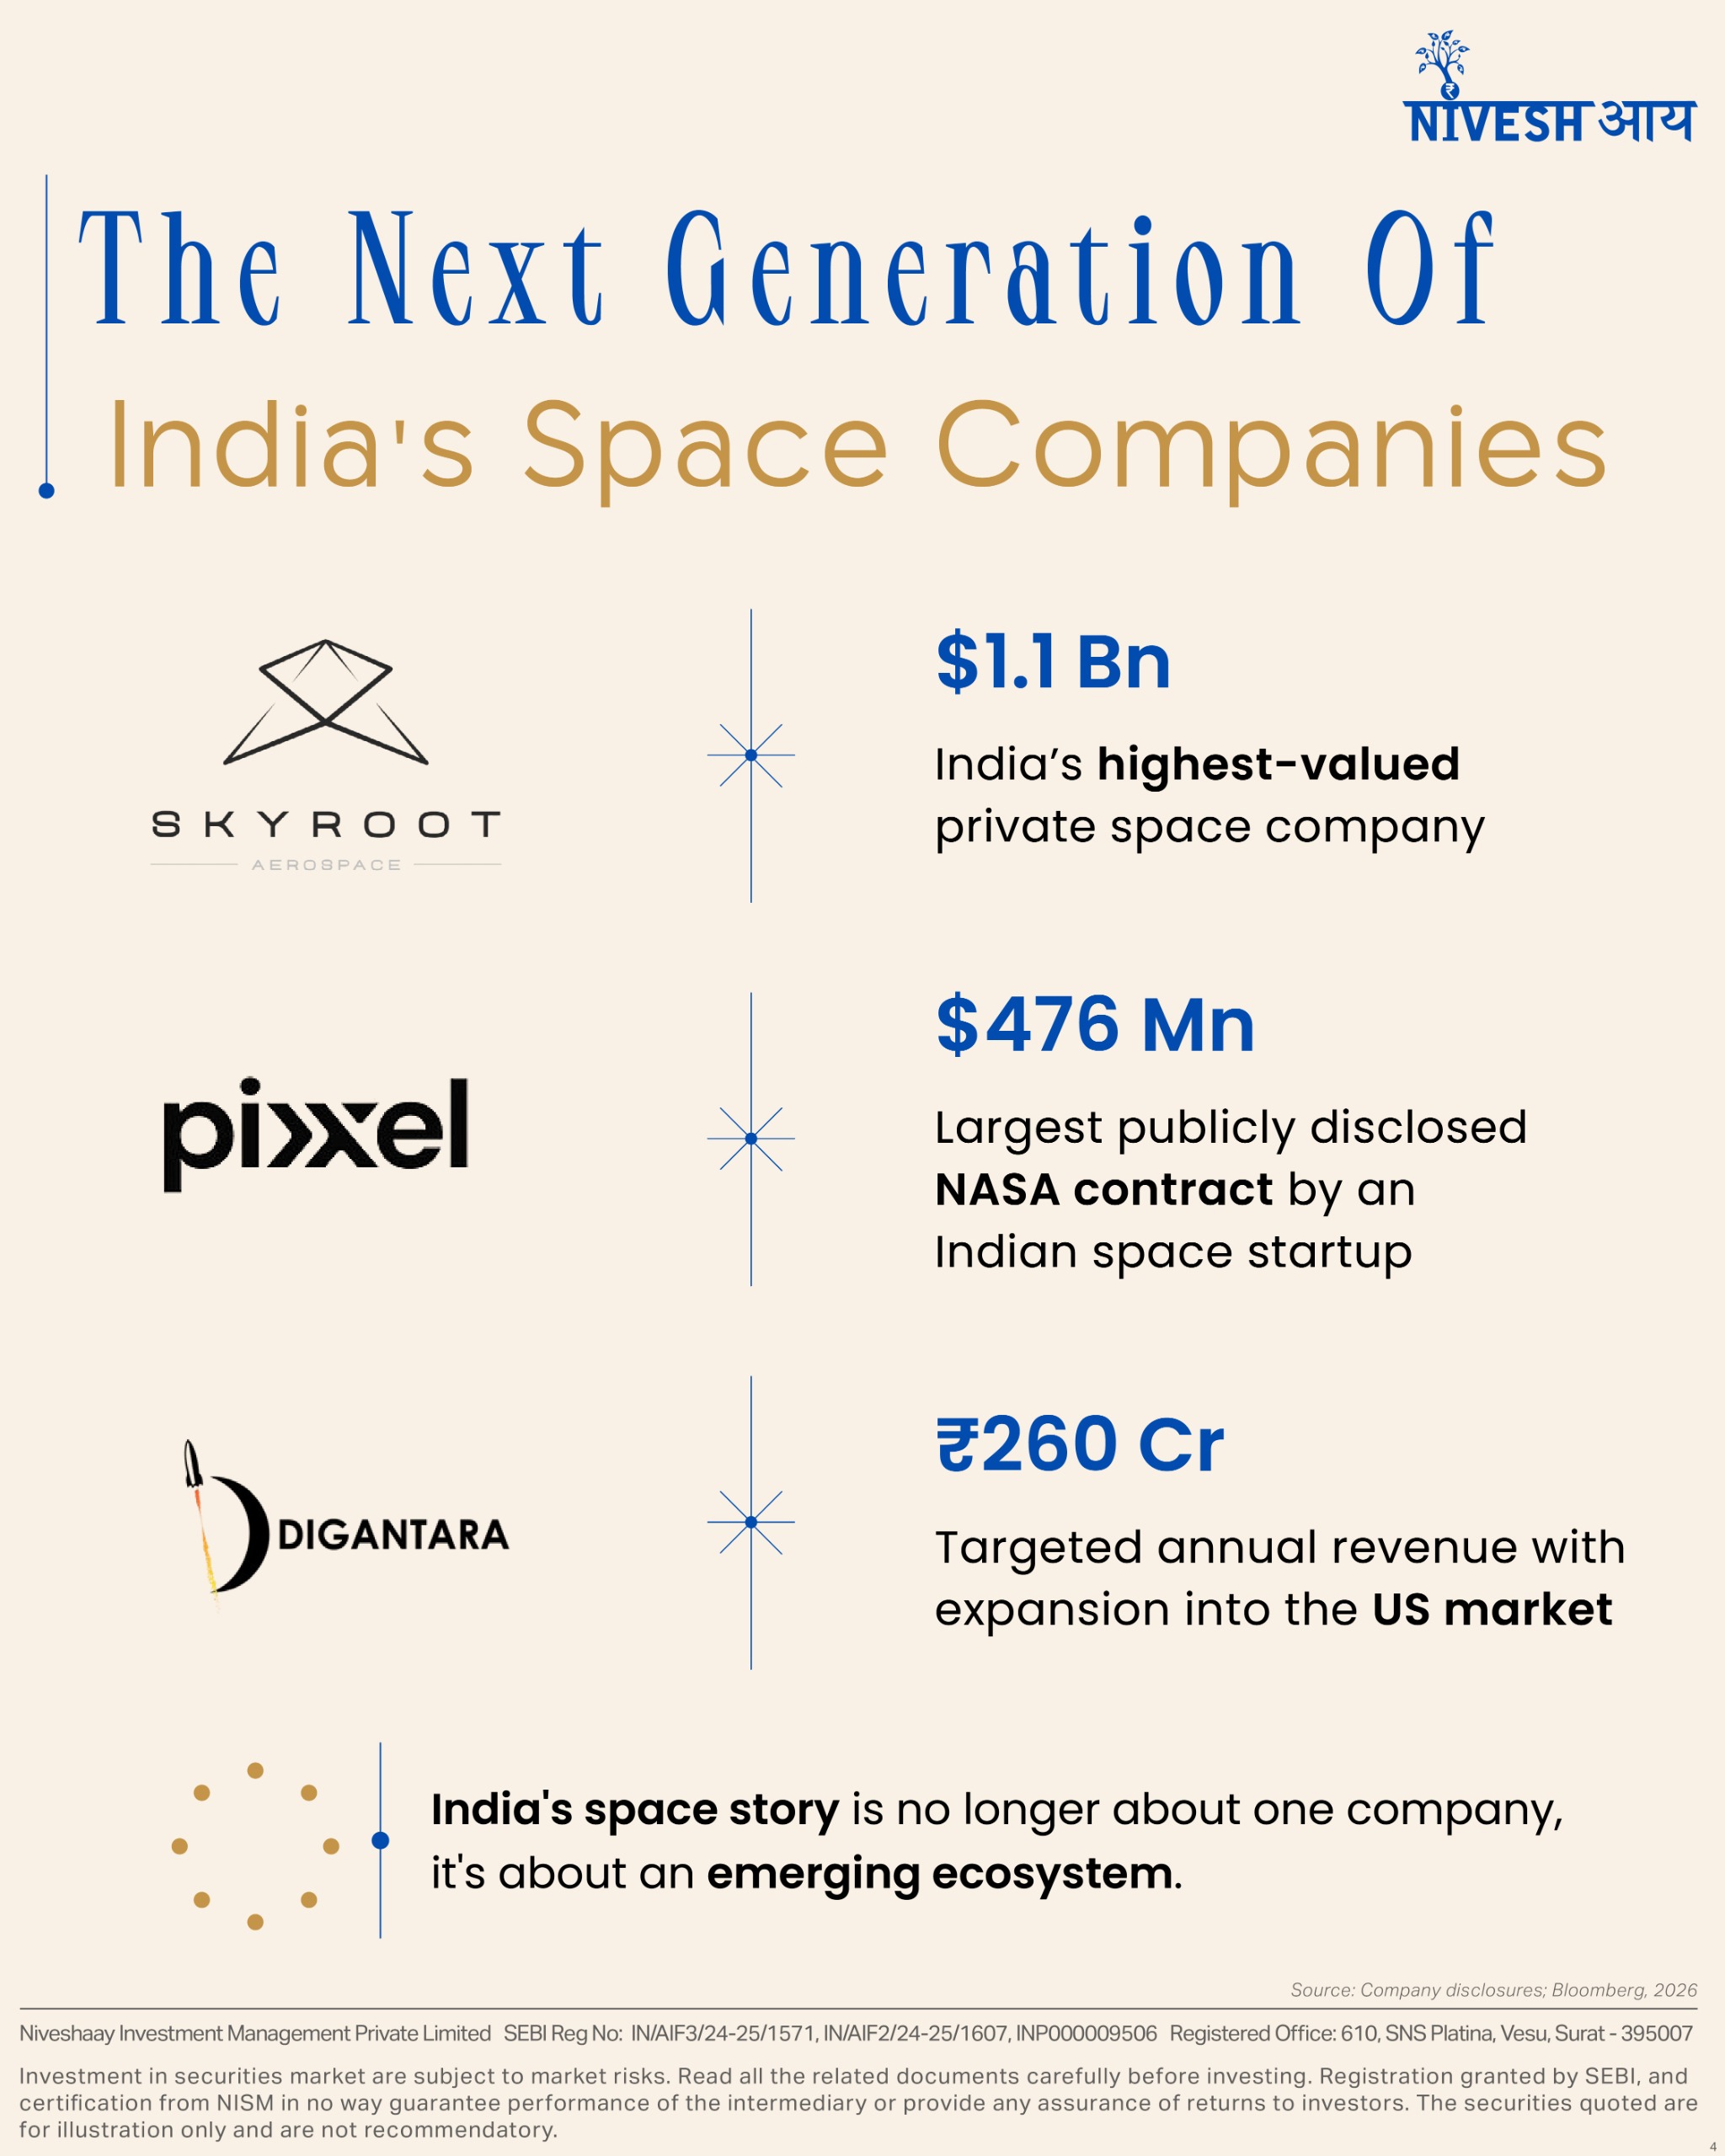
Skyroot is also India’s newest unicorn, valued at $1.1 billion, up from zero in under four years. This piece looks at what the launch means, who else is building around it, and what still has to happen before one good flight becomes an industry.
Three years ago, India’s Space Policy of 2023 opened a door that hadn’t existed before: private companies could build, launch, operate, and sell what they see from orbit – not just supply components to a single state operator.
Vikram-1 is the first flight to actually walk through it.
Before the launch detail, here is who is converting that opening into hardware, contracts, and revenue.
Skyroot Aerospace: India’s first space unicorn
Pixxel: The data business already working
Agnikul Cosmos: The engineering-first bet
Centum Electronics: The revenue-generating anchor most people miss
The timing added weight to the moment. ISRO’s own PSLV had suffered two consecutive launch failures of its own – in May 2025 and again in January 2026 – and only concluded its investigation into the second one in early July 2026, days before Vikram-1 flew.
For the first time, India’s private and state space programmes were being watched side by side under very different pressure. This time, the private attempt was the one that worked.
One regulatory gap is still worth flagging: India’s Space Activities Bill – which would give IN-SPACe’s authority a legislative foundation under India’s Outer Space Treaty obligations – had still not passed Parliament as of July 2026.
Every other major spacefaring nation passed this kind of law before opening its sector to private launch. A successful Vikram-1 flight is likely to add pressure on Parliament to close that gap.
Skyroot, Pixxel, Agnikul, and Centum are the headline names. The ecosystem around them is what makes this an industry rather than four lucky companies:
There’s also a consumer-facing thread. Jio and Airtel both signed distribution deals with Starlink in March 2025, and regulators cleared Starlink to operate commercially by mid-2025.
Reports now suggest Mukesh Ambani is evaluating a rival LEO constellation of his own – a genuine India-vs-India contest for low Earth orbit connectivity, not just India-vs-SpaceX.
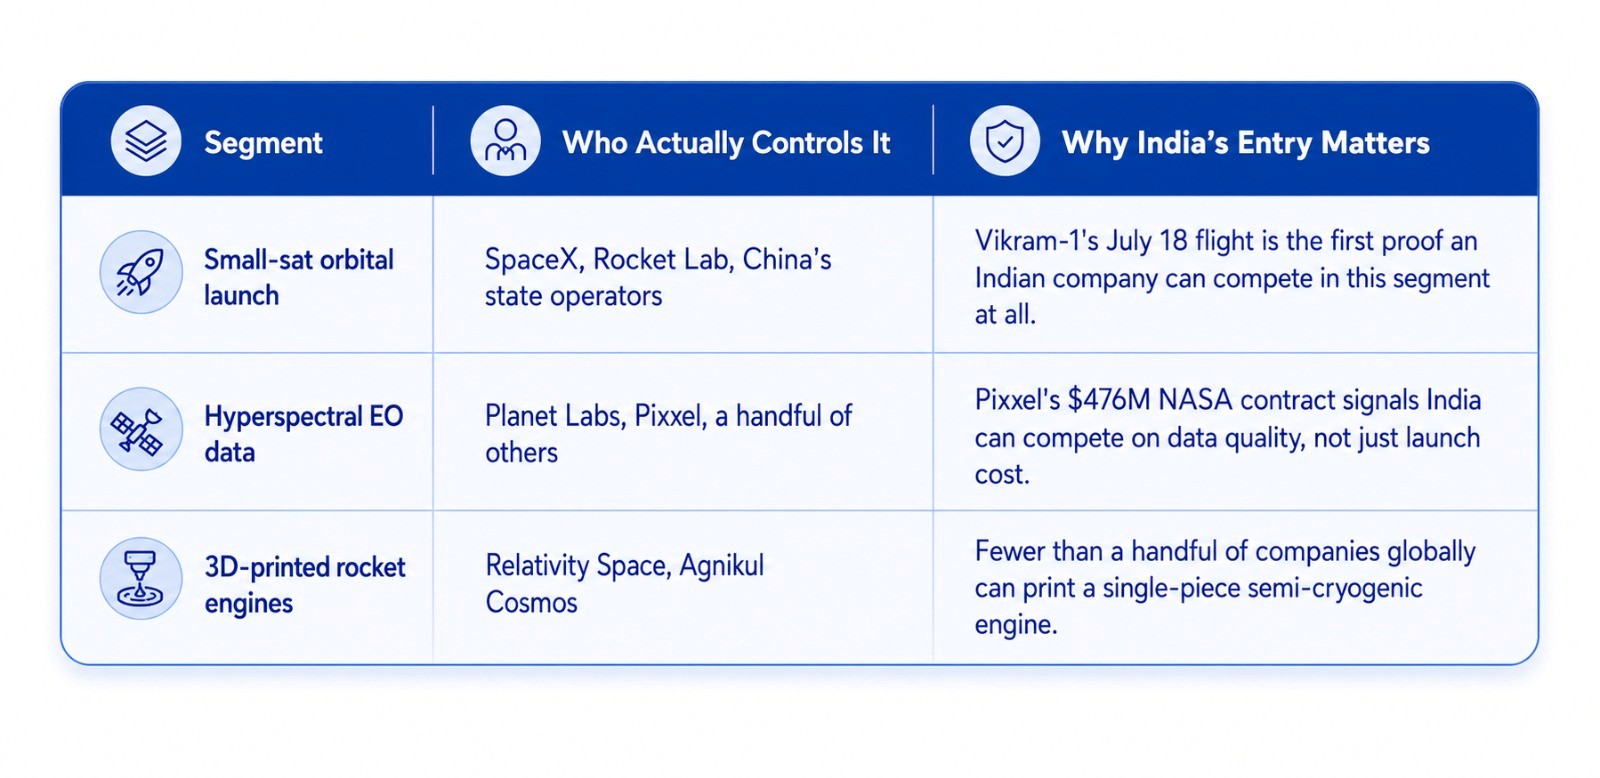
Orbital launch remains a scarcity business globally, which is exactly why an Indian entrant matters:
Plotted by what they actually build, and whether they’re already earning from it:
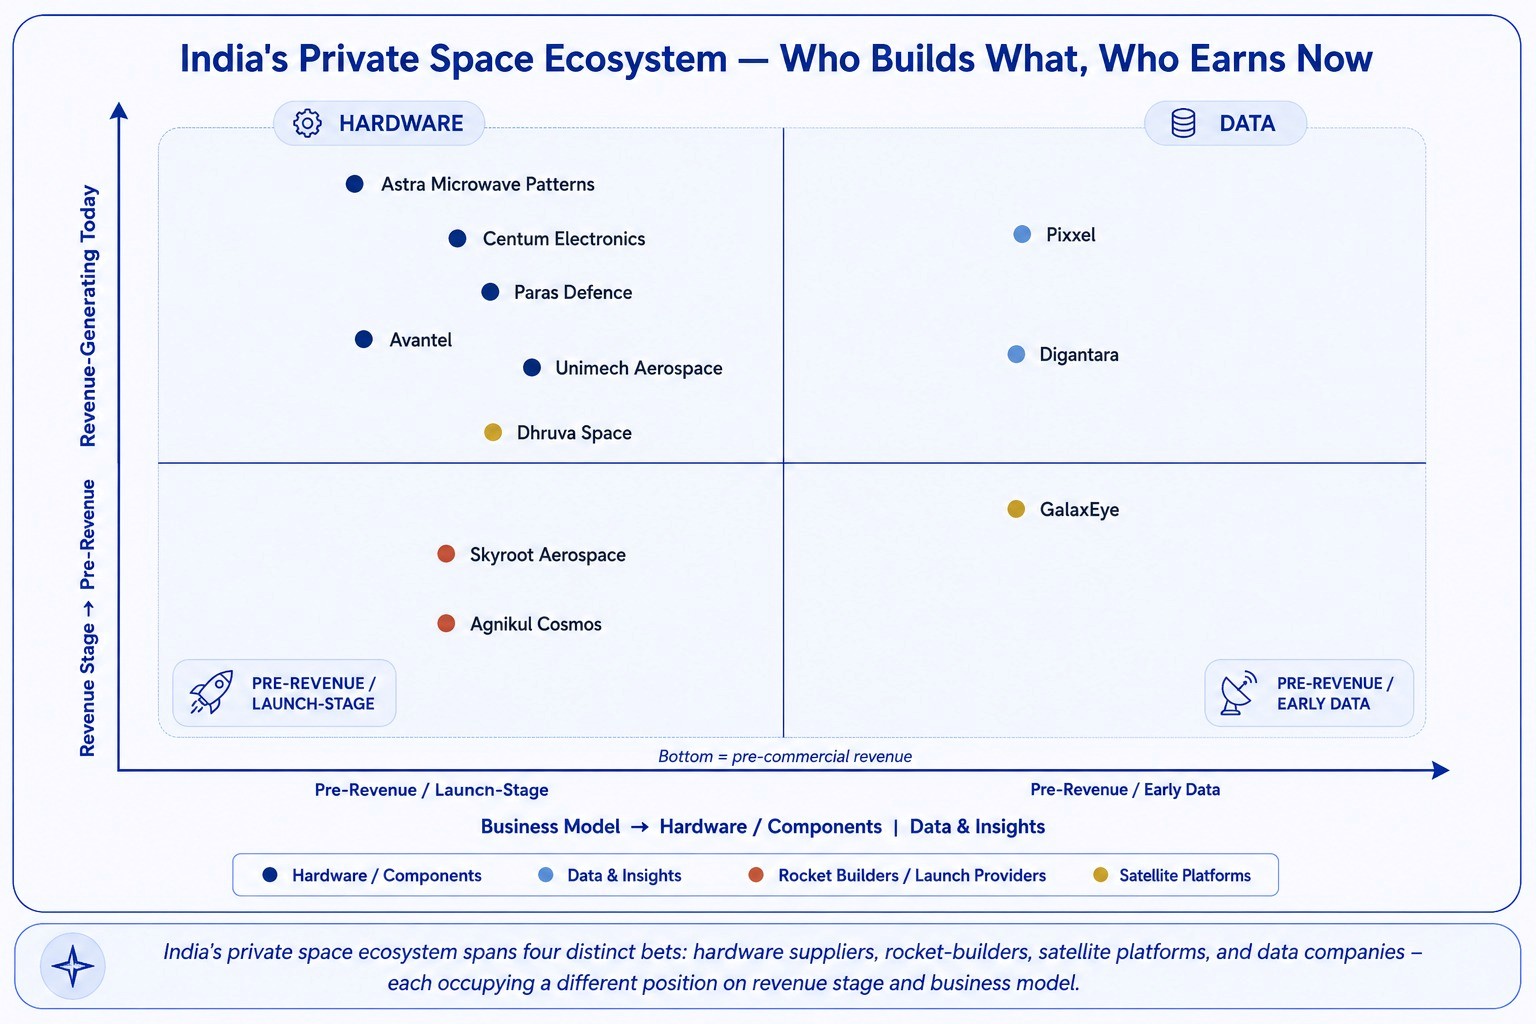
Analysts have noted that India’s emerging ecosystem is arguably more specialised than SpaceX’s own model: rockets, satellites, propulsion, and debris-tracking are each being built by a different company, betting on a different layer.
Skyroot leads on capital raised, but funding size does not equal revenue – Centum and Pixxel are the two closest to real cash flow.
It’s worth being honest about what one flight does, and doesn’t, prove.
The next few launches – not this one – will show whether India’s private space sector is a genuine industry, or one very good flight.
India went from zero private orbital launch capability to a $1.1 billion space unicorn in under four years – and on July 18, 2026, Vikram-1 showed that valuation wasn’t the only real thing about it. Pixxel’s $476M NASA contract already proved the data side of this industry works. Vikram-1 has now shown the launch side can too
AI & Data Center
The next AI opportunity may not look like AI at all.
From $67.5Bn in hyperscaler commitments to a 21-year tax holiday, from GPU shortages to sovereign AI, India is quietly building the physical backbone of the next computing era.

Everyone is watching the models.
We’re watching what makes the models possible.
From $67.5Bn in hyperscaler commitments to a 21-year tax holiday, from GPU shortages to sovereign AI, India is quietly building the physical backbone of the next computing era.
The opportunity isn’t confined to software.
It spans power, fibre, cooling, semiconductors, cloud and digital infrastructure 🏗️.
Because every technological revolution eventually becomes an infrastructure story.
👉 Swipe through to explore India’s AI infrastructure build-out – one layer at a time.
Which layer of the AI ecosystem do you believe creates the biggest long-term opportunity?
You can read our DETAIL BLOG here.
AI & Data Center
The AI Compute Race No One is Talking About
Inside India's AI compute race: $67.5B in bets, a 3% data centre gap, and the chips deciding who wins.

Big tech’s top executives just paid ₹15–30 lakh a night for hotel suites in Delhi.
Not for a wedding. Not for a cricket final.
For an AI summit.
That is what a seat at India’s AI table costs right now – and it’s still cheaper than what they’re paying for the thing they actually came for.
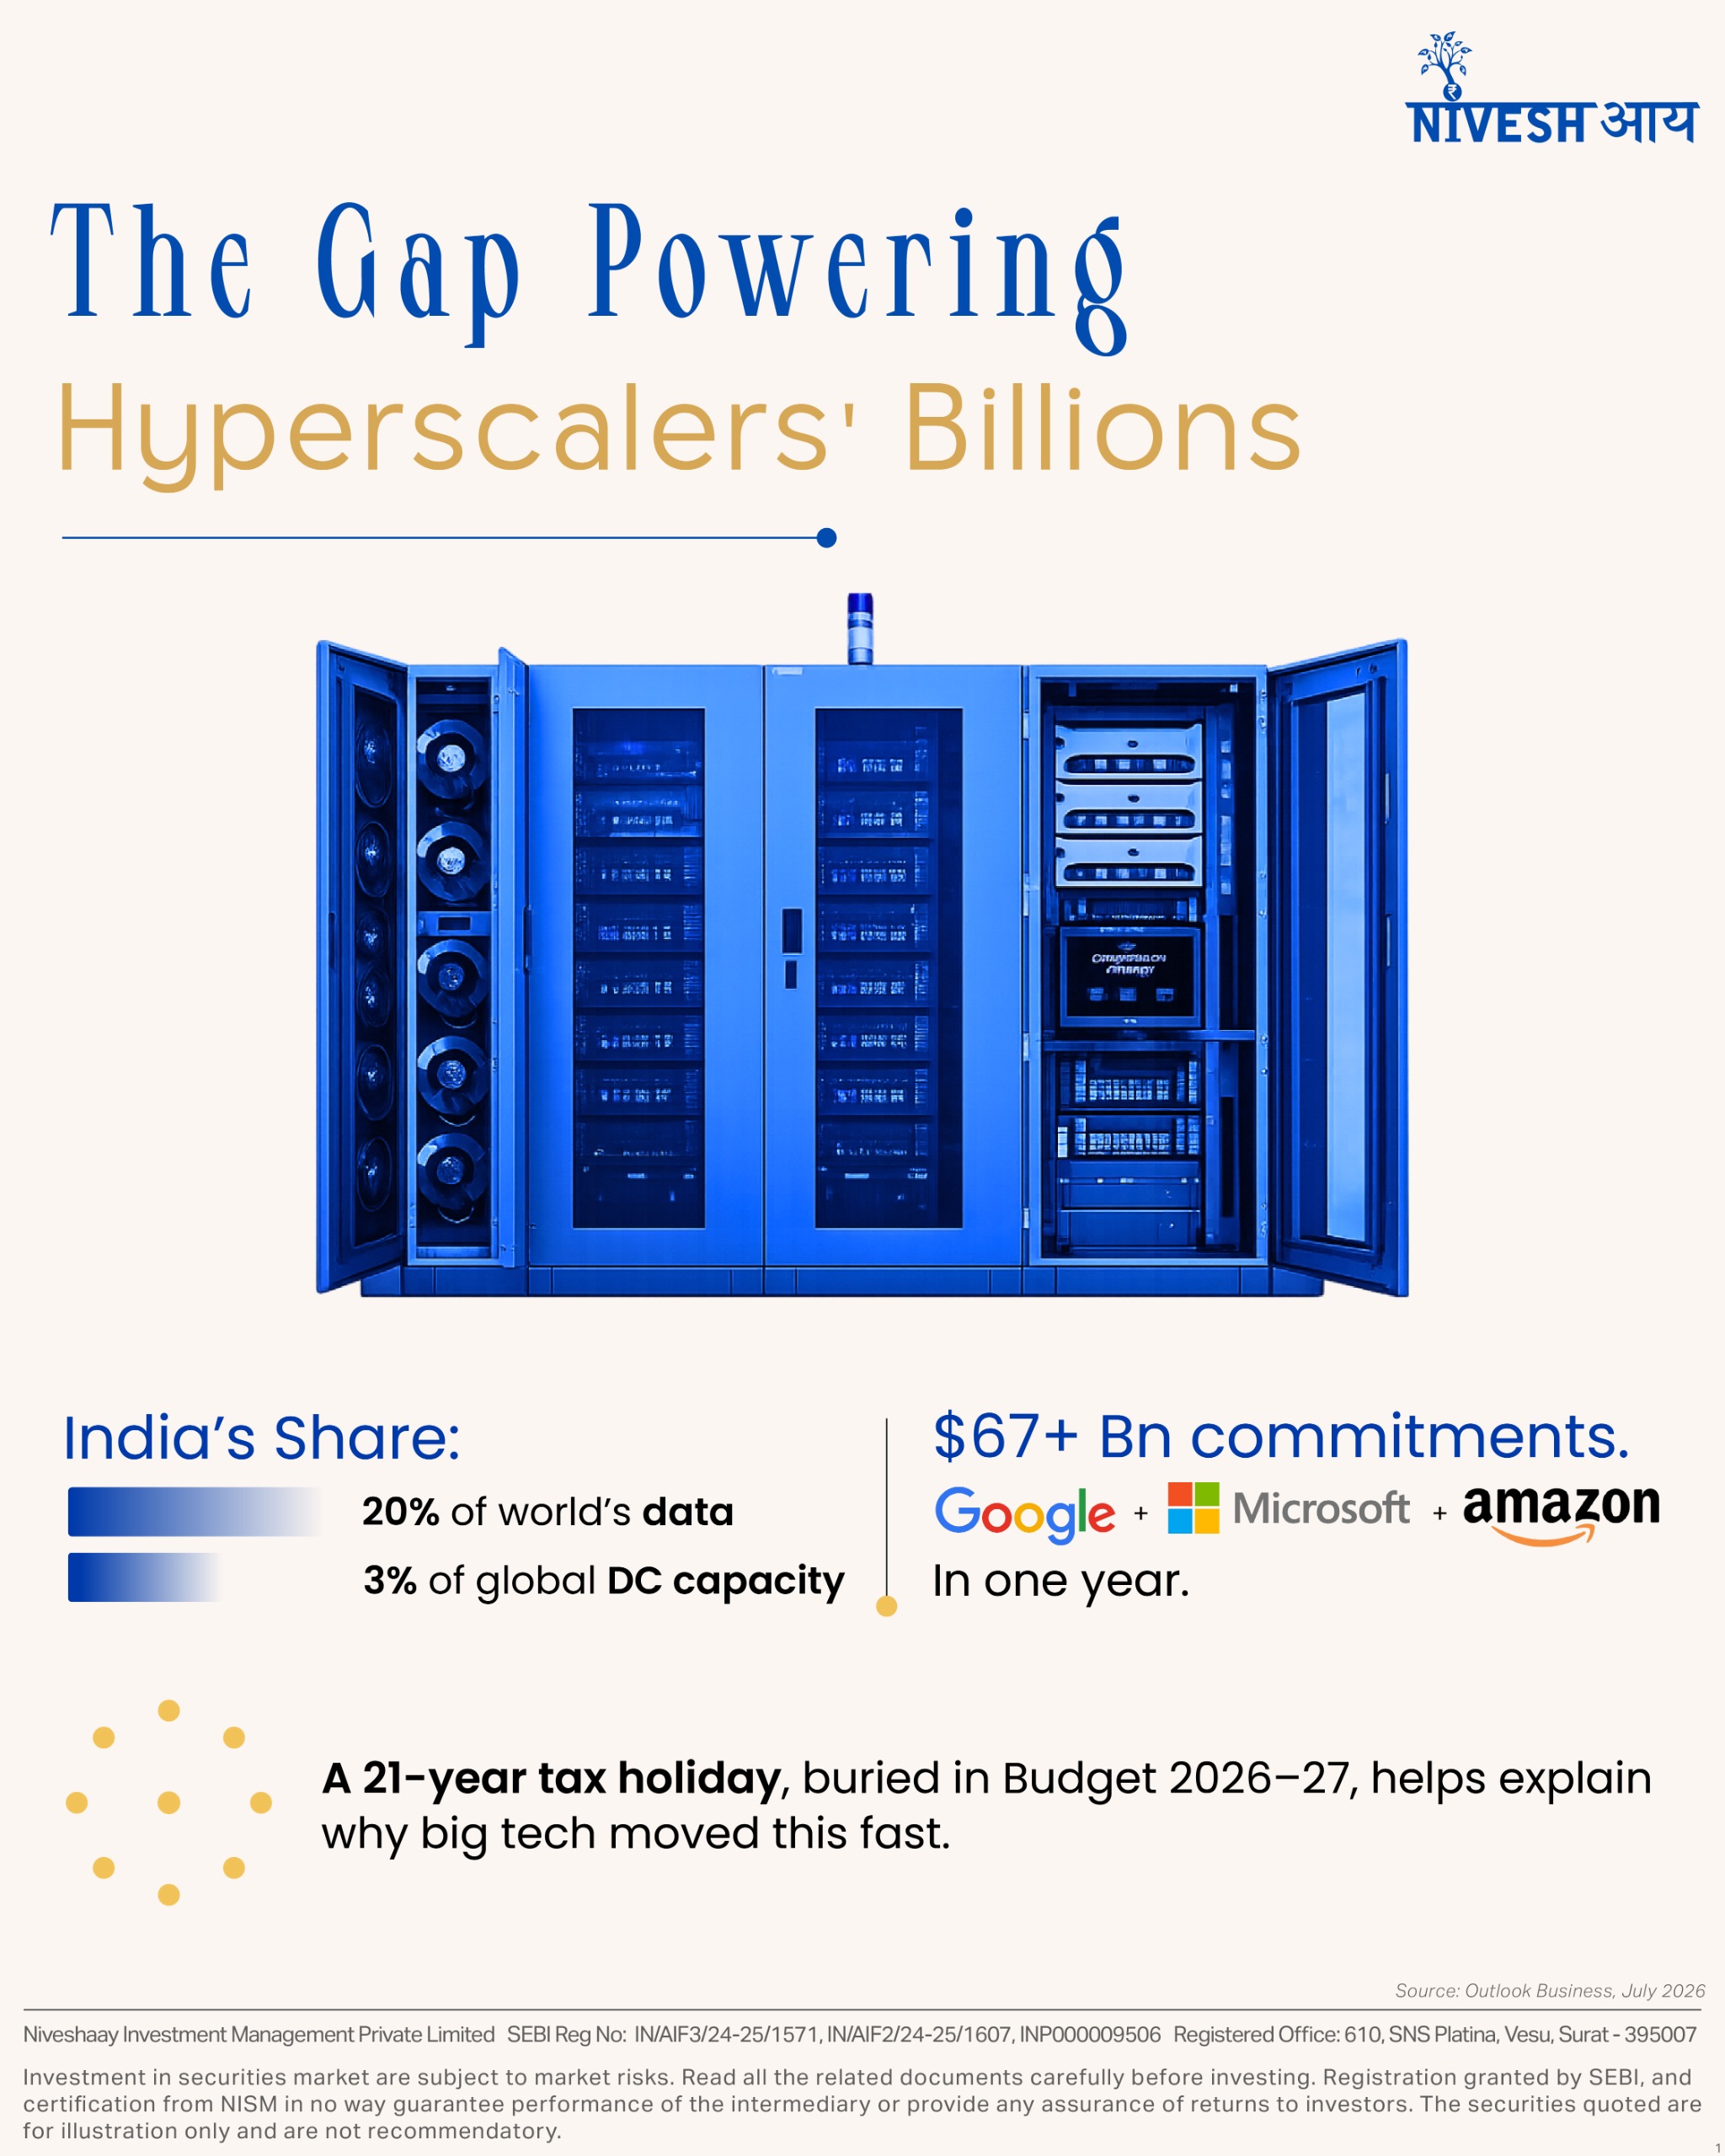
India generates roughly a fifth of the world’s data.
It hosts barely 3% of the world’s data centre capacity.
Sit with that gap for a second – because everything in this piece is an attempt to close it.
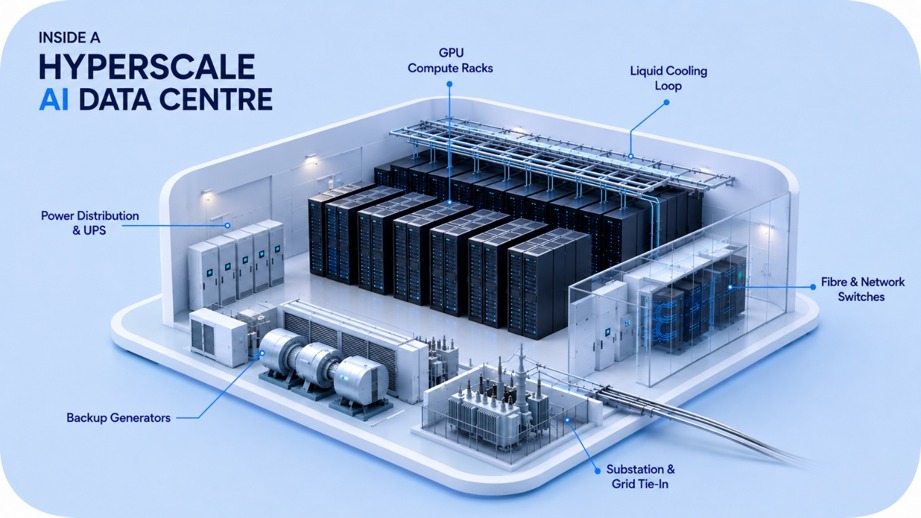
A data centre used to be a warehouse. Somewhere to park information until someone needed it. Now it computes, reasons, and answers.
Every AI query – yours, mine, a hospital’s, a bank’s – begins with something unglamorous: a server, in a rack, cooled by something, drawing power from a grid built to support it.
The intelligence is invisible. The infrastructure underneath it is not. And India is building that infrastructure at a pace that makes it worth watching closely.
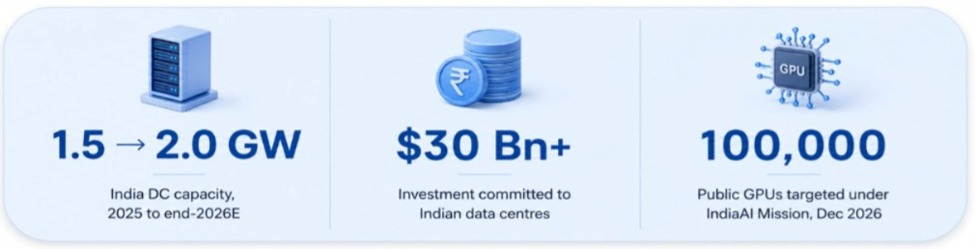
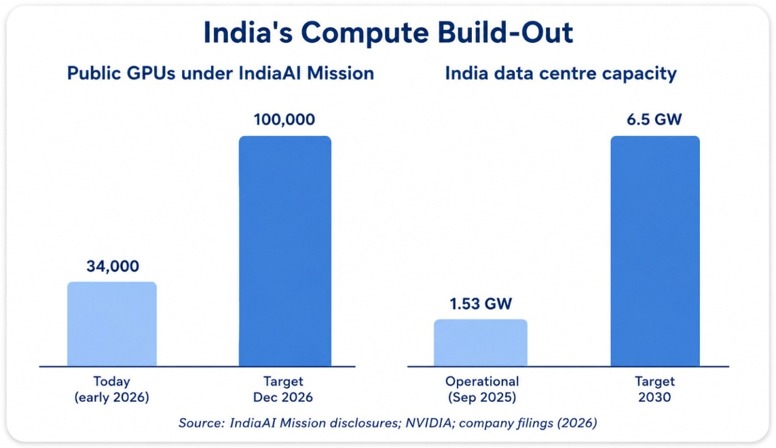
Two things are happening here, and it’s worth naming both before going further.
First: a data centre stopped being real estate and became a compute factory. Every AI query now needs a physical chain – GPU, rack, cooling, grid – that simply didn’t exist as an investable category five years ago. That’s not an upgrade to old infrastructure. It’s a new one.
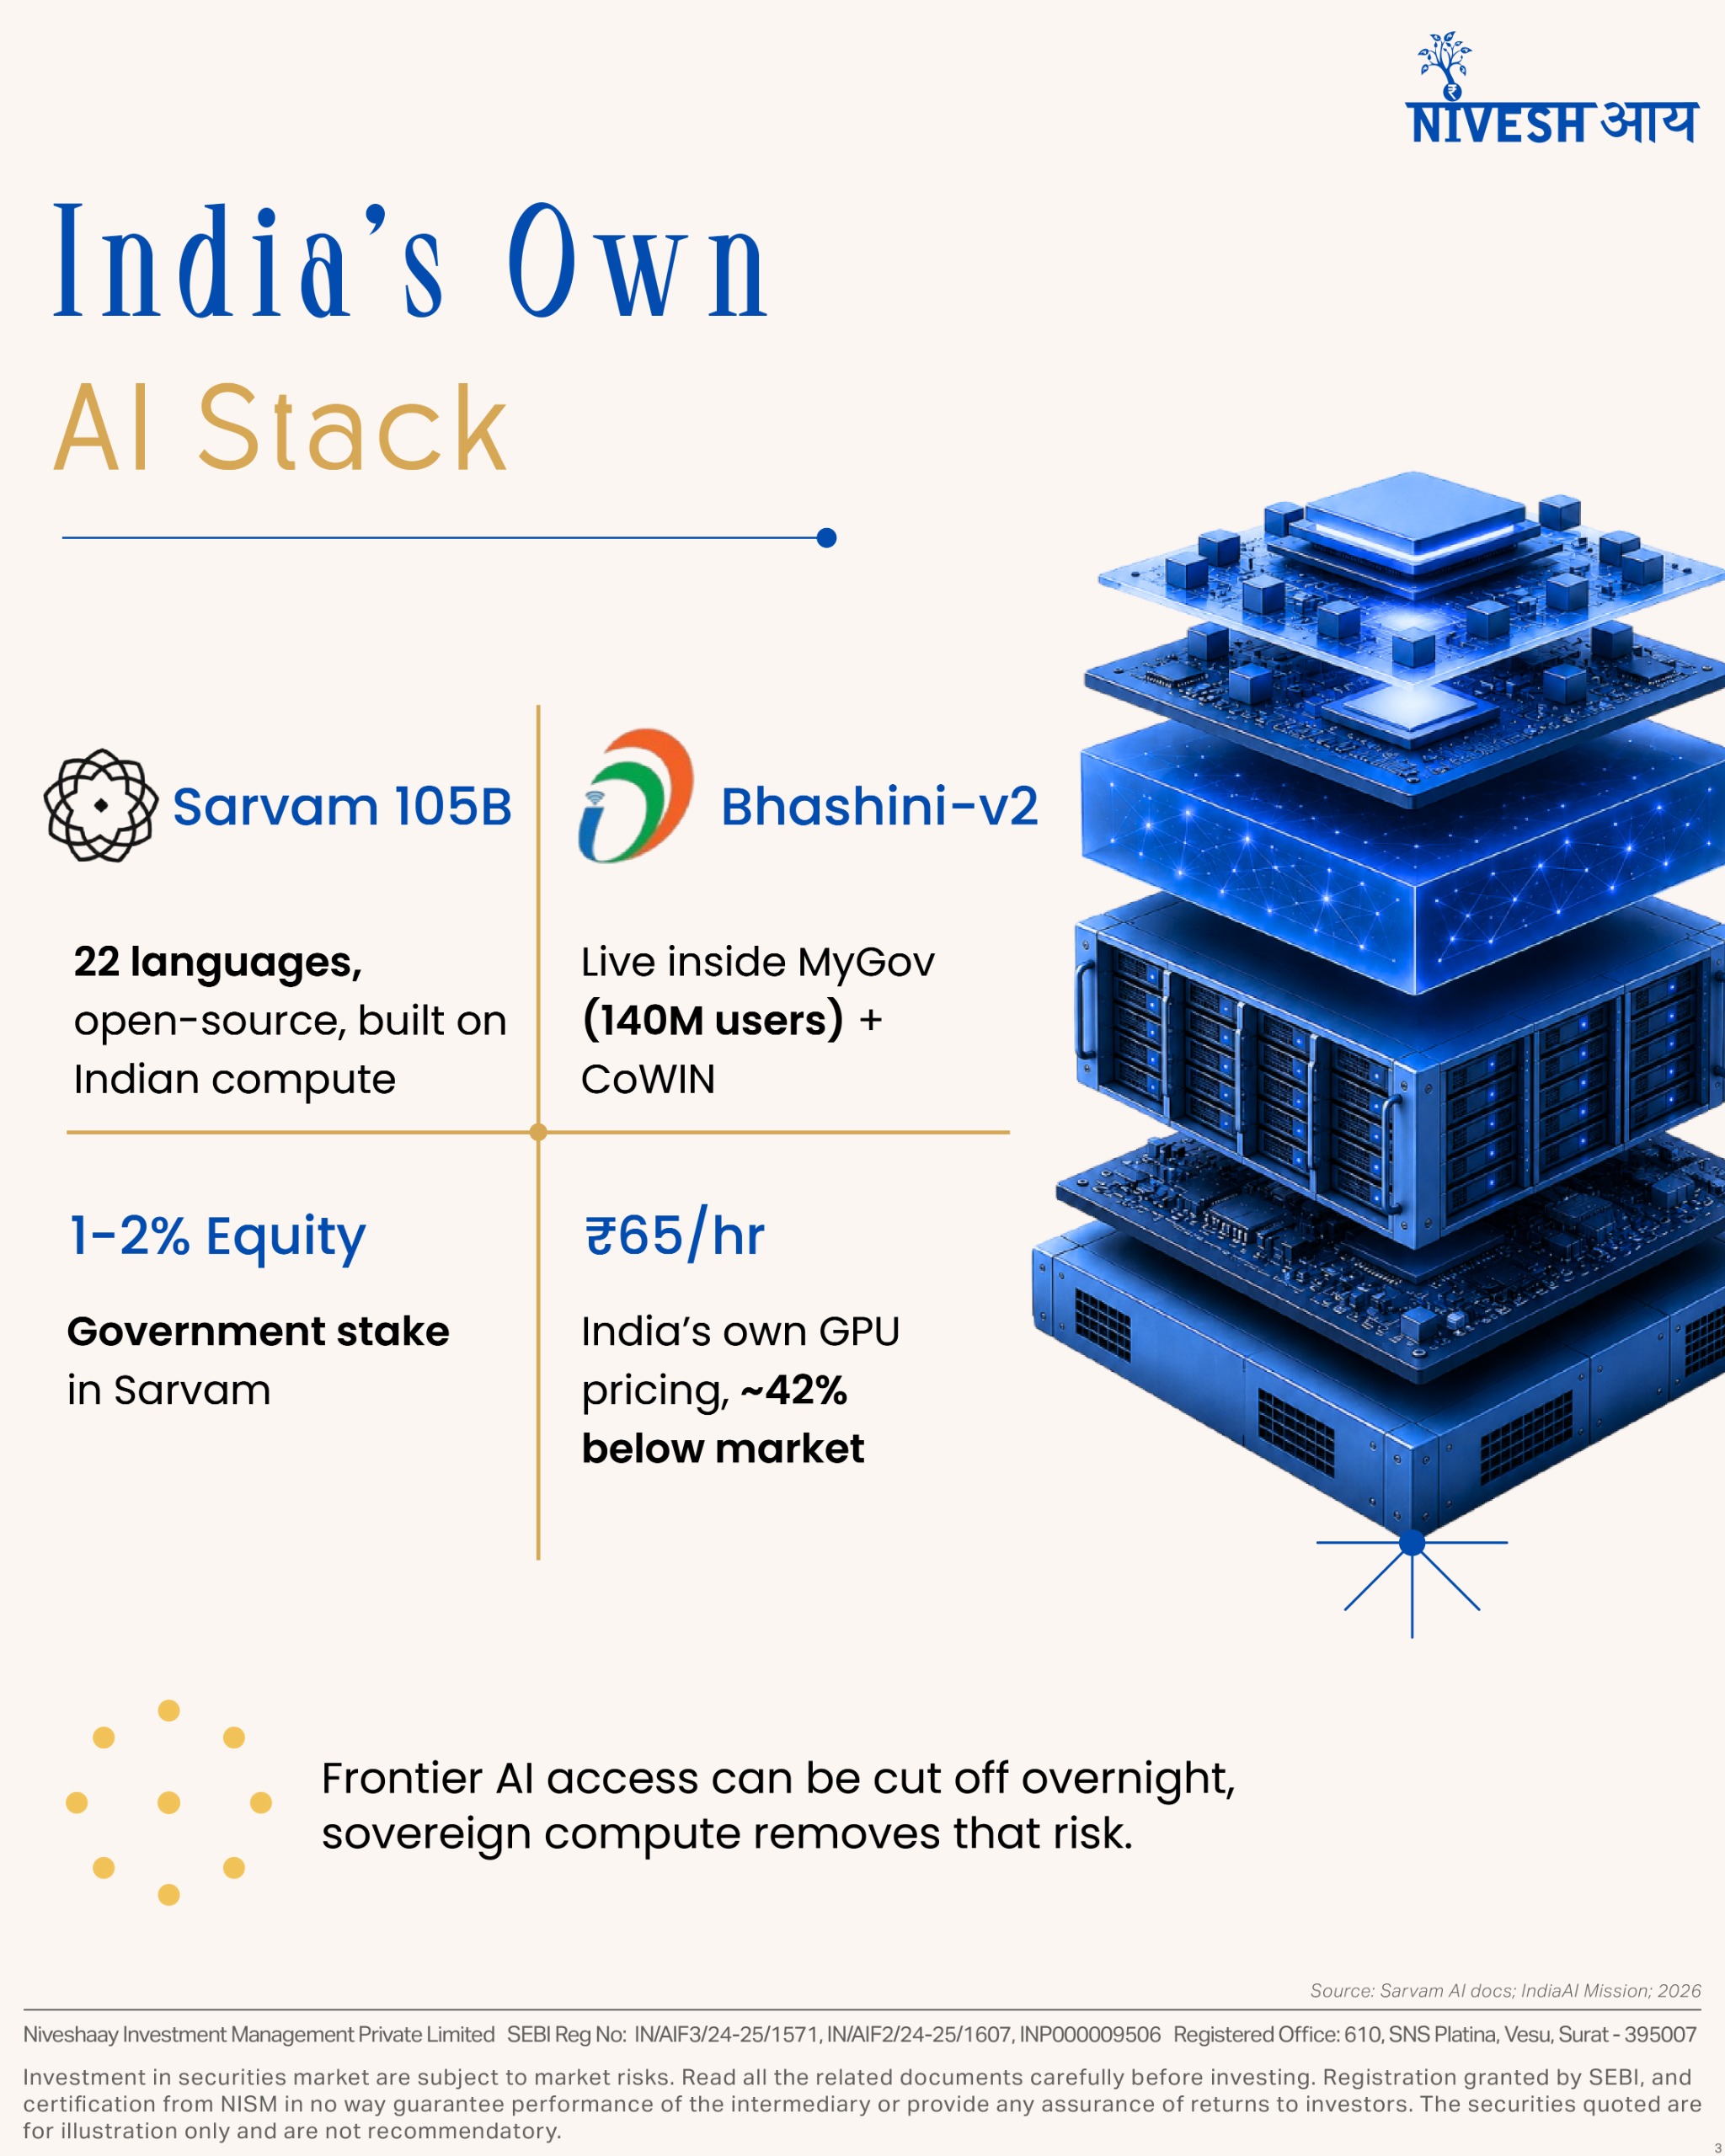
Second: The admission price was set specifically for India – it wasn’t simply copied from another country. India AI’s GPU access runs at ₹65 an hour – roughly 42% below market – a rate built around India’s own enterprise cost base, not adapted from a Silicon Valley number that assumed a wealthier buyer.
A genuine technology shift, priced for the market it’s actually built for. Everything below is what that combination is producing on the ground.
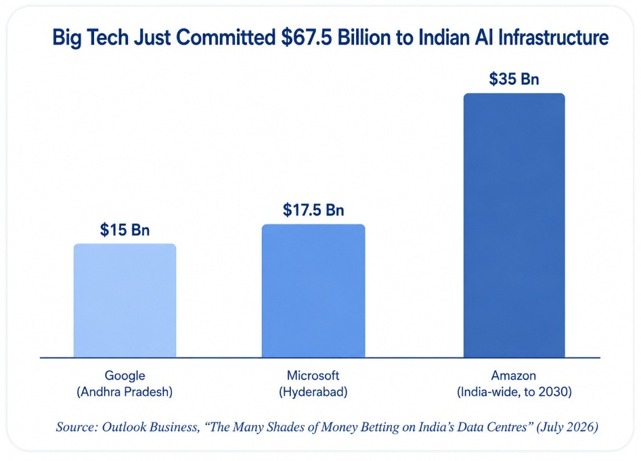
Google, Microsoft, and Amazon didn’t just announce projects in India this year. They wrote cheques for them:
That’s $67.5 billion in disclosed commitments from three companies alone, inside a single year.
And here’s the part almost nobody wrote about: buried inside Budget 2026-27, with zero fanfare, was a 21-year tax holiday – running all the way to 2047 – for foreign cloud providers building data centres in India.
It landed in the same week as two much bigger headline deals – a trade agreement with the EU, and a tariff deal with the US. Both ran away with the coverage. The tax holiday barely got a paragraph anywhere.
Big tech noticed anyway. Google, Amazon, Microsoft, and NVIDIA are the same four companies that reportedly booked those ₹15–30 lakh-a-night suites in Delhi, timed to a February AI summit – arriving within weeks of a policy most of the country never heard about.
This isn’t a speculative bet on future adoption, either.
An EY-CII survey of 200 enterprise leaders found 47% of Indian enterprises are already running AI in production – not pilots, live systems.
NITI Aayog estimates automation deployed at this scale could add $1.7 trillion to GDP by 2035.
A separate, broader dataset puts the adoption number even higher: Smallcase and Tickertape research pegs 87% of Indian enterprises as actively adopting AI solutions in some form – piloting, evaluating, or deploying.
The gap between that figure and the 47% production number is the gap between experimenting with AI and actually depending on it. Both point the same direction.
India’s own AI market is expected to reach $7-8 billion by the end of 2026, and roughly $35 billion by 2032 – a market that barely existed as a distinct category five years ago.
And the workforce pipeline is already being built to match: an IndiaAI Centre of Excellence in Education – ₹500 crore, 500-plus data labs across India’s technical training institutes – is already reaching roughly 1.5 lakh students, seeding the talent this entire compute build-out will eventually need.
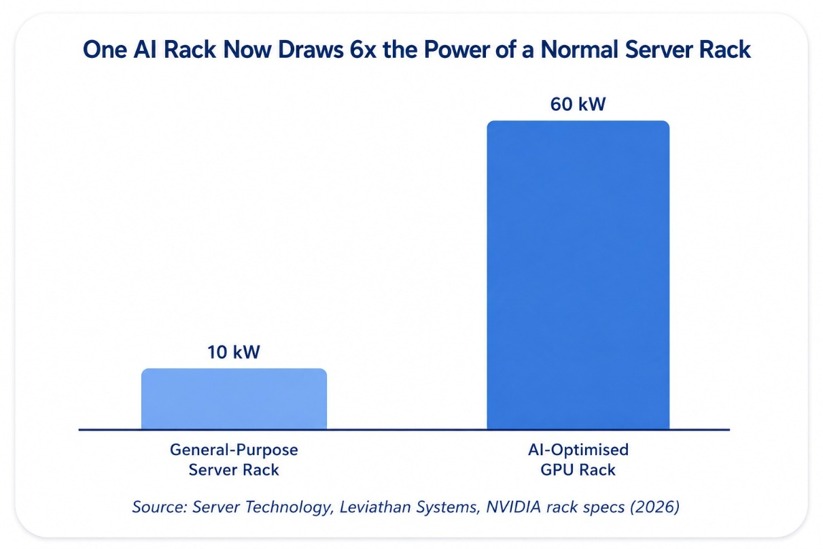
That single fact explains why the first box in the diagram above – the GPU rack – is now the most contested piece of real estate in Indian infrastructure. Six times the power draw means six times the cooling, six times the wiring, and a grid connection most sites simply don’t have yet.
Everyone covers the GPU shortage. Almost nobody covers what’s actually choking the GPU supply.
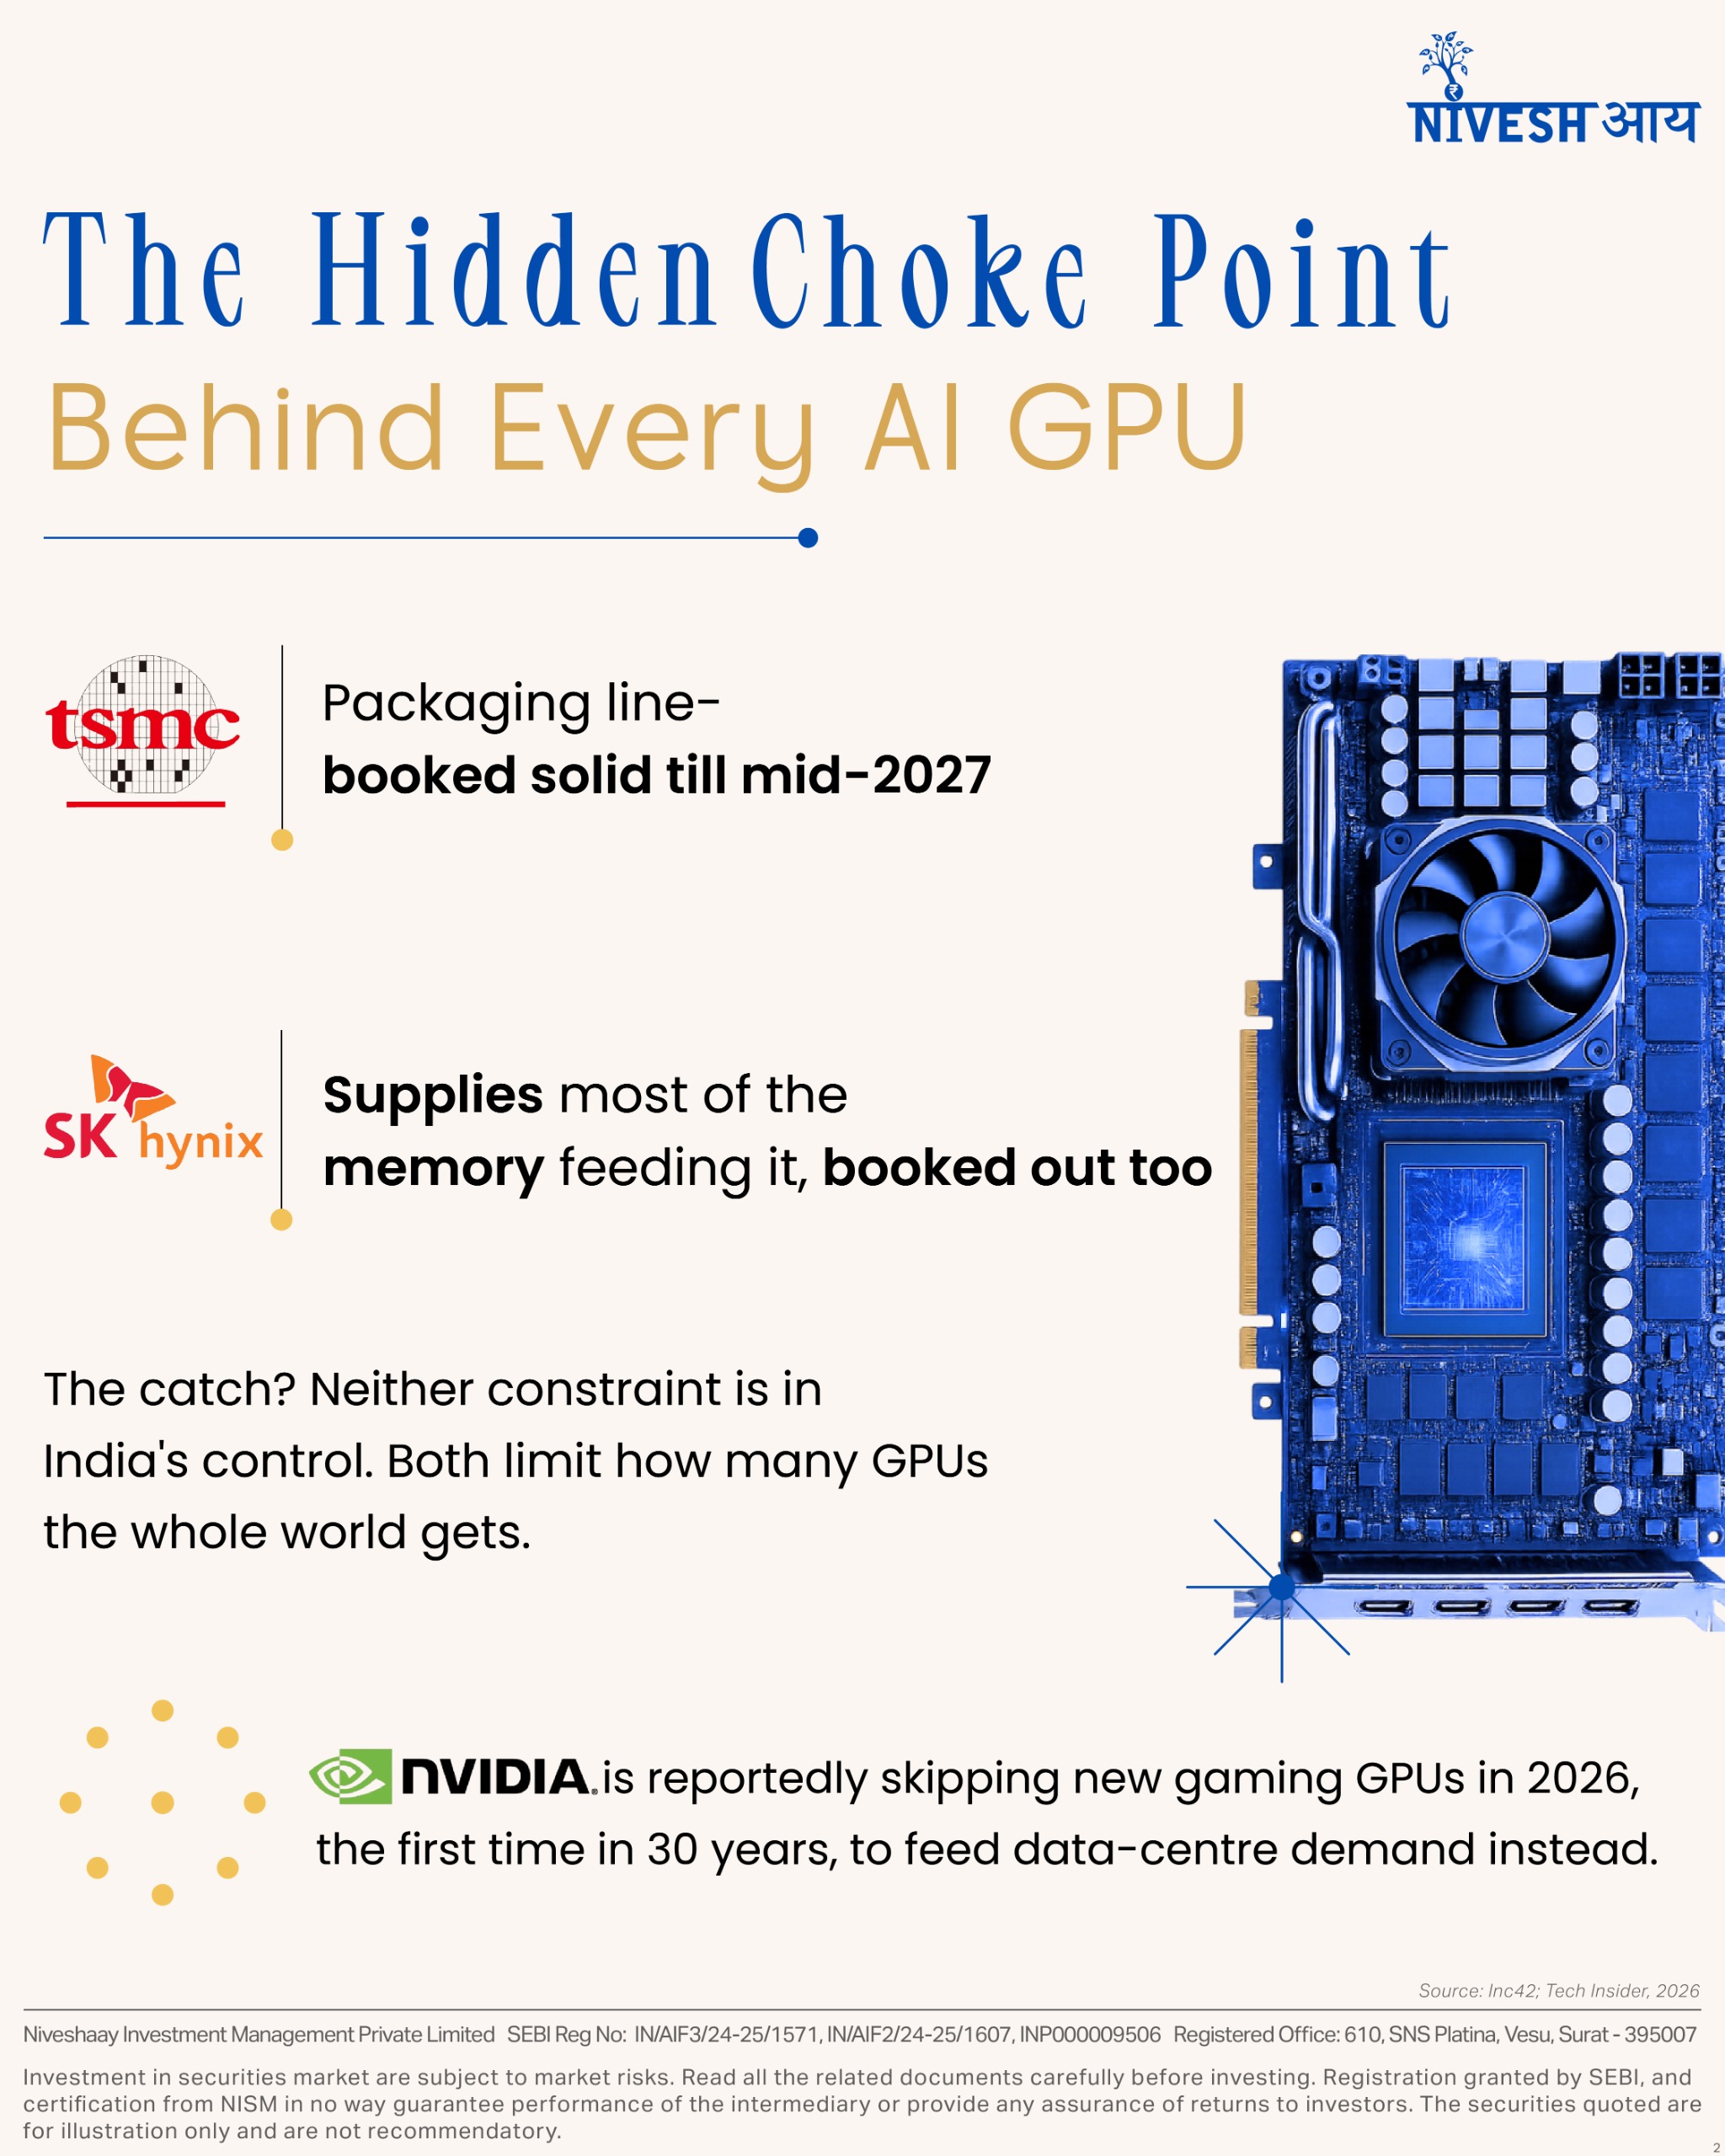
TSMC’s CoWoS packaging – the process that bonds high-bandwidth memory onto the GPU chip itself – is booked solid through at least mid-2027.
SK Hynix supplies most of the HBM3e memory going into that process.
Neither constraint has anything to do with India. Both cap how fast anyone, anywhere, can get new-generation GPUs.
Which is exactly why India’s early, subsidised allocation matters more than the headline GPU count suggests – the country isn’t just short on chips like everyone else. It has a queue position other buyer don’t.
The shortage is now severe enough that NVIDIA is reportedly skipping new consumer gaming GPUs entirely in 2026 – the first time in three decades.
The reported reason: data-centre chips are significantly more profitable per gigabyte of memory than gaming cards, so every unit of scarce HBM memory gets routed there first.
When a company redirects its own flagship consumer product line to feed data-centre demand, that is a clearer signal of real scarcity than any market-research report.
For a decade, India’s data centre story was a real-estate story: land, power connections, and cooling towers in Mumbai and Chennai. AI has turned it into something closer to a heavy-industry story.
Vestian’s latest estimate puts India’s installed capacity at 1.7-2.0 GW by the end of 2026, backed by nearly $60+ billion in investment – and a construction pipeline of 700 MW already underway.
CBRE projects roughly 30% year-on-year capacity growth in 2026 alone, with base-case forecasts of 4-5 GW by 2030, and AI-accelerated scenarios reaching 8-9.2 GW.
KPMG’s 2026 analysis goes further: planned investment and AI/HPC demand could grow India’s data centre capacity by roughly 10x over the next decade.
That is not a typo. That is what happens when a warehouse becomes a power plant.
But cheap land and tax breaks don’t build sovereign AI on their own. That takes compute – and increasingly, a model to run on it.
Behind the compute build-out sits a second, quieter story – the model that actually runs on it, and who owns a piece of it. It breaks into three parts.
In February 2026, Sarvam open-sourced Sarvam-105B. A few specs worth knowing:
No global frontier model matches that depth of Indian-language coverage.
That language coverage is not an accident. It’s the product of Bhashini-v2, the real-time translation and voice layer sitting underneath Sarvam.
It’s already deployed inside two large government platforms:
Bhashini is the reason Sarvam’s language coverage translates into something people can actually use, not just a benchmark score.
The government’s involvement didn’t stop at funding GPUs.
Reports in mid-2026 suggested a structured 1-2% equity stake in Sarvam, taken through compulsorily convertible debentures.
Sovereign AI in India now has a capitalisation table attached to it – a genuinely unusual arrangement by global standards.
The urgency behind all three of these moves was underlined, not created, by a development entirely outside India’s control.
In June 2026, US export restrictions temporarily limited access to two of Anthropic’s newer models, Claude Fable 5 and Claude Mythos 5, before being lifted at the end of the month.
Whatever the specifics of any single episode, the lesson generalises: access to frontier compute and frontier models can be restricted at short notice, for reasons no importing country controls. That is precisely the exposure sovereign compute is built to remove.
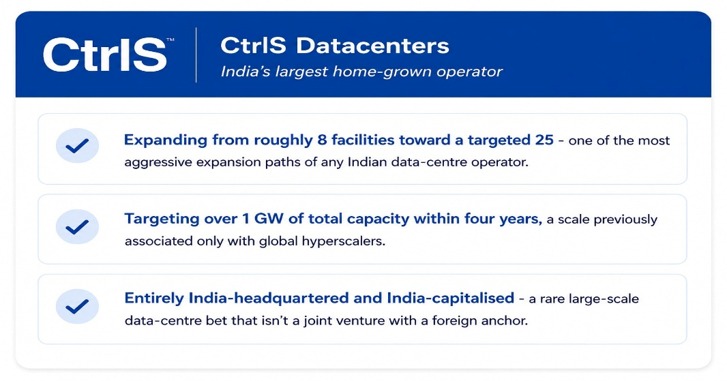
India’s industrial giants are entering the compute business directly, not just leasing it out.
A closer look at some companies actually converting this build-out into balance-sheet reality:
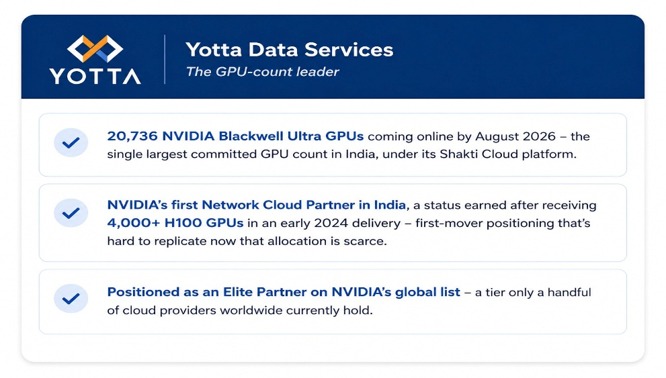
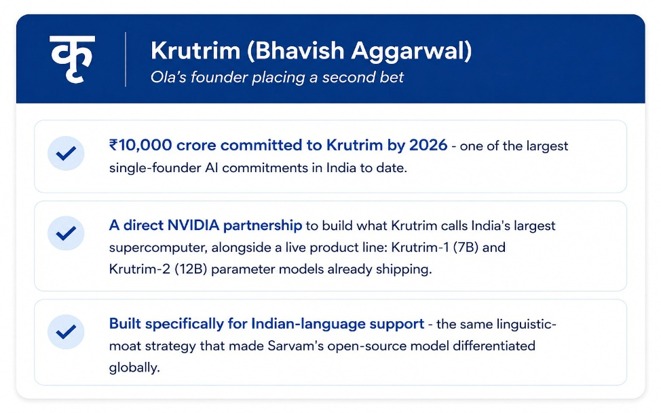
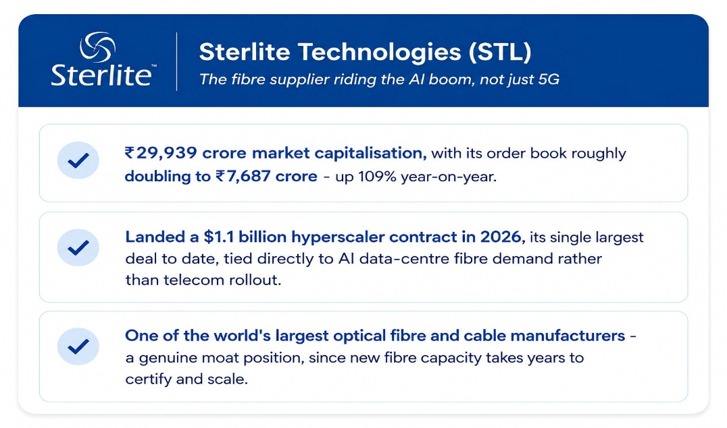
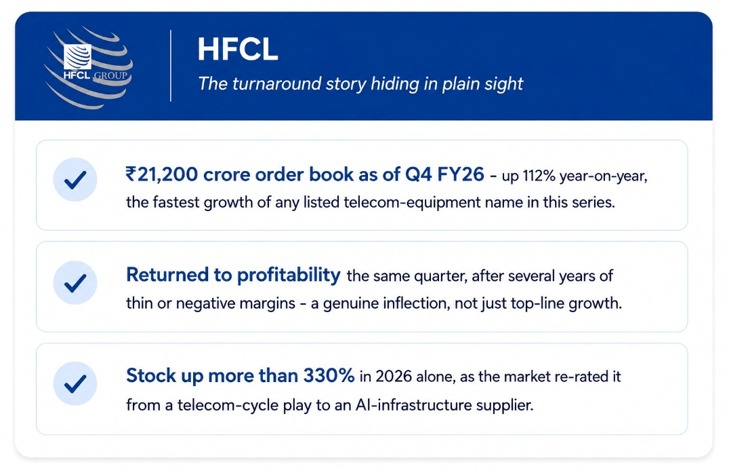
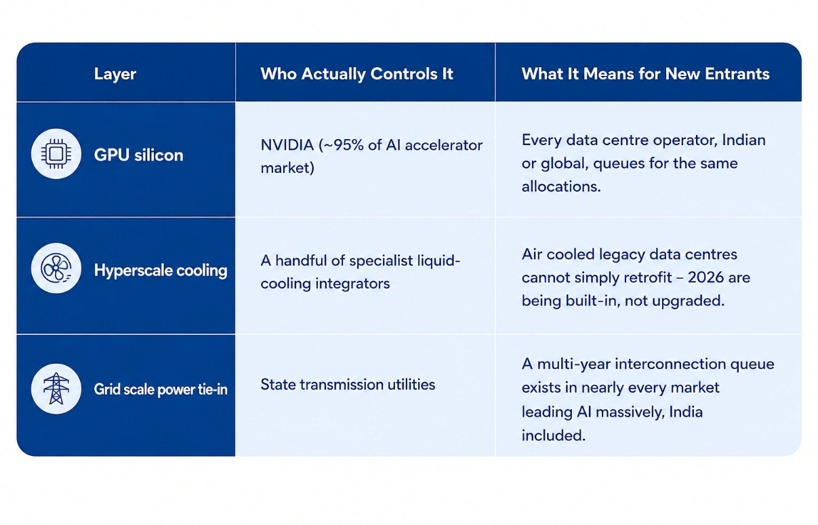
None of these matters if the underlying chips are scarce – and they are. NVIDIA’s own data-centre GPU shipments are booked out more than a year in advance globally; the constraint on India’s AI build-out isn’t capital, it’s allocation.
90% of India’s data centre capacity still sits in four metro clusters – Bengaluru, Chennai, Delhi NCR, Mumbai. Hyderabad and Pune are gaining ground, and Tier-2 cities like Ahmedabad, Kochi, Jaipur, and Visakhapatnam are next in line – operational capacity there is expected to cross 100 MW by the end of 2026.
“India’s AI capability is expanding at a pace of roughly 33% year-on-year in hiring, contributing nearly a fifth of global AI-related development activity – and that talent pool is expected to more than double by 2027.” – KPMG in India, 2026
None of these scales without electricity.
Data centres are expected to consume 3-5% of India’s total grid load by 2030, and India has committed to roughly 500 GW of non-fossil power capacity by the same year.
That’s a real, credible pathway to sustainable power at scale – but a genuine execution risk if it slips.
Cooling is the quieter constraint. Indian data centres consumed an estimated 150 billion litres of water in 2025, a number projected to double by 2030.
Renewable sourcing and water strategy are becoming underwriting criteria for new projects, not afterthoughts.
Regulation is catching up too: the Digital Personal Data Protection Act’s Consent Manager registration opens in November 2026, with full compliance – breach notifications, impact assessments – mandatory from May 2027. Every enterprise processing Indian user data for AI will need to build for this deadline.
The gap between 20% of the world’s data and 3% of its data centre capacity is not a weakness to apologise for. It is the size of the market still sitting in front of every company in this chain – from the GPU cloud operators to the fibre suppliers to the cooling-systems firms nobody profiles.
The next twelve months – Vikram-scale GPU deployments, the first full year of the L&T-NVIDIA factory, and the DPDP Act’s compliance deadline – will show how much of that 10x KPMG is projecting actually lands on schedule.

Consumer Durables, Services & Consumption
Naturis Cosmetics Investment: This is How Niveshaay Backs Innovation
The Naturis Cosmetics investment sees Niveshaay back a strong R&D-led beauty brand through the Sambhav Fund, fuelling India's next wave of innovation.
At Niveshaay, we don’t just invest in companies. We invest in long-term innovation engines.
We’re delighted to announce our investment in Naturis Cosmetics through the Niveshaay Sambhav Fund.
Our investment philosophy has always centred around backing founders who obsess over building differentiated products.
Naturis stood out because of exactly that.
An exceptional R&D culture.
A strong product development mindset.
A growing portfolio of proprietary formulations.
And promoters who believe innovation is the biggest competitive advantage.
We are proud to partner with Rahul Tandon and the entire Naturis team as they continue building the innovation engine behind India’s next generation of beauty brands, and we believe the opportunity ahead is only getting bigger.
Congratulations to the entire team on this milestone – we’re excited for the journey ahead.
The best consumer brands are built on great products. Great products begin with great innovation.
This milestone has also been recognised across leading publications:

Consumer Durables, Services & Consumption
India’s Watch Market: 3Layers, 3Different Speed
From Titan's origin story to five years of export data - a data-led look at the three speeds driving India's Watch Market.
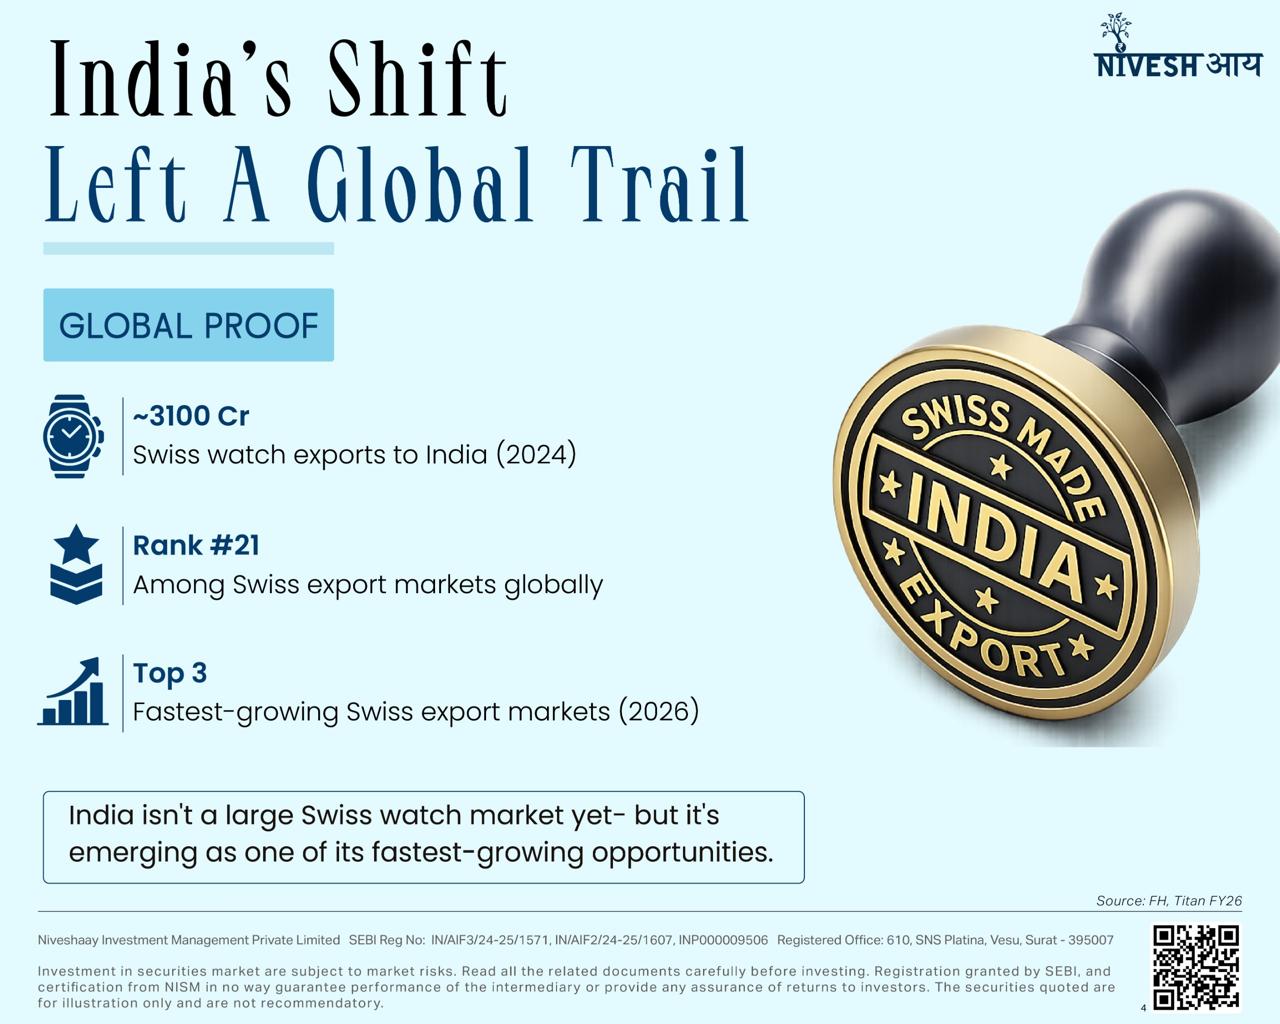
“Made in India: A Titan Story” brought India’s watchmaking journey to the big screen.
The market itself is telling another story – three segments moving at three very different speeds.
Here’s what’s changing:
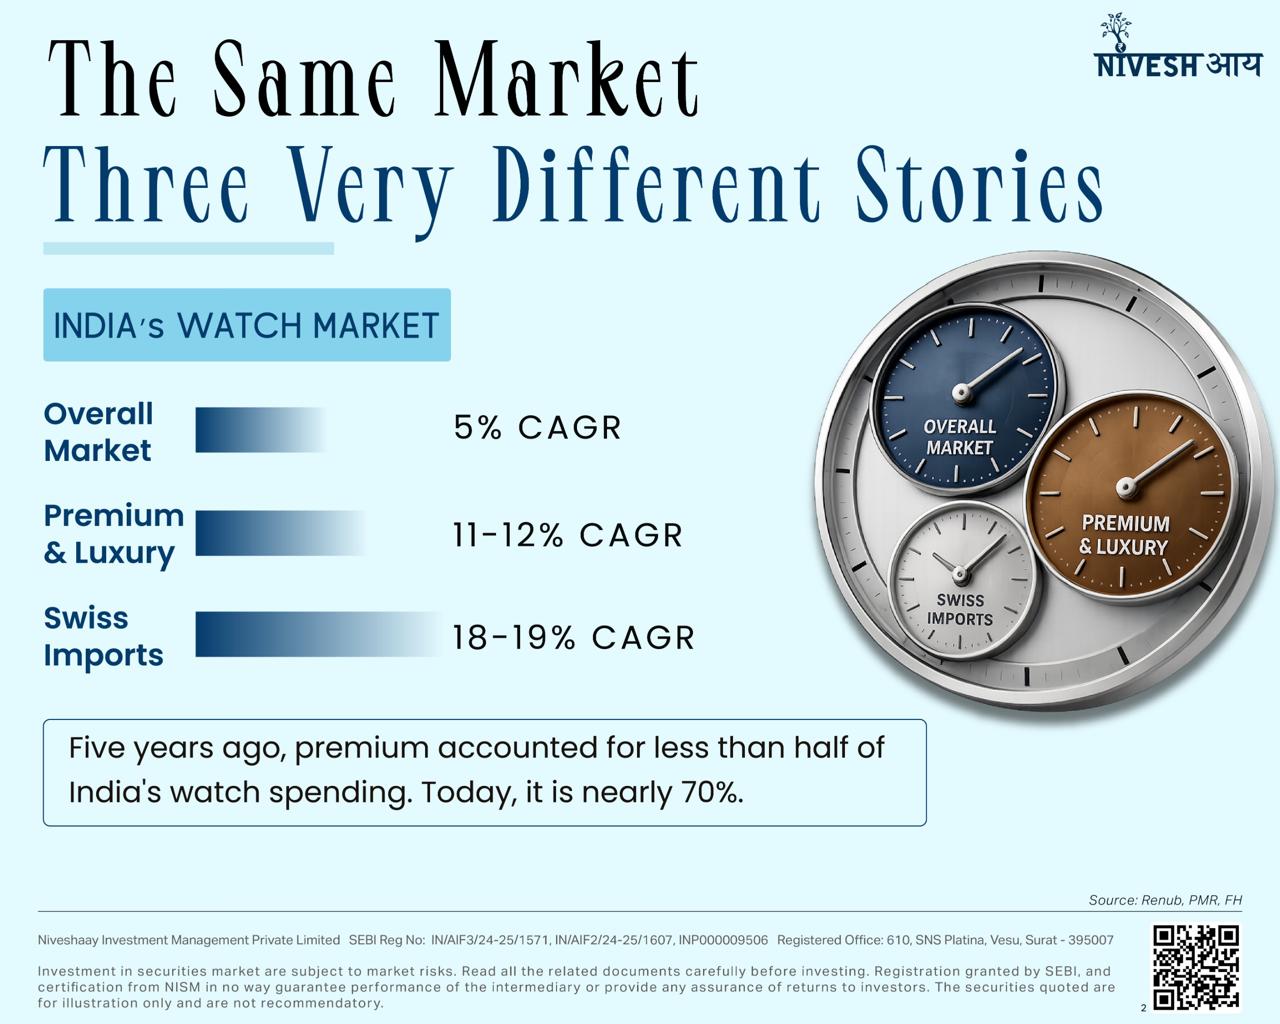
📈 Overall market: ~5% growth
💎 Premium & luxury: 11-12% growth
🇨🇭 Swiss imports: 18-19% growth
Meanwhile…
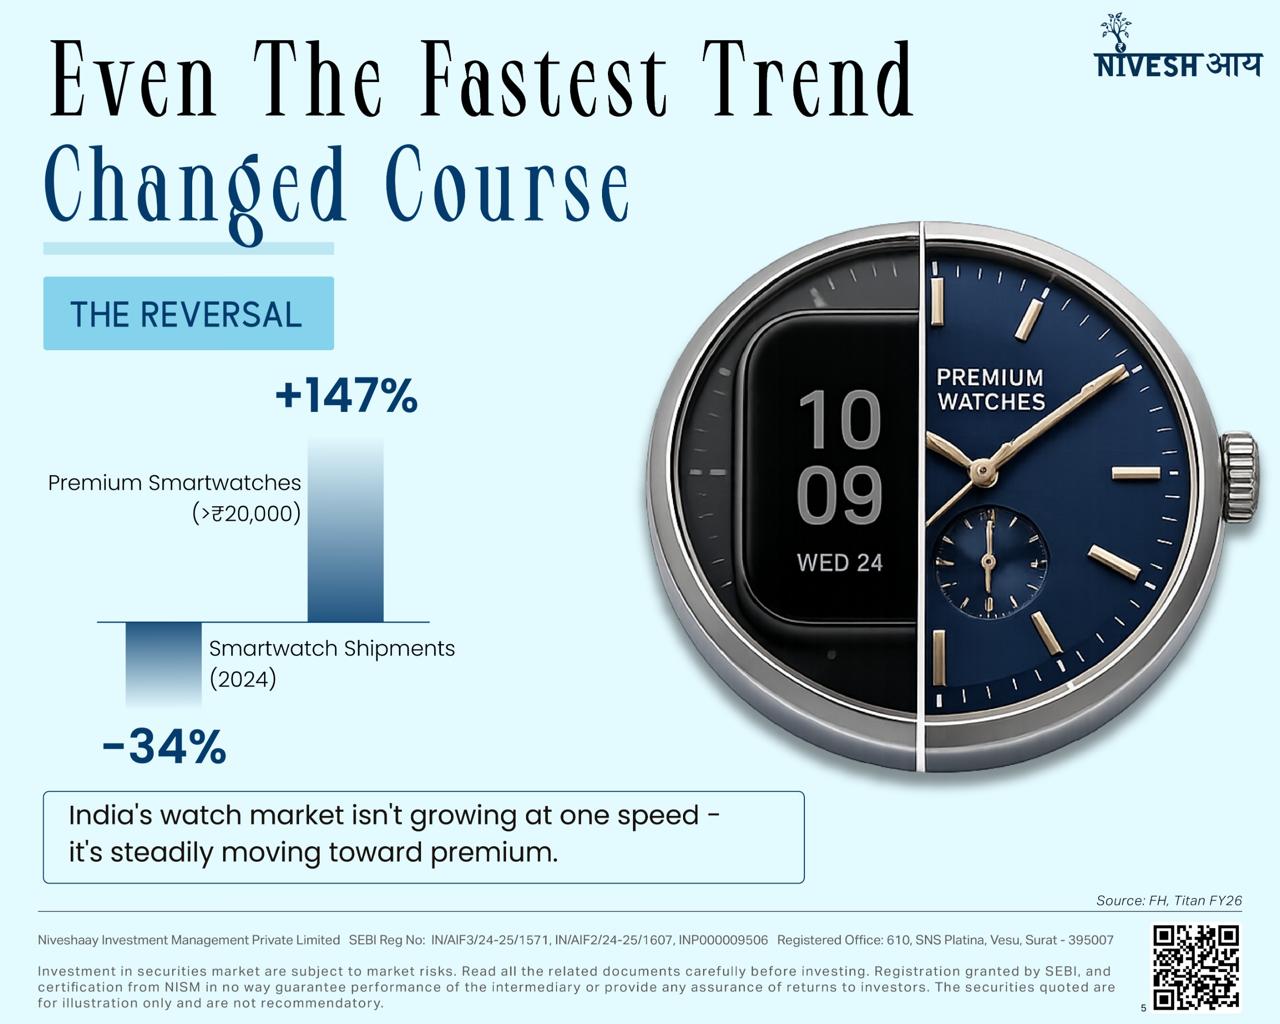
📉 Smartwatch shipments fell 34%.
📱 Premium smartwatches (₹20,000+) grew 147%.
Premium watches have gone from less than half of India’s watch spending to nearly 70% in just five years.
One market. Three very different trajectories.
👉 Swipe through to see how we’re reading India’s evolving watch industry.
💬 What surprised you more?
– The rise of Swiss imports or the Smartwatch U-turn?
Read the whole blog here : https://niveshaay.com/blog/indias-watch-market-has-three-different-clocks/

Power & Renewable Energy
SNEC 2026, On Ground Research
On-Ground Observations: SNEC 2026, Shanghai
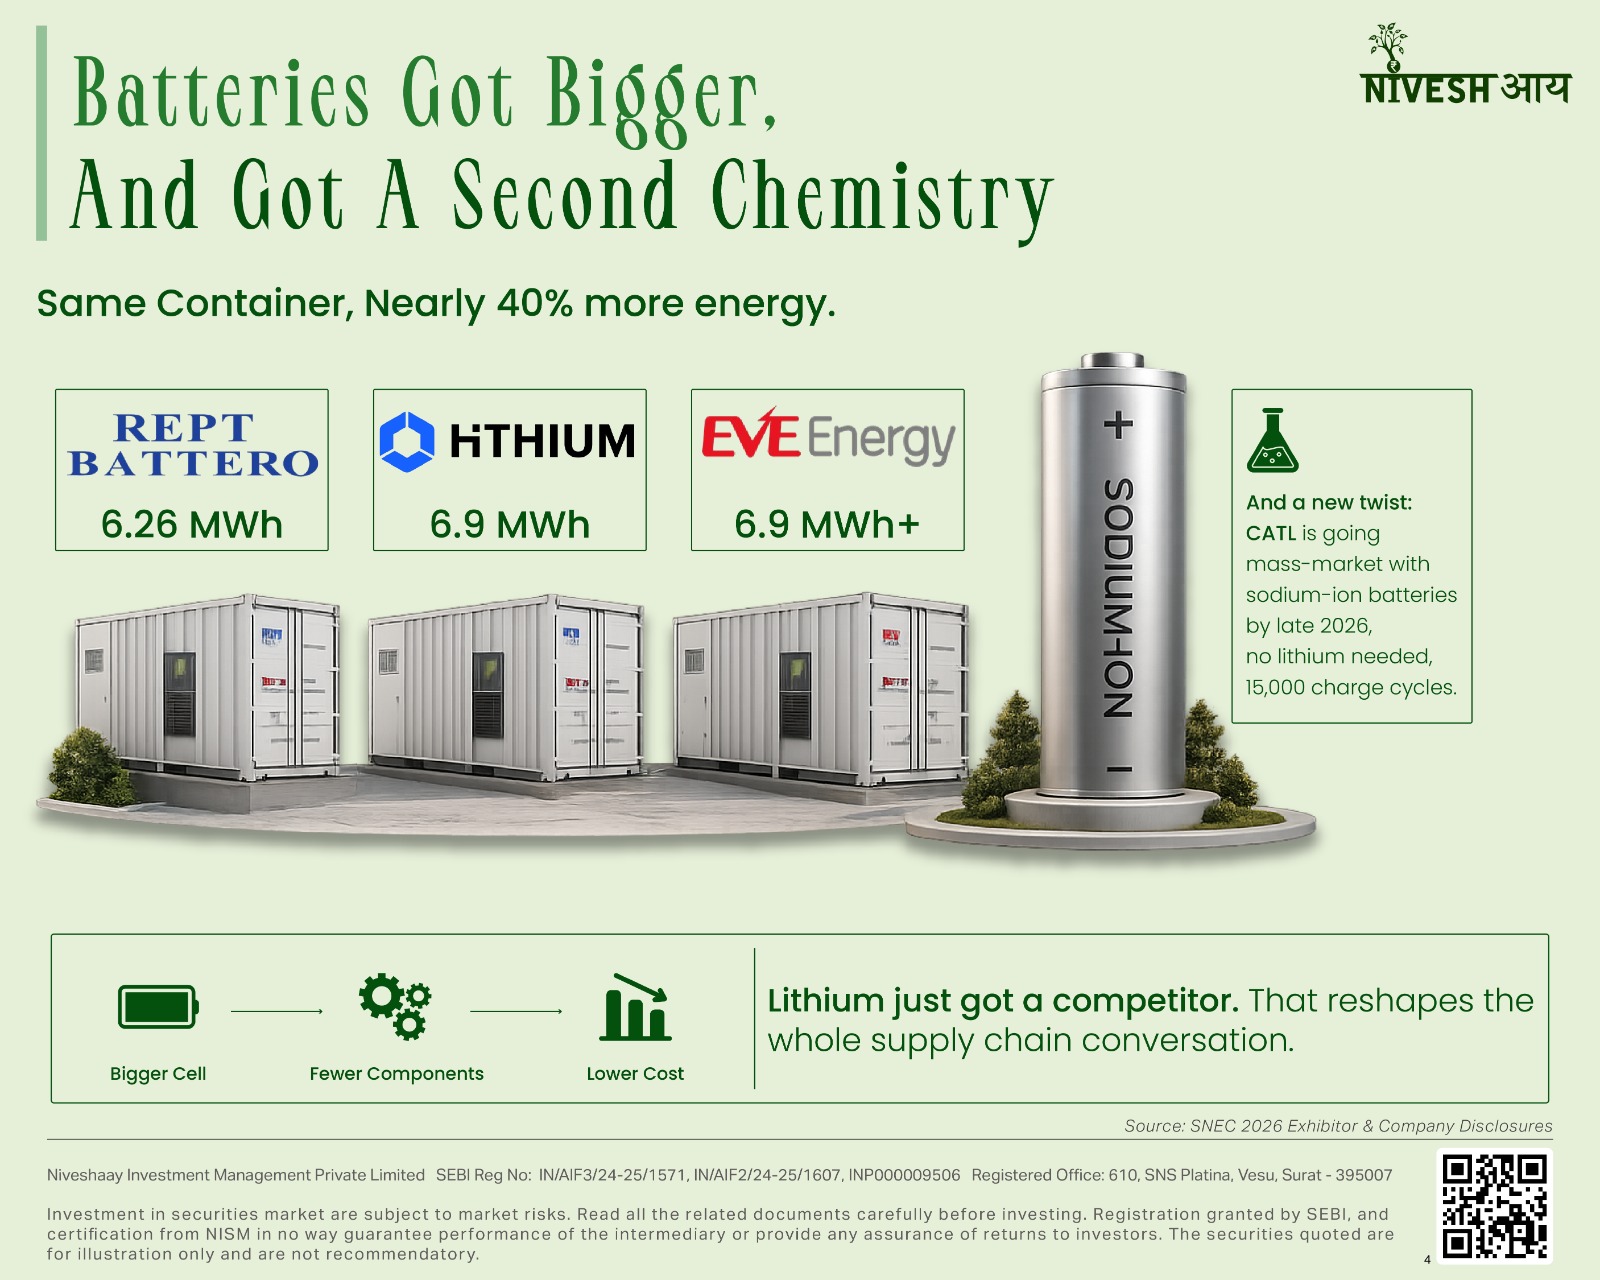
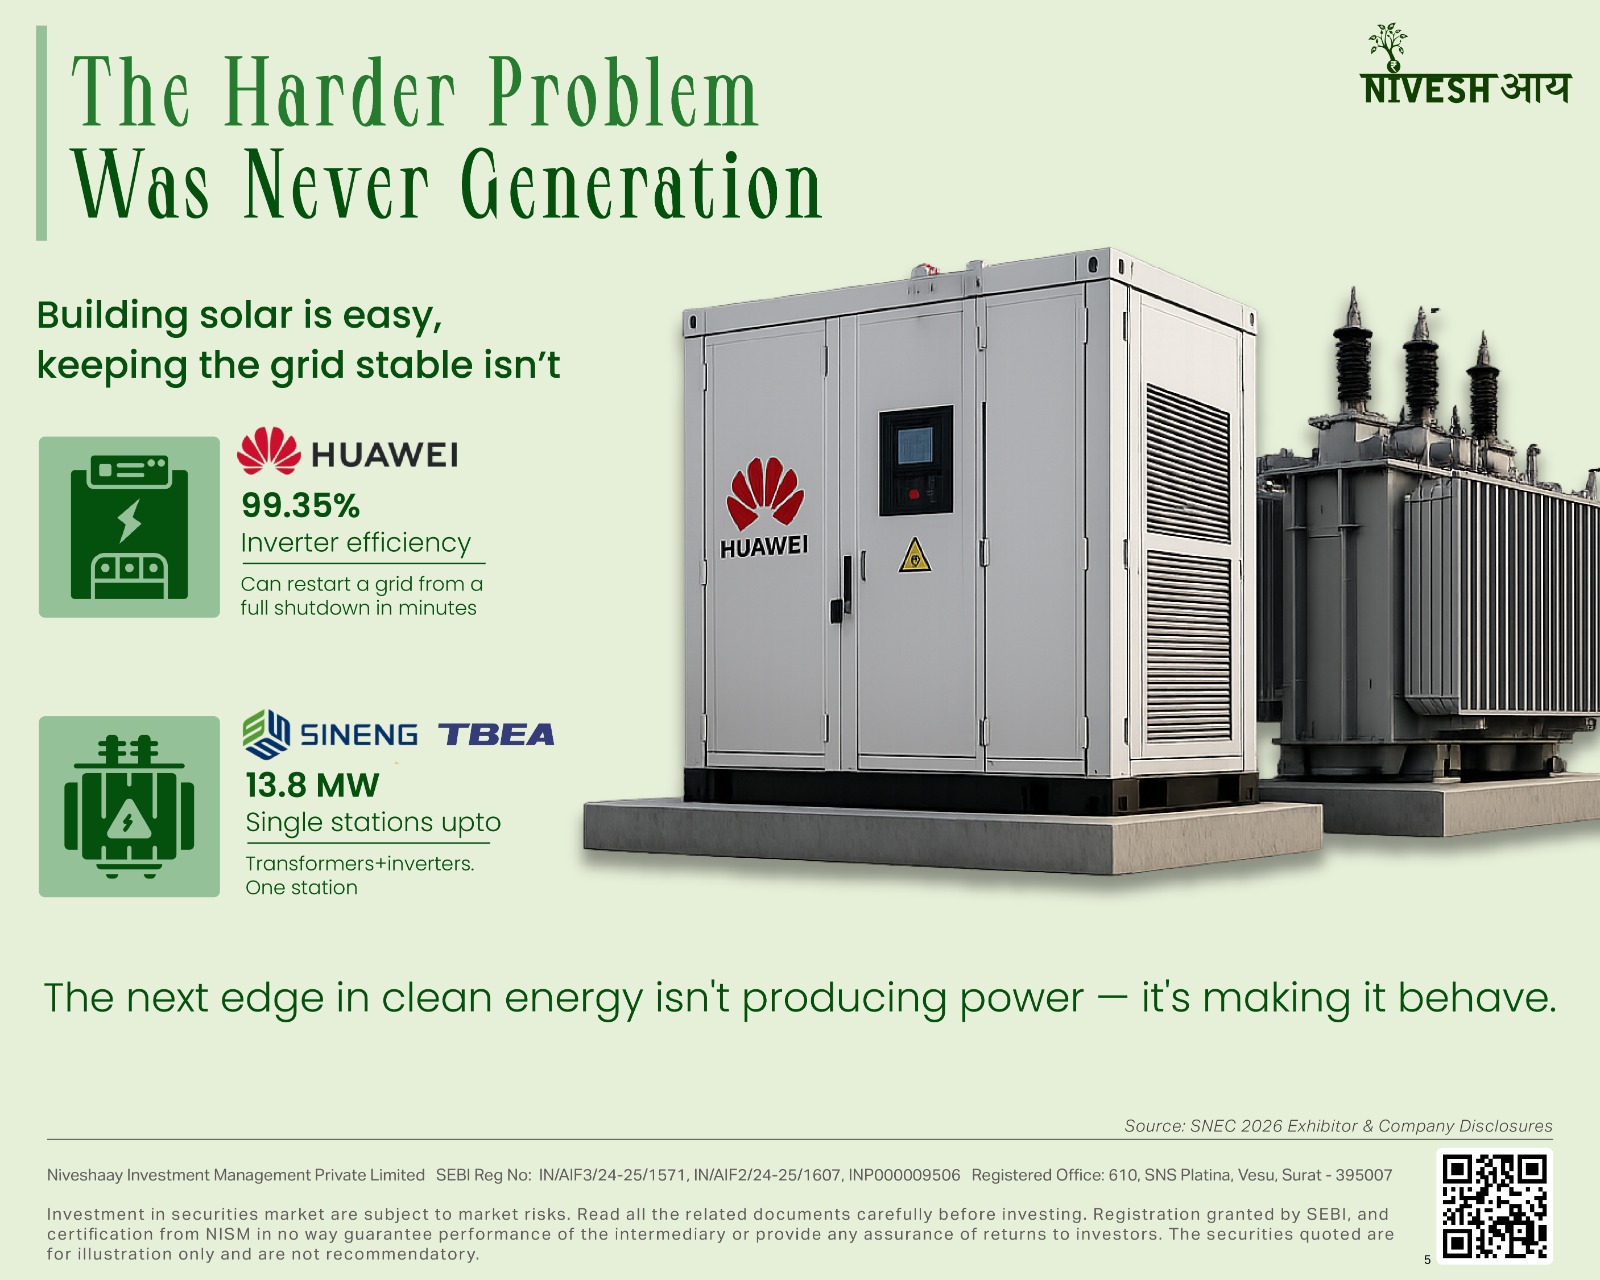


SNEC 2026, Shanghai. The world’s largest clean energy expo just told investors where the next decade of conviction is being built.
A few things stood out on the floor:
Storage grew bigger than solar – a first.
Panels got smarter, and batteries picked up a whole new chemistry.
The real edge isn’t who generates the most power anymore – it’s who can keep the grid stable.
And AI? It’s quietly become clean energy’s biggest, newest customer.
The story investors were watching has changed characters mid-season — and most of the market hasn’t noticed yet. 👀
Swipe through to see what we saw on ground →
Which shift are you watching closely – storage, sodium-ion, or AI’s energy appetite?
📍 On Ground Research | Niveshaay
Read all details here : https://niveshaay.com/blog/on-ground-observations-snec-2026-shanghai/

Consumer Durables, Services & Consumption
India’s Watch Market Has Three Different Clocks
From Titan's origin story to five years of export data - a data-led look at the three speeds driving India's Watch Market.

The sequel to Titan’s origin story isn’t streaming anywhere. It’s sitting in five years of export data
Bombay, 1978. The Indian watch market runs almost entirely on smuggled Swiss pieces, a state-run watchmaker no one trusts, and a Tata Group executive named Xerxes Desai who’s just been handed a near-impossible brief.
Build a watch India can be proud of, from a country nobody believes can build one. That’s the opening act of Amazon MX Player’s Made in India: A Titan Story, and it’s worth the six episodes.
But every origin story runs out of episodes. This one’s sequel never aired on TV.
It’s been playing out quietly instead – in Swiss customs filings, company reports, and shipment data from the last five years.
And it’s a stranger story than the one on screen. Not one industry, but three – each moving at its own pace.
That’s the story this piece actually tells. Not through one growth number – through three.
Ask five analysts how fast India’s watch market is growing and you’ll get answers anywhere between 5% and 19%.
Nobody’s lying – they’re each looking at a different layer of the same market, and each layer moves at a genuinely different speed:
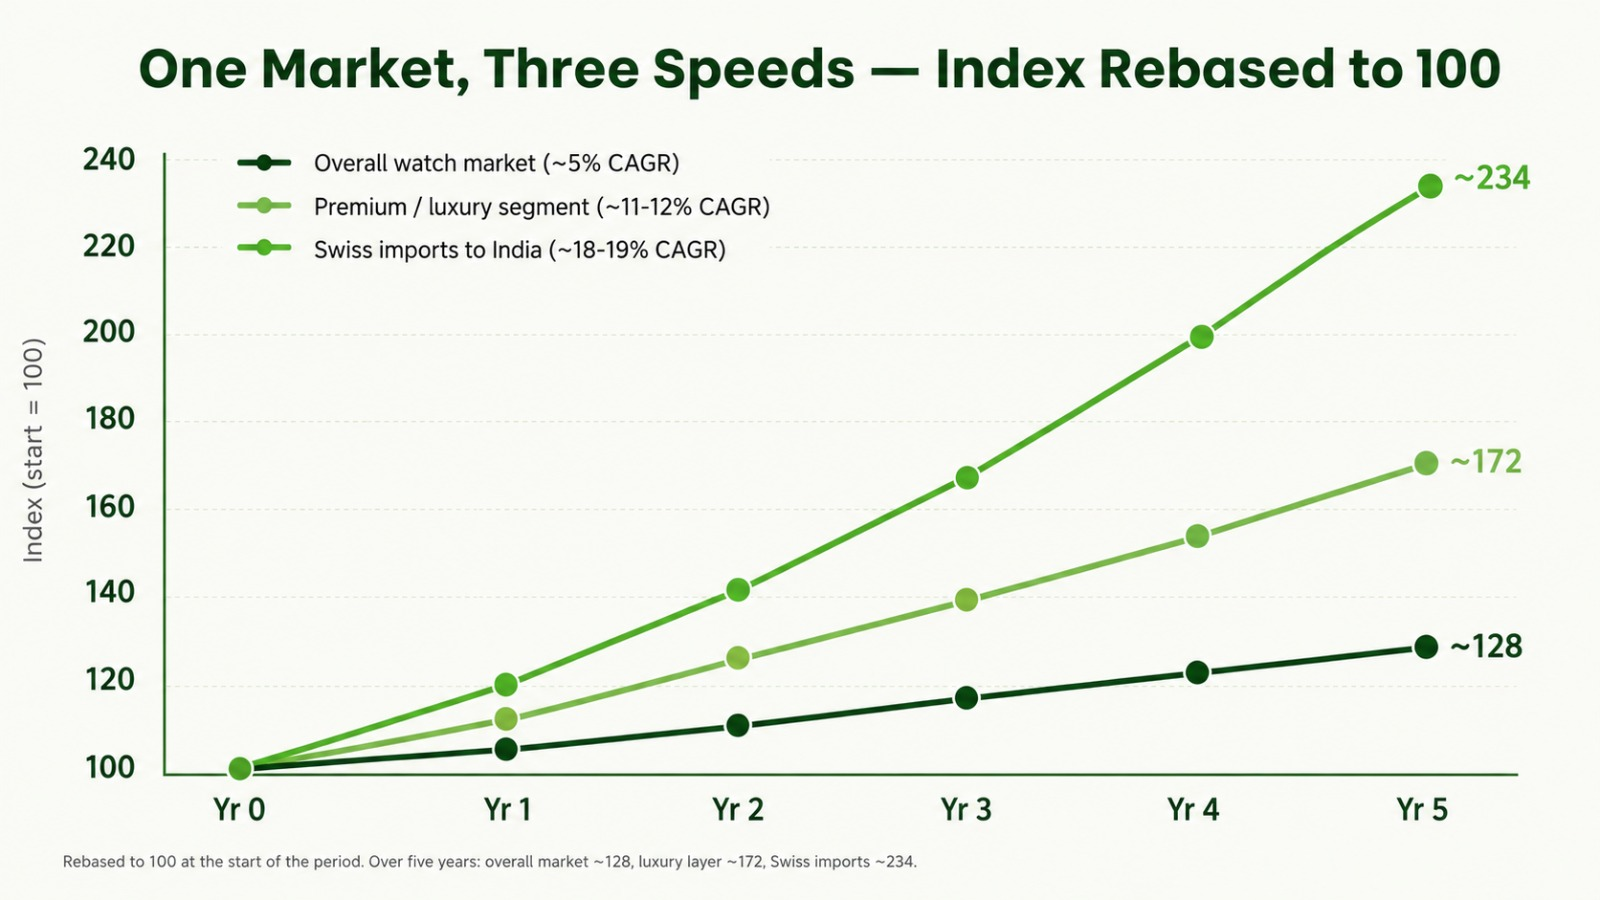
Growth rates alone can be misleading. The clearer proof is in how the market’s own composition has shifted.
Five years ago, premium and luxury watches made up less than half of what Indians spent on watches. They don’t anymore.
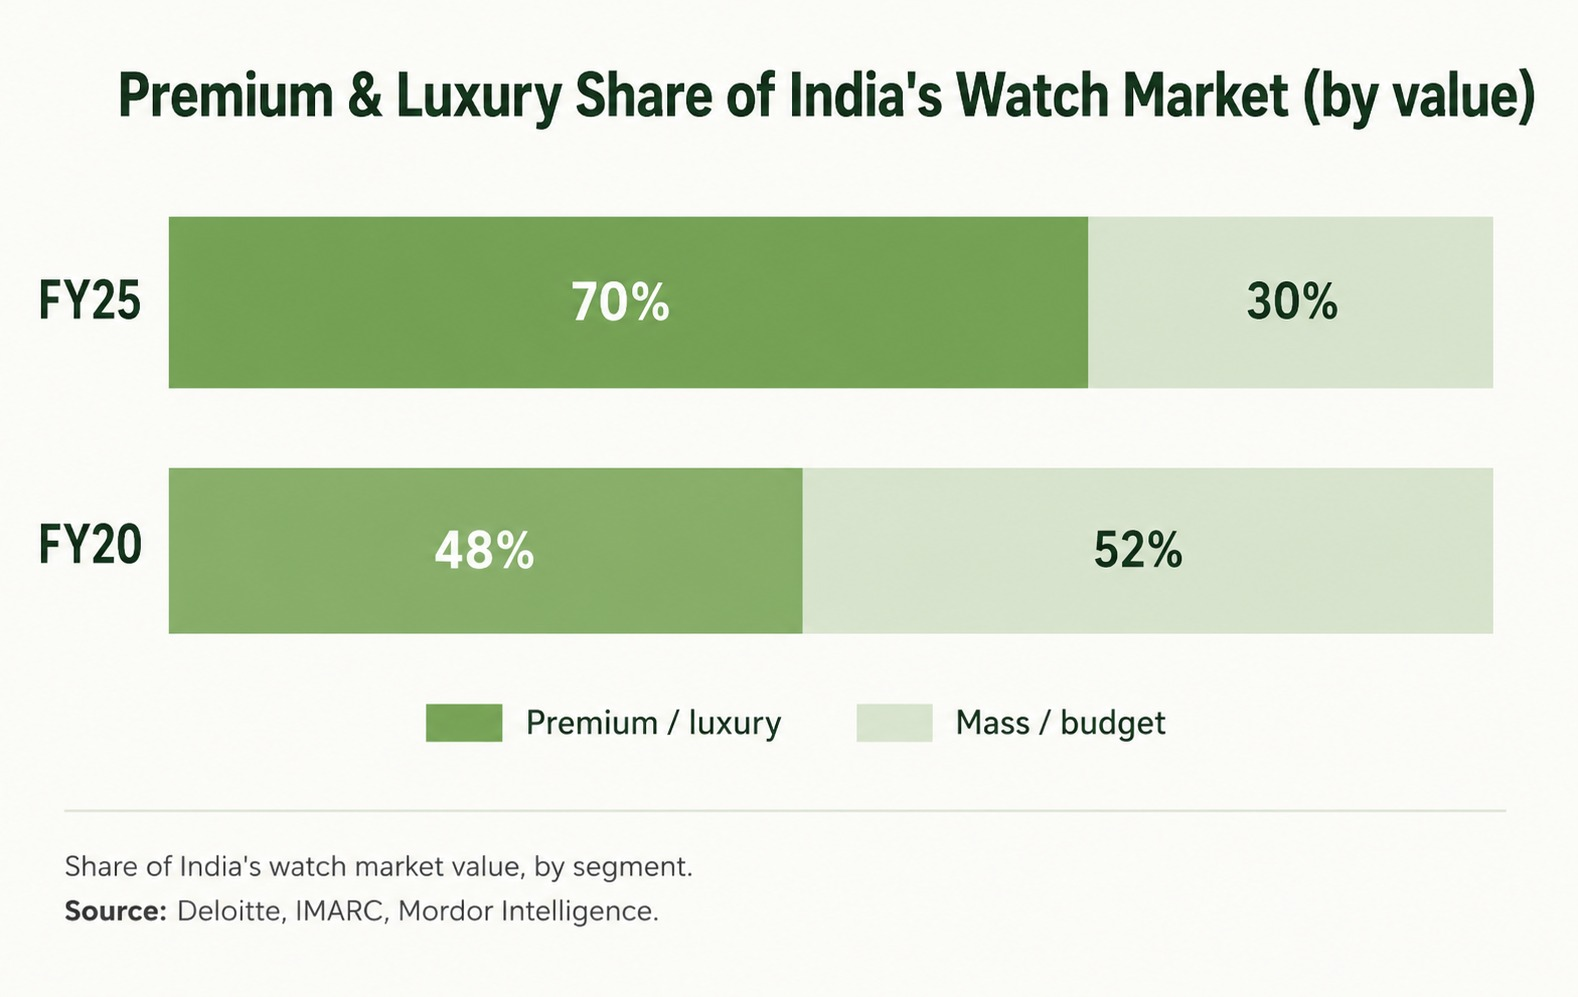
A single “market growth rate” hides more than it reveals here – it averages three markets that barely resemble each other in speed.
This is also, quietly, why two earlier drafts of this same research disagreed with each other – one citing ~10.2% (a wristwatch-specific series), the other ~5% (a broader market series). Neither was wrong. They were just standing on different floors of the same building.
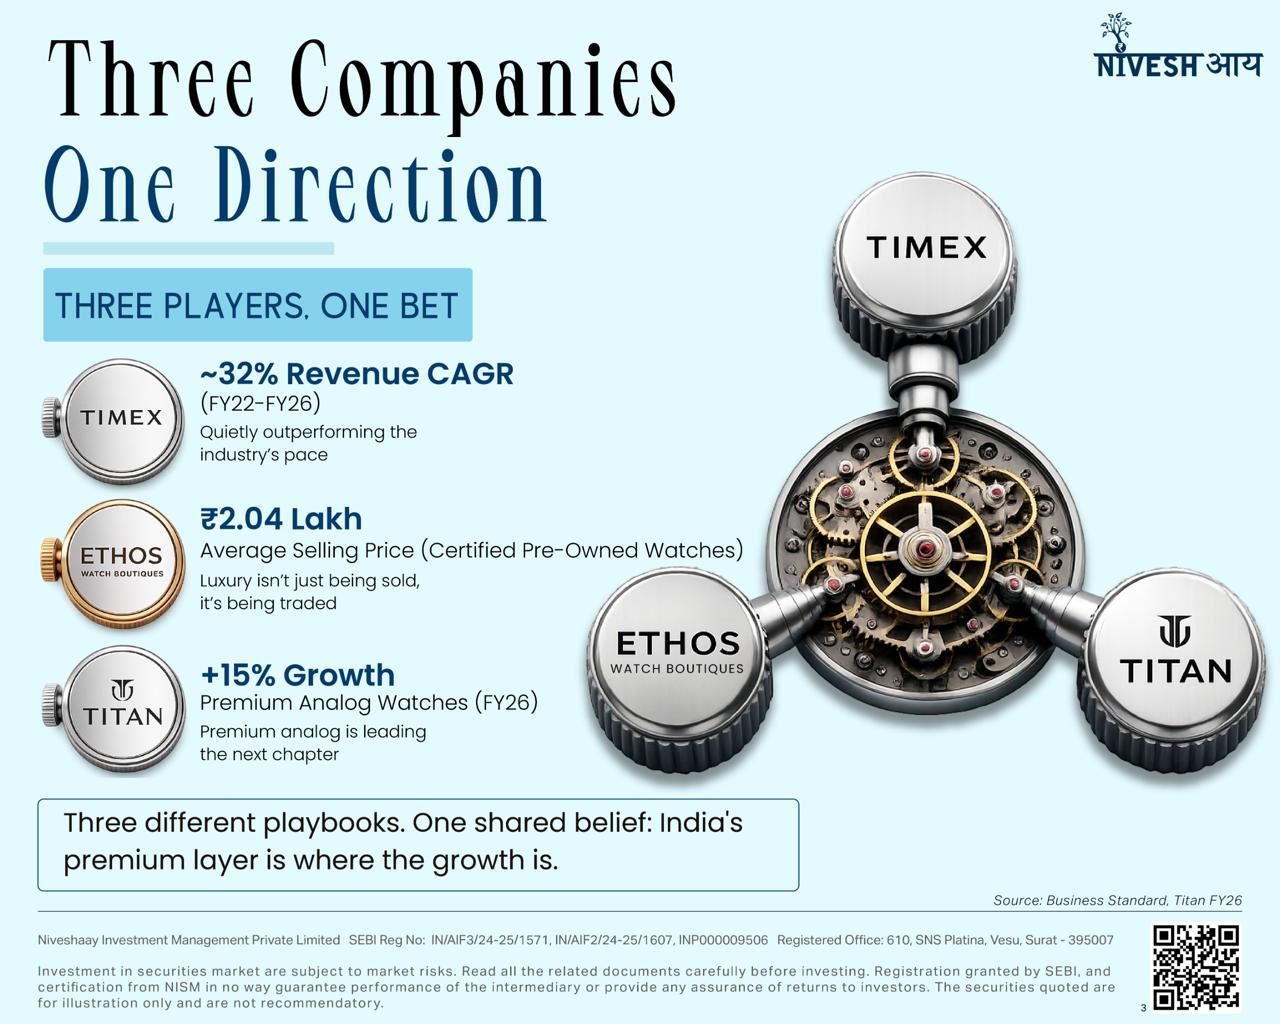
If the premium layer is where the real growth is hiding, three listed companies are the closest thing to a scoreboard for who’s actually capturing it.
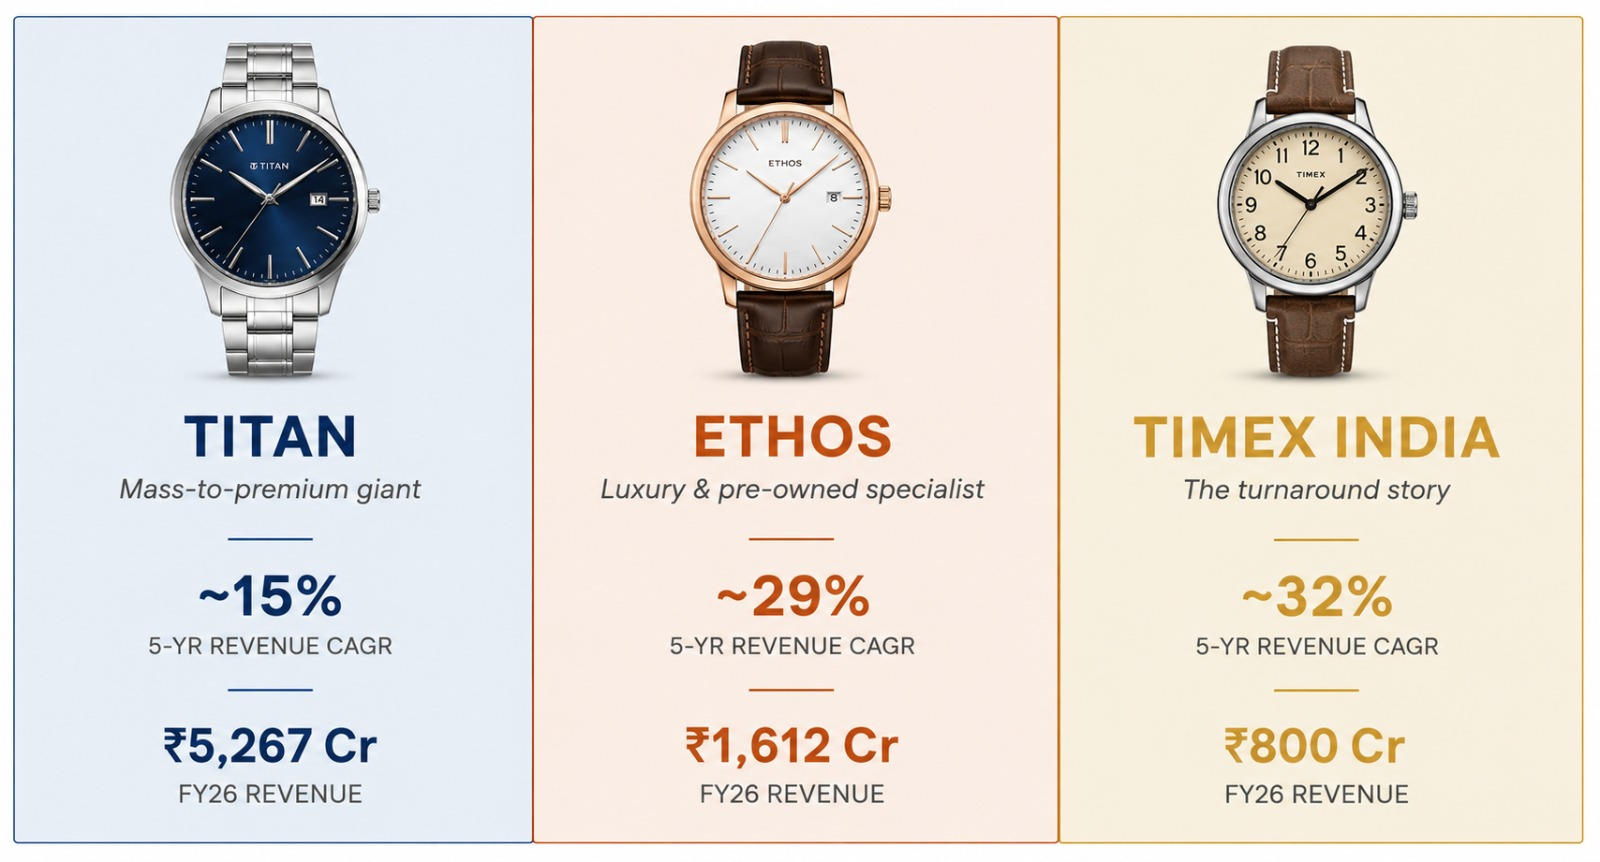
Timex – the quiet turnaround
Ethos – betting on luxury and the second-hand market
Titan – the giant, recalibrating in real time
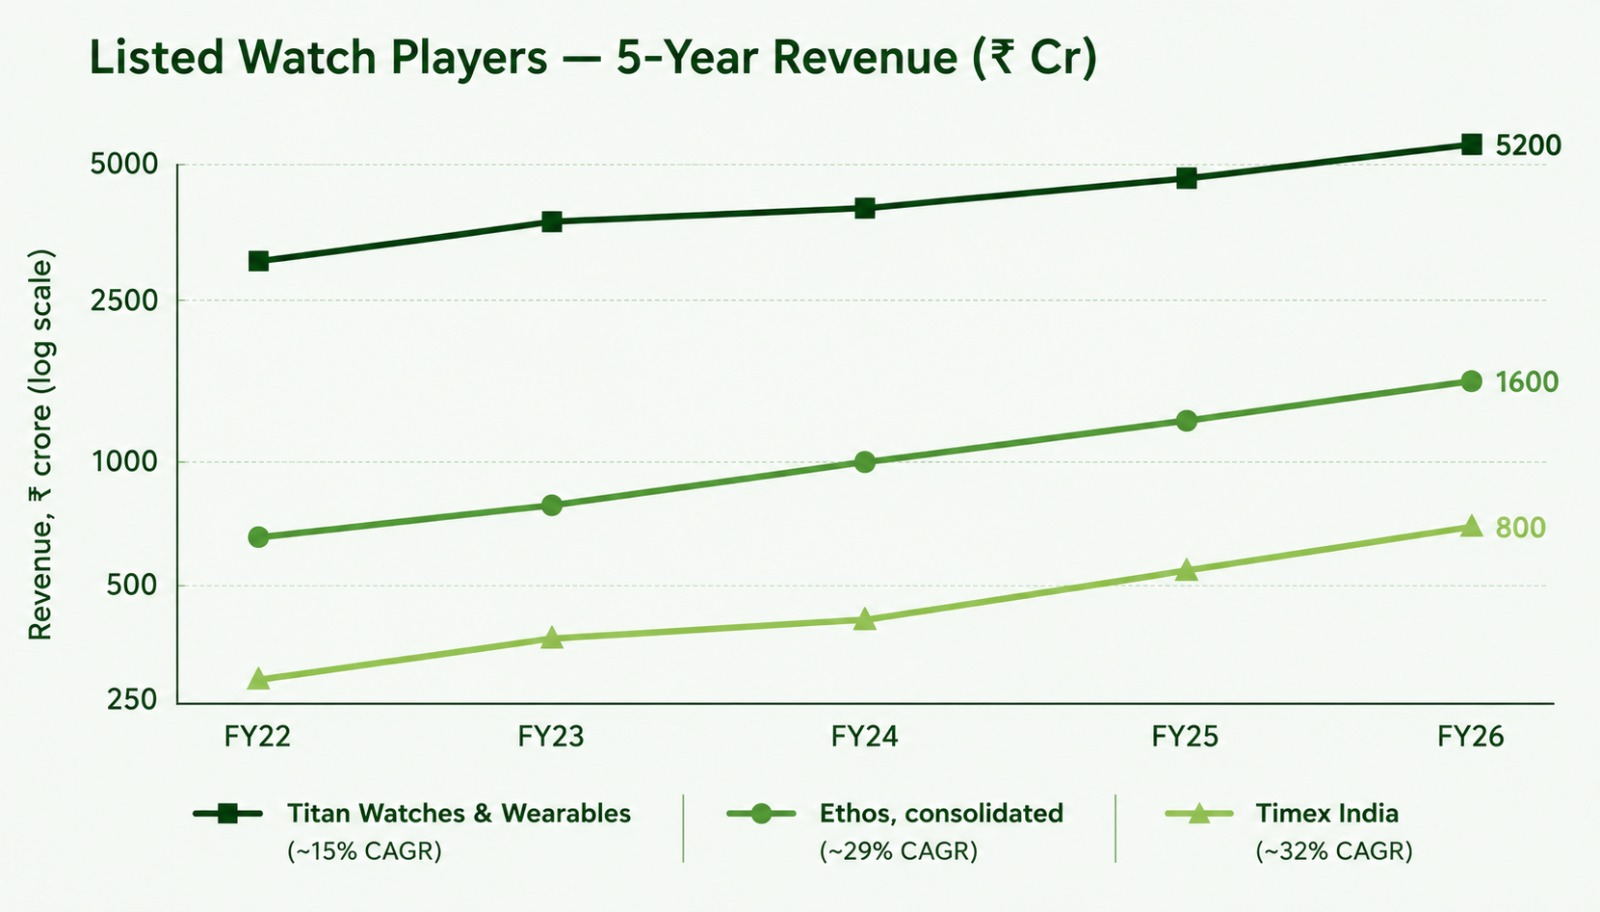
Ethos and Timex outgrow the headline market because they capture organised, premium share within it – not because the market itself accelerated.
That’s the view from inside India. The clearest outside confirmation comes from Switzerland’s own trade data.
Switzerland keeps meticulous books on where its watches go, which makes Swiss export data the easiest of the three layers to fact-check.
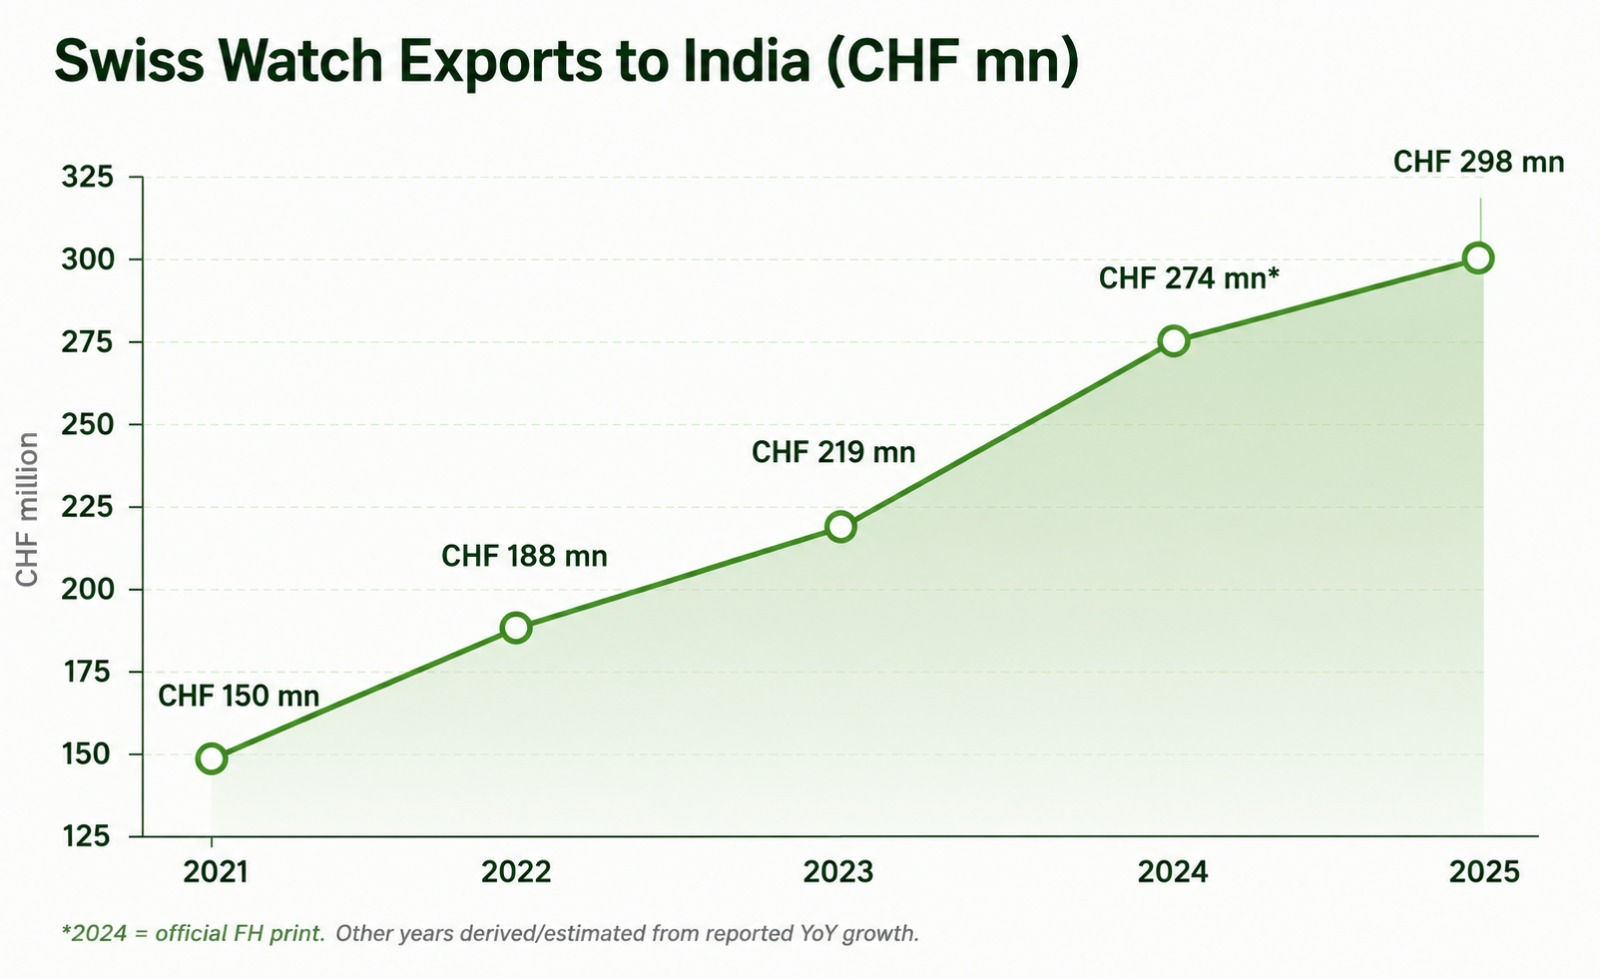
The Federation of the Swiss Watch Industry confirmed CHF 274 million of exports to India in 2024.
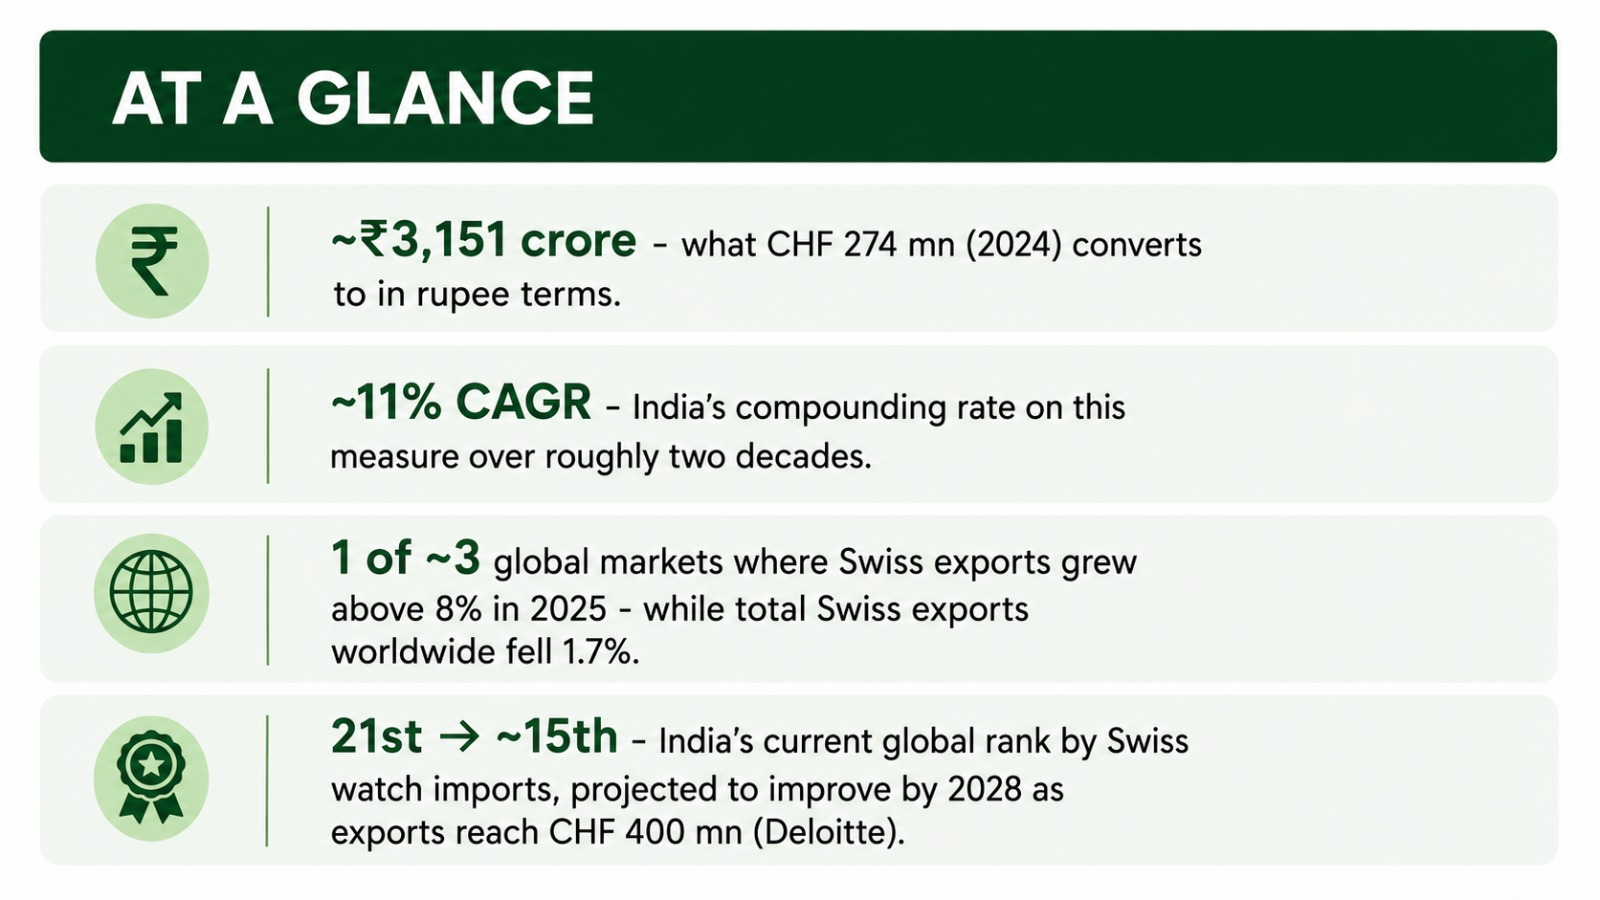
India is still a minor character on the world stage – 21st, by this measure. But it’s one of a small handful of markets still growing while the rest of the world’s Swiss watch trade shrank. Being early to a trend and being unimportant to it are two very different things, and the data says India is the former.
Long before quarterly results confirmed any of this, the infrastructure had already started moving. A sample of what’s on record:
Perhaps the best line on all this came from a veteran retailer, quoted via Europa Star, who put the required temperament simply:
“India is not a market for short-term thinkers.”
Fittingly, that’s also the whole moral of Xerxes Desai’s watch.
Every good story needs a reversal, and this one arrived in the segment everyone thought was the future: smartwatches.
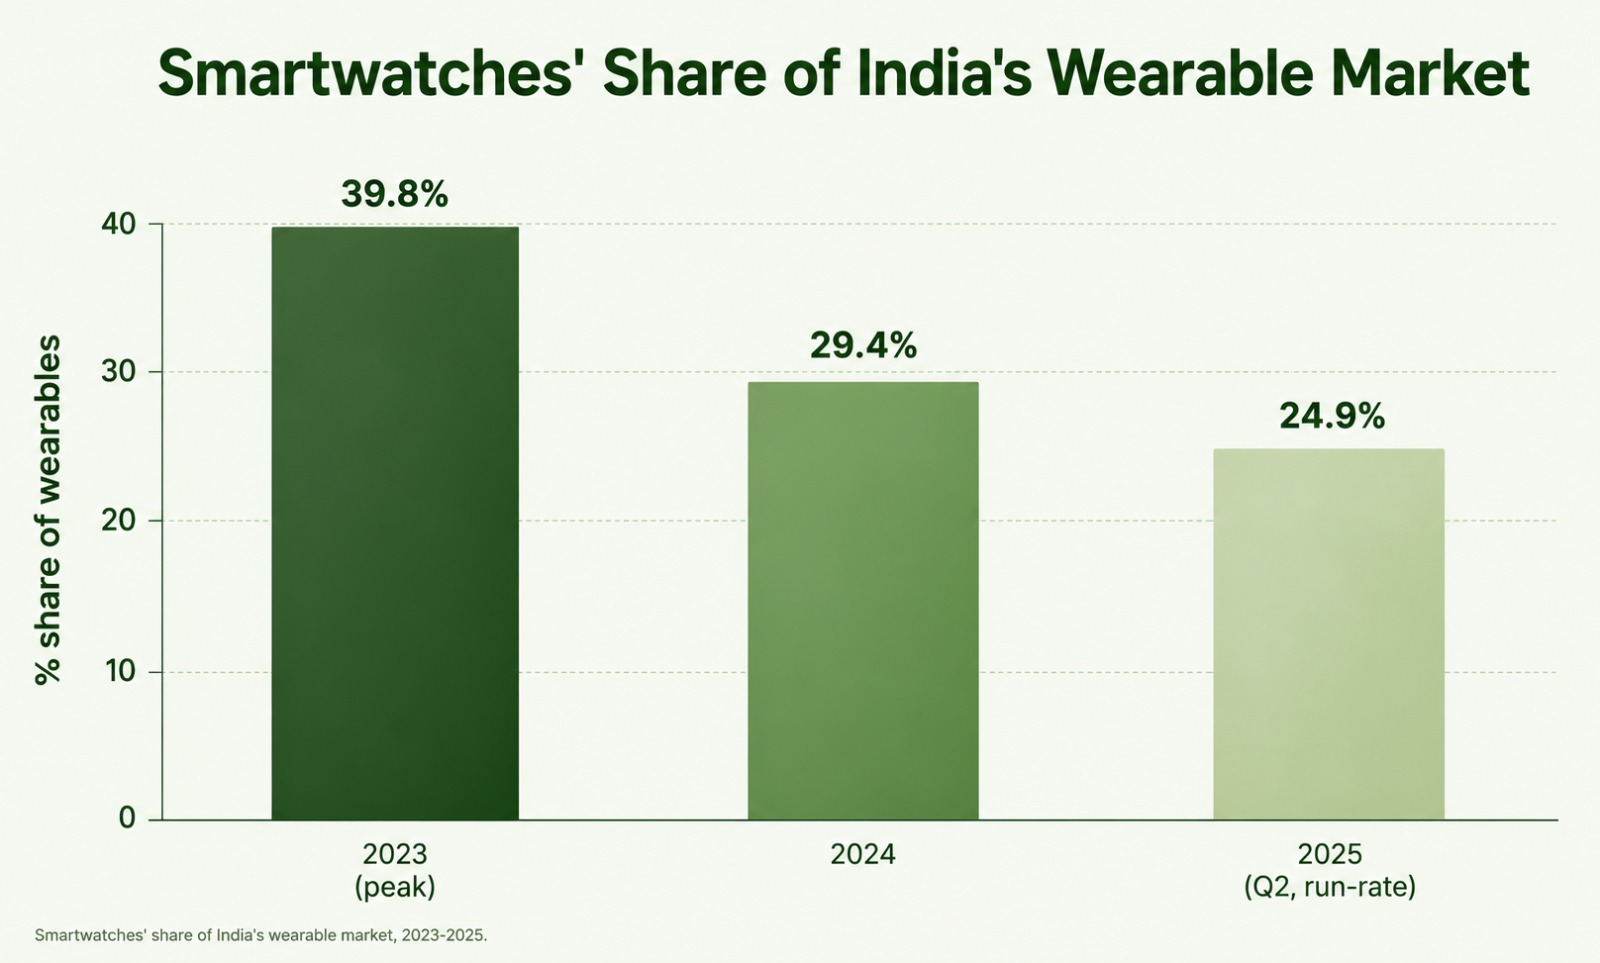
Titan’s own numbers make the trade-off almost too neat: analog watches grew 15% in FY26 at a 16.2% EBIT margin, while its wearables business fell roughly 50%.
Budget-digital fatigue and an analog-plus-premium comeback turned out to be the same story, told twice.
The MX Player version of this story wraps up with Titan finally shipping a watch India could be proud of.
The data’s version doesn’t have a finale – it’s still airing, three episodes a year, at three very different speeds:
None of this is a stock recommendation, and five years of data is not a script for the next five.
It’s simply a reminder that the number worth remembering depends on which layer of the market you’re asking about – and that conflating them is how two honest analysts end up quoting two very different growth rates for the same industry.
Space Ecosystem
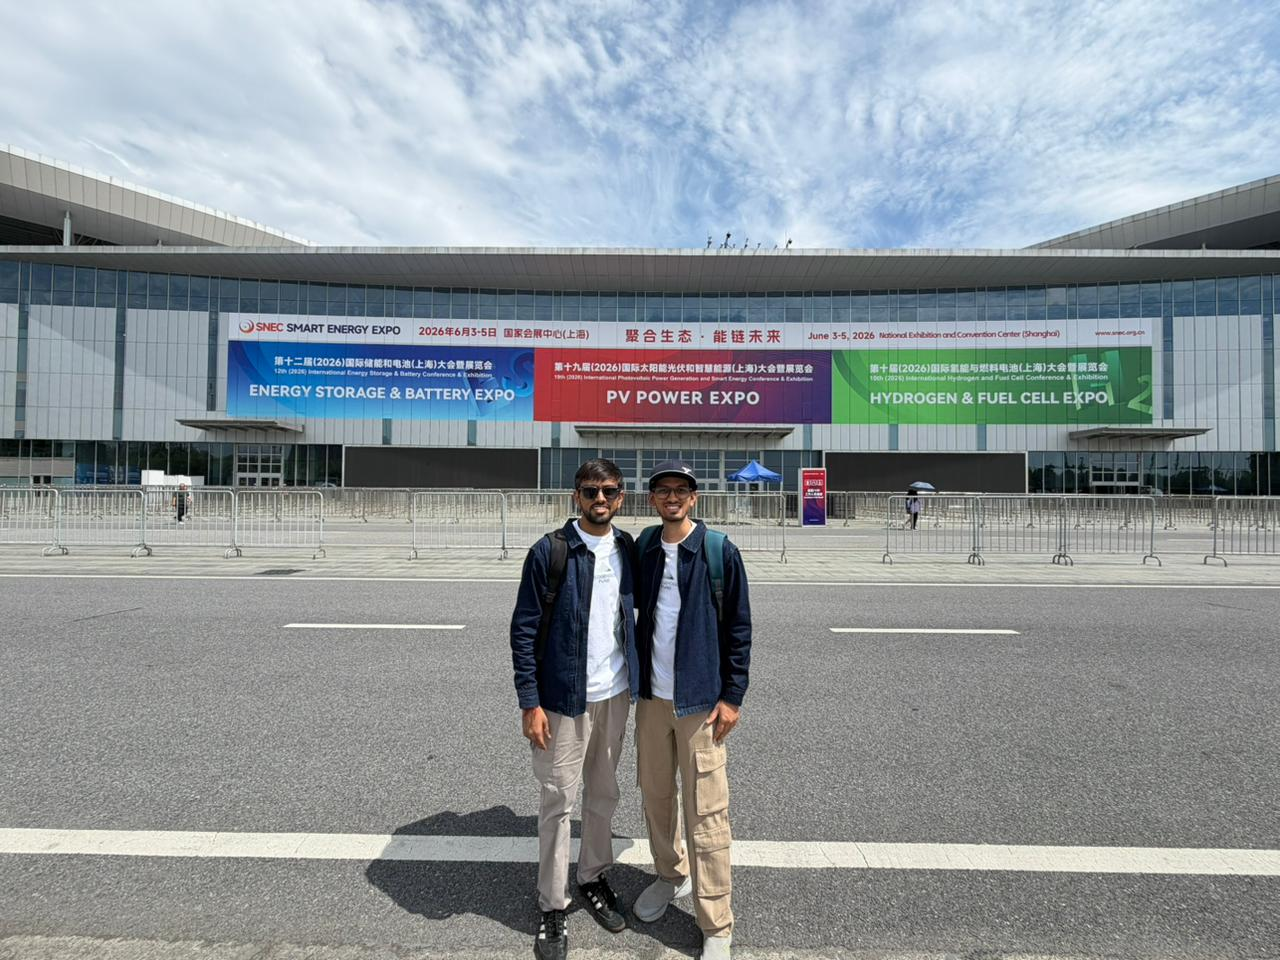
Our Research Team On-Ground Observations: SNEC 2026, Shanghai
On-Ground Observations: SNEC 2026, Shanghai - Team Niveshaay
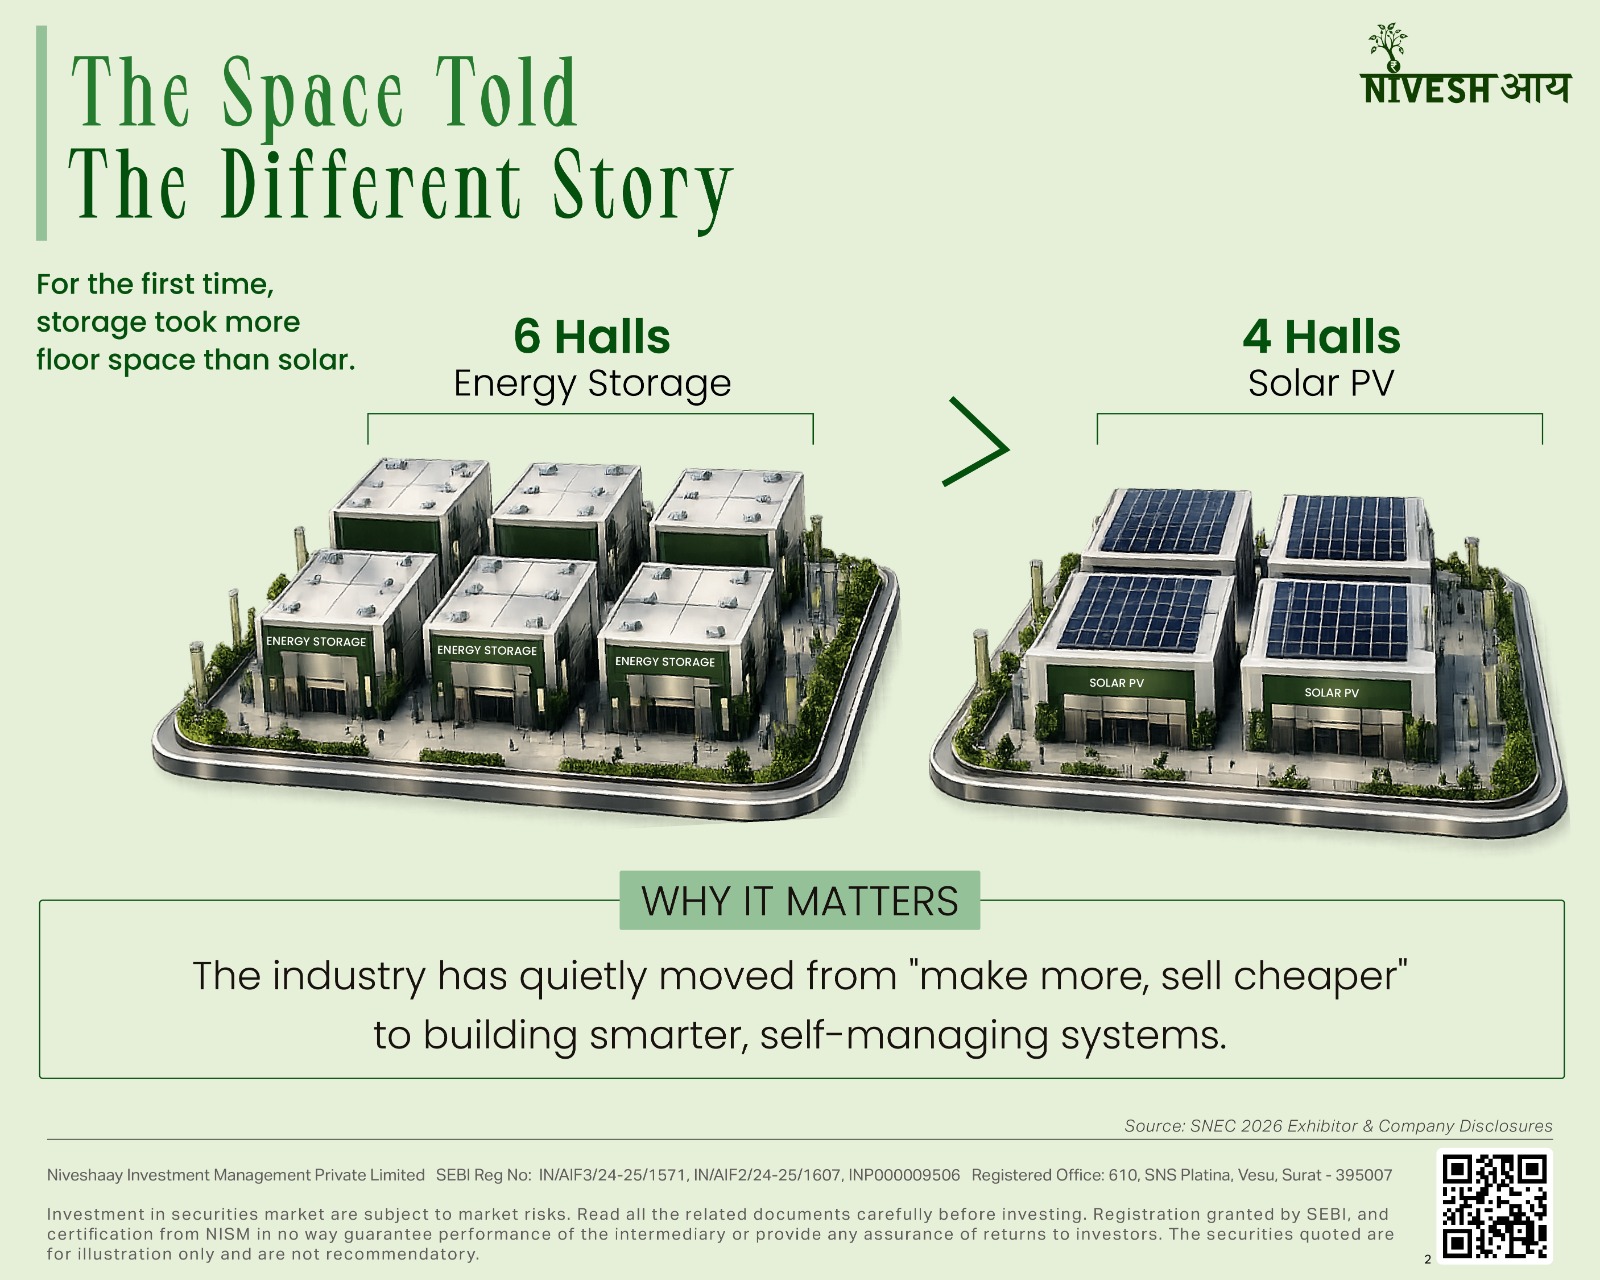
The 19th SNEC PV Power & Smart Energy Expo in Shanghai marked a turning point for clean energy. Our research team walked the floor in person, and the biggest shift wasn’t in any single product – it was spatial. For the first time, energy storage took up more space than solar itself: six exhibition halls, against four for solar panels.
The industry is moving away from a “make more, sell cheaper” model and toward smarter systems – AI-based power management, denser hardware, and grids that can stabilise themselves. Several exhibitors also pointed to home battery storage as the next big growth area, since every new rooftop solar system increasingly needs a battery alongside it.
Here’s what stood out, category by category.
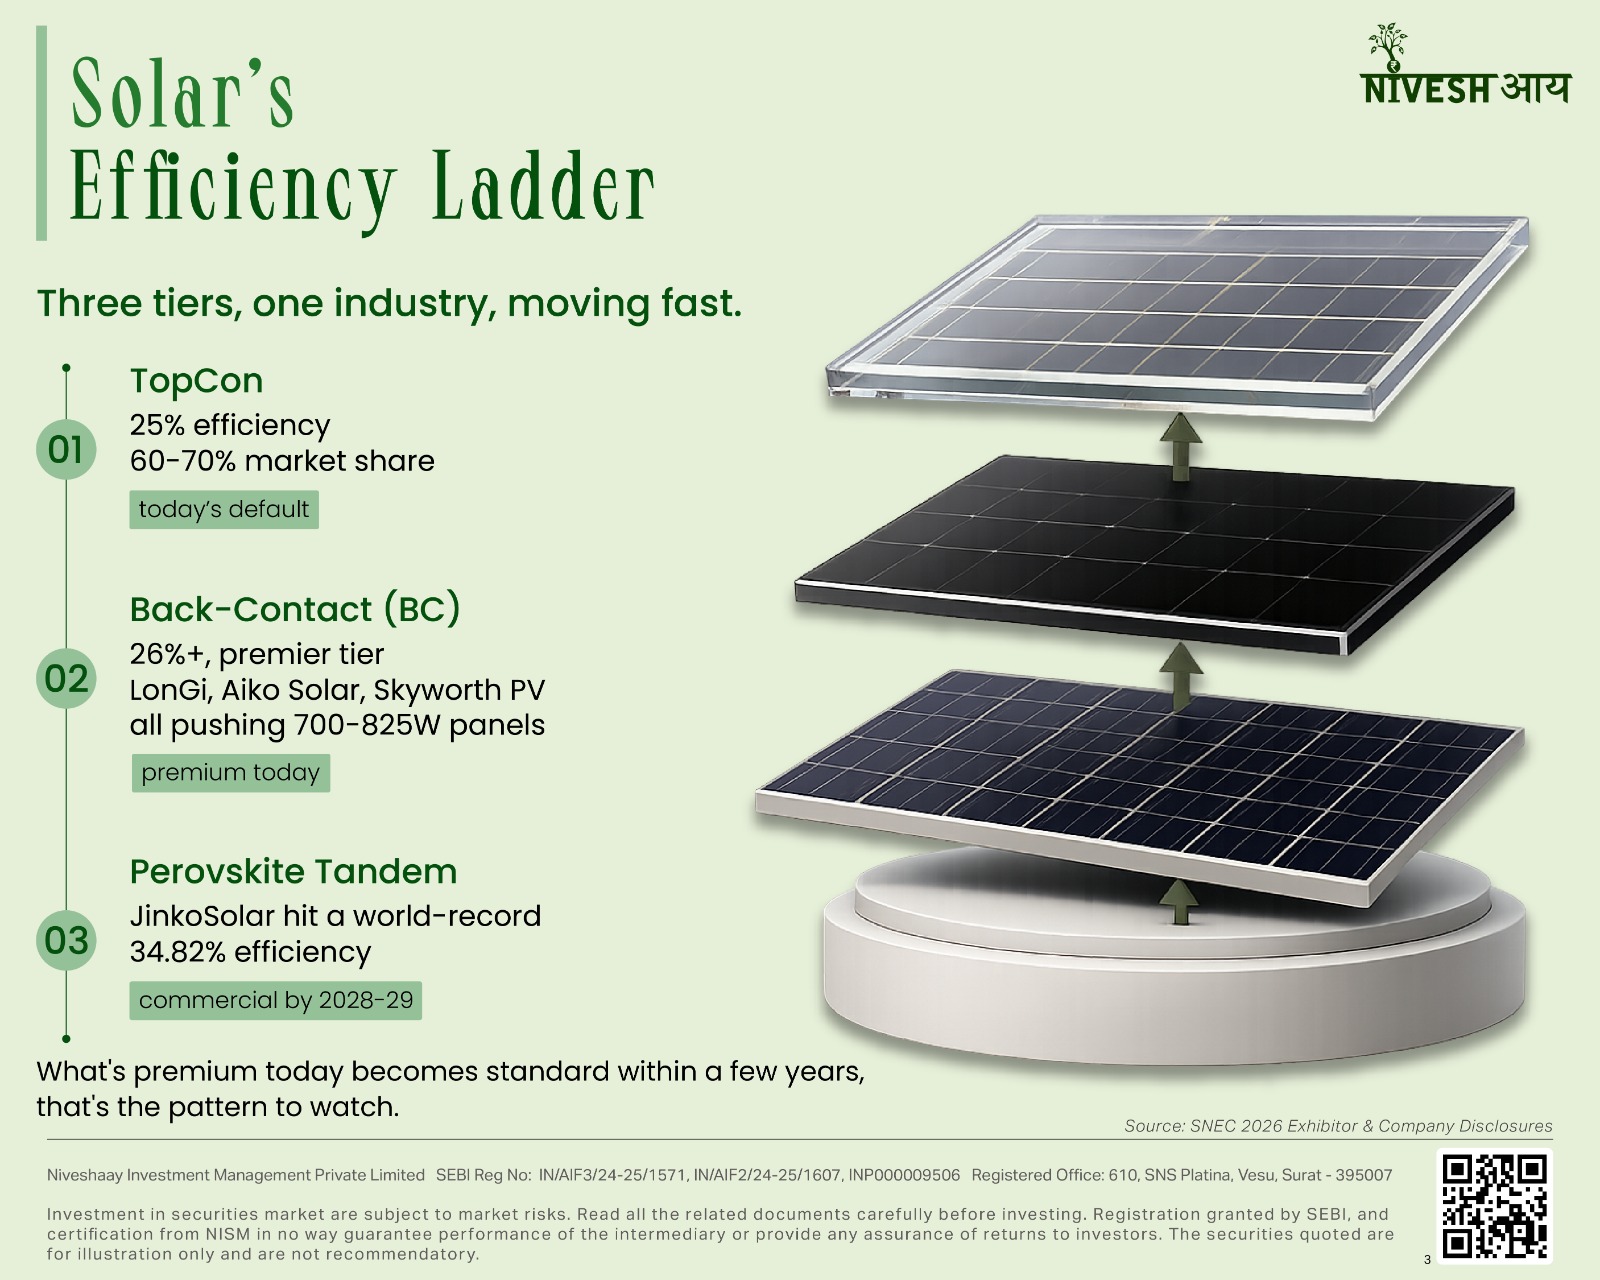
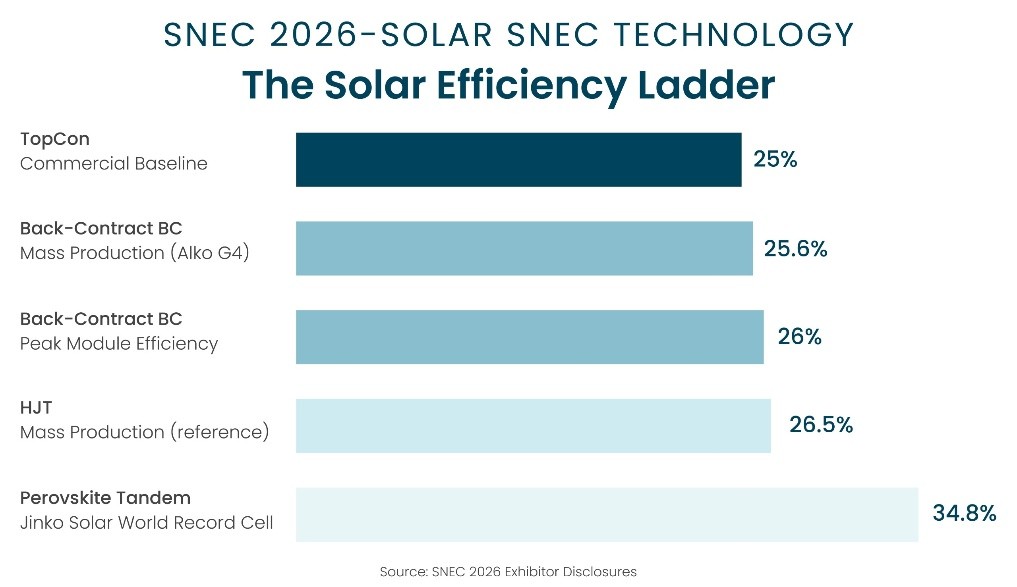
Most solar panels sold today use a technology called TOPCon, which now makes up 60-70% of the market at around 25% efficiency. It’s reliable and affordable, which is why it dominates.
Back-Contact (BC): The premium tier
Above TOPCon, a premium technology called Back-Contact (BC) is growing fast, global shipments are on track to reach 100 GW by the end of 2026. A few examples from the floor:
BC panels also handle heat and shade better in the real world. All the wiring sits on the back of the panel instead of the front, so there’s no shadow loss, and the cells run cooler under direct sun, which means less power lost to heat over a day.
Perovskite tandem cells: The next horizon
A newer technology called perovskite tandem cells is closing in fast on record efficiency. JinkoSolar’s cell hit a world-record 34.82% efficiency. Trina Solar showed a large tandem module delivering 865W, independently certified by TÜV SÜD, and GCL Perovskite cleared 30.23% on its own tandem module. This technology is still a few years out, most manufacturers are targeting 2028-2029 for commercial sale.
Better solar cells only matter if the energy they generate can be stored and used later, which is where the show’s real headline was.
The Solar Efficiency Ladder – how the different solar technologies shown at SNEC 2026 compare.
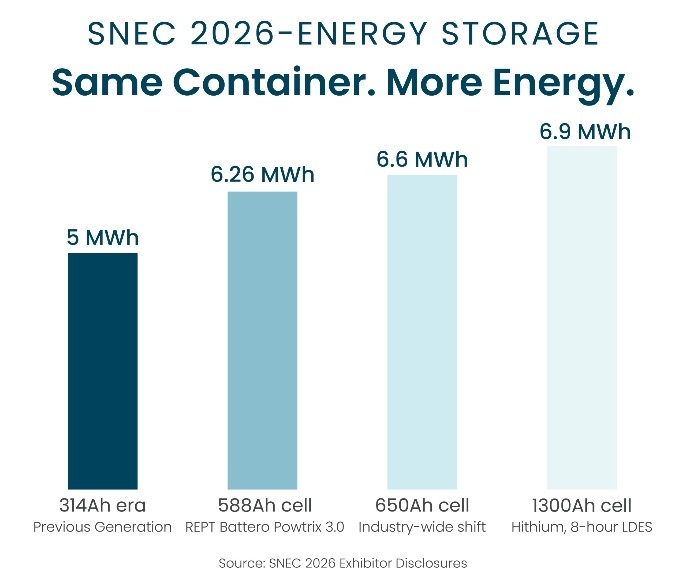
Battery cells got noticeably bigger this year, and bigger cells mean fewer parts inside each system, which lowers the cost of building it.
Same Container, More Energy – how much a standard 20-foot battery container now holds.
Sodium-ion: a second battery chemistry
At the same time, sodium-ion batteries moved from lab prototypes to real products.
Sodium doesn’t store as much energy as lithium for the same size – but it removes the need for lithium altogether, which matters as raw material costs stay unpredictable.
Our team at CATL’s booth, where the company unveiled its sodium-ion battery specs alongside its existing lithium lineup.
Storing energy cheaply solves only half the problem. The other half is getting it onto a power grid that wasn’t built for this much variable power.
Our team at CATL’s booth, where the company unveiled its sodium-ion battery specs alongside its existing lithium lineup.

As more solar and battery power connects to the grid, keeping that grid stable gets harder – voltage and frequency become less predictable. The fix on display at SNEC was “grid-forming” technology: inverters built to act like traditional power plants instead of simply feeding into the grid.
A related technology, solid-state transformers, is also gaining ground. StarCharge showed a new version that skips several unnecessary power-conversion steps – useful for EV charging hubs, battery storage sites, and data centres alike.
That last mention – data centres, turned out to be its own growing category at the show, not just a side note.
AI data centres are expected to drive an extra 85-100 GW of solar demand globally by 2030. But their power needs are different from a typical solar project – they need equipment built for constant, high-density power draw.
Put together, these shifts point to one theme: the industry is standardising its hardware, and competing instead on the software and systems layered on top of it. Companies are no longer just selling parts, they’re selling complete solar-plus-storage-plus-management platforms. That’s where the real value is moving.
Individually, these are product updates. Together, they form a pattern worth sitting with.

AI & Data Center
The Bottleneck Nobody Talks About in the Energy Transition
India wasted 2.3 TWh of solar in 2025 not bad panels, but missing wires. The real energy transition bottleneck is transformers, HVDC, and a supply chain the world is fighting over.
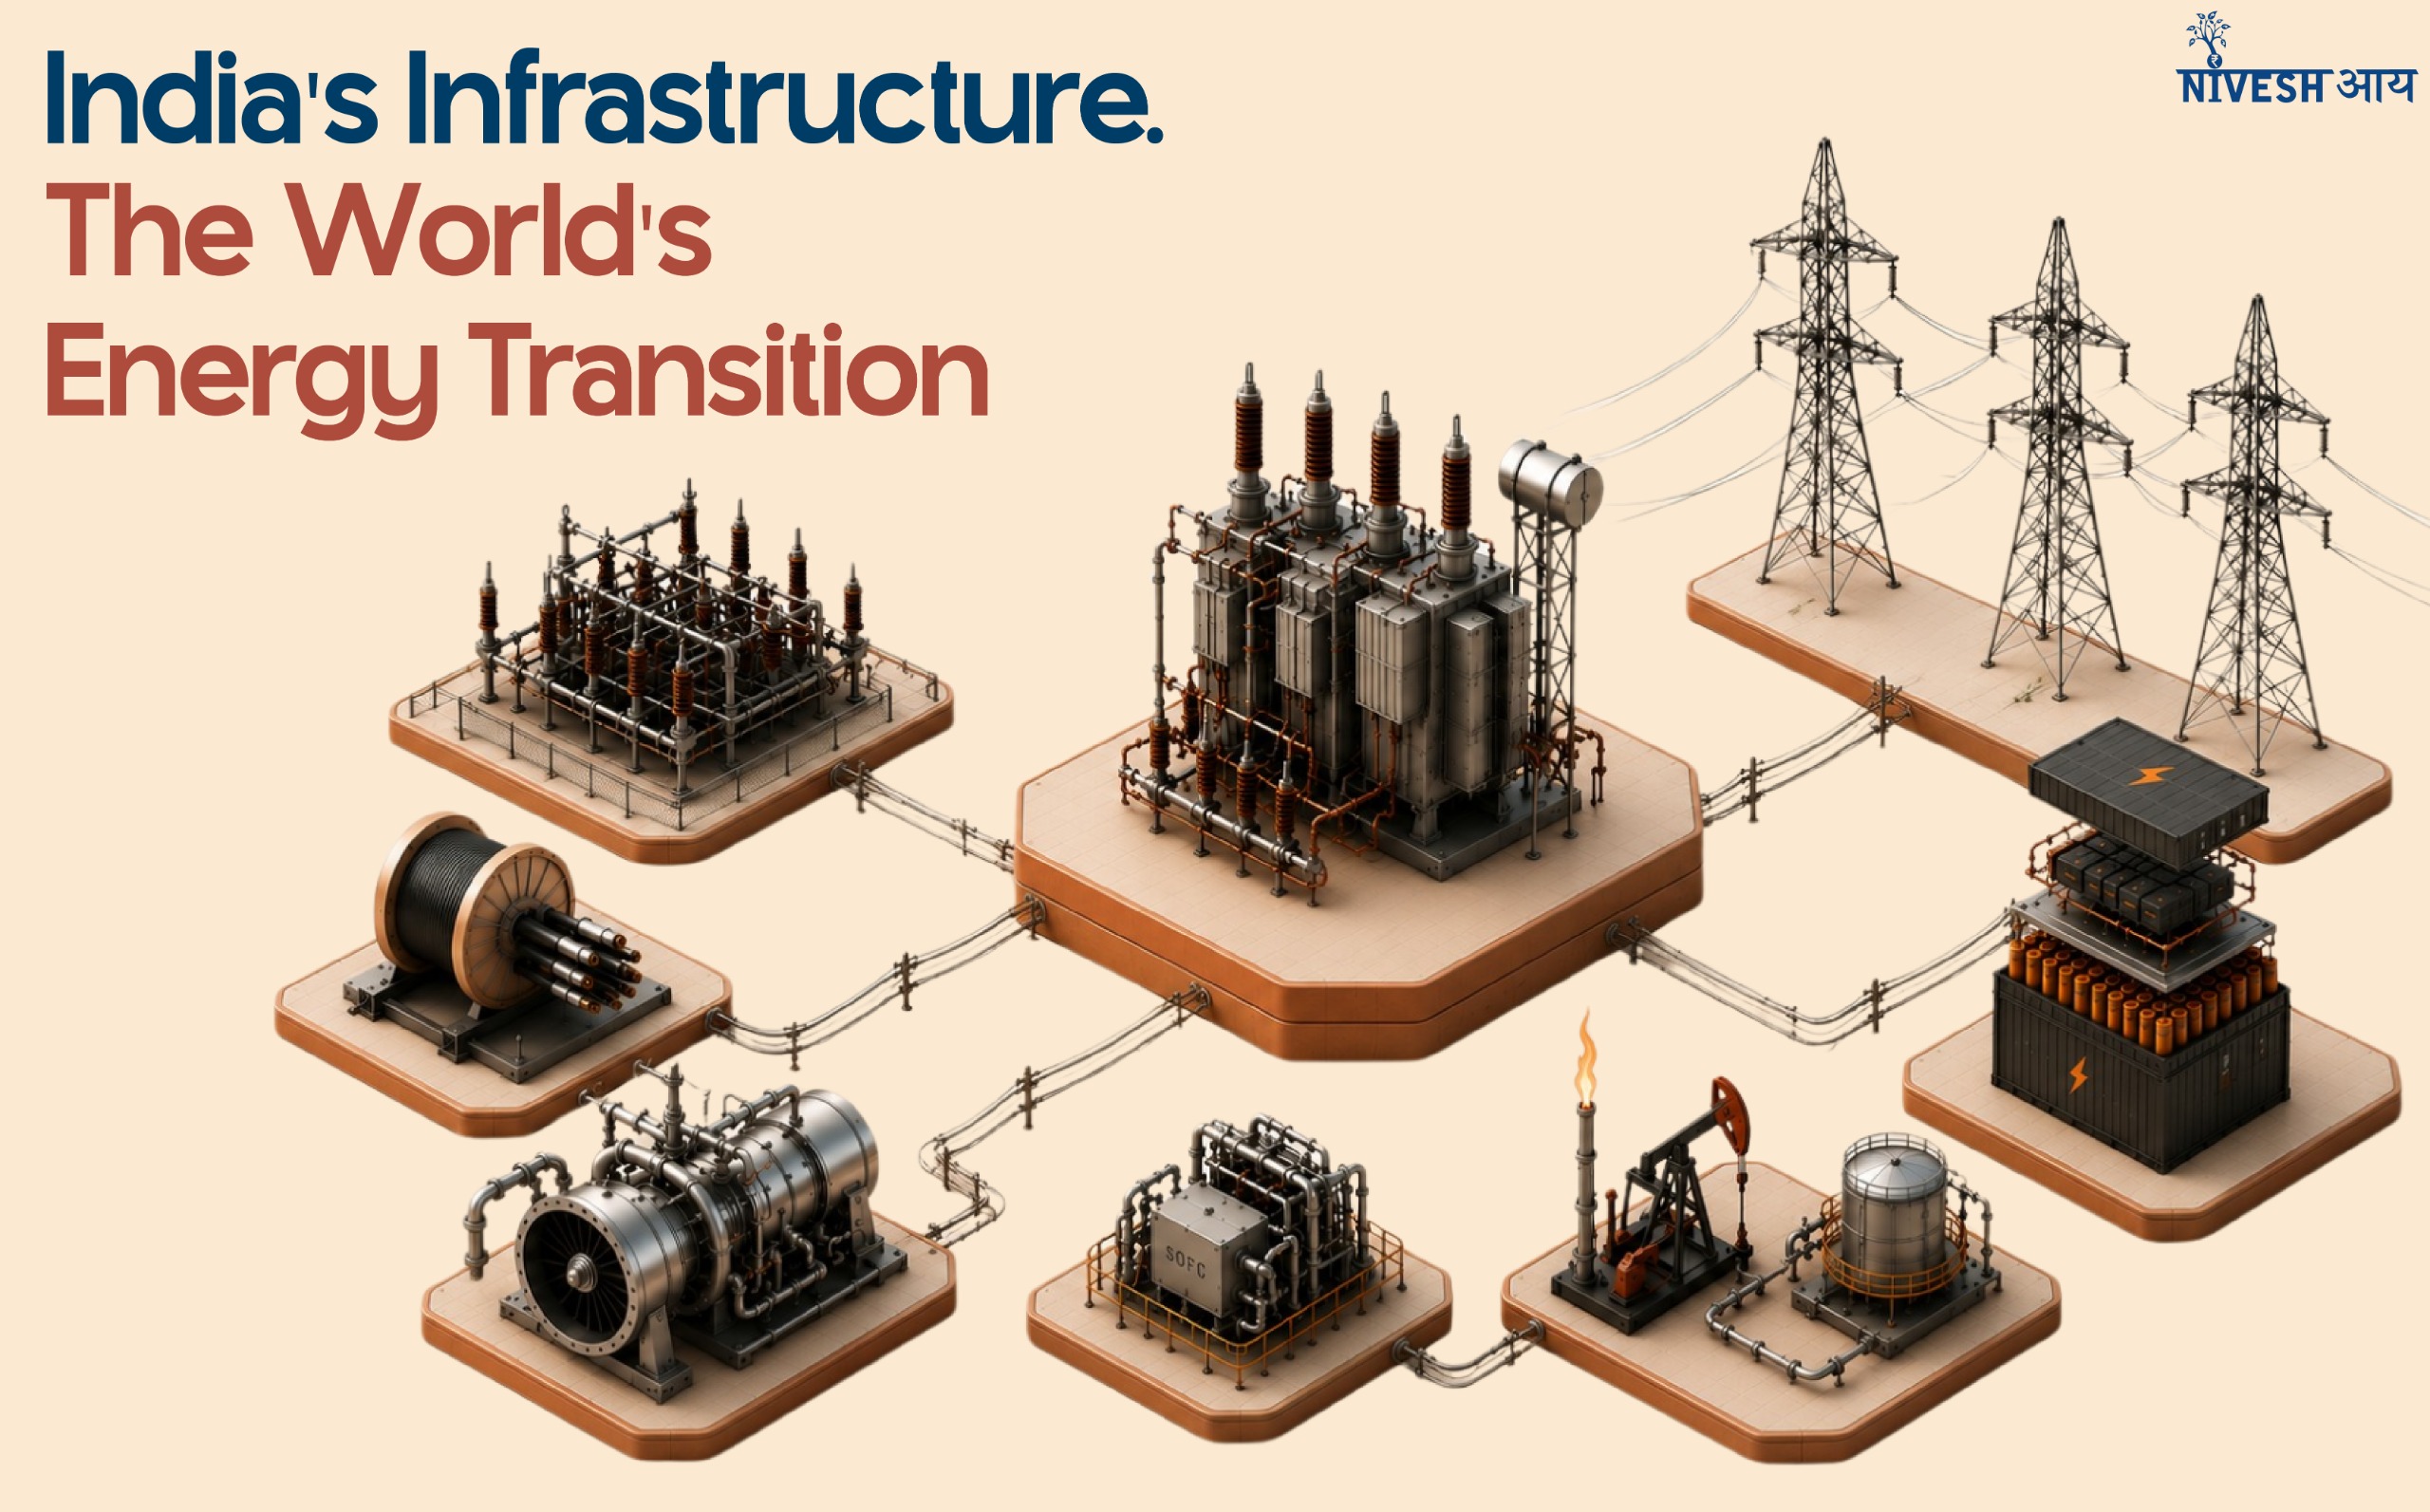
India curtailed 2.3 TWh of clean electricity in 2025, enough to power 400,000 homes for a year. Not because the solar panels stopped working. Because the wires to carry that power did not exist.
Solar can be built in 18–24 months. That speed is its biggest advantage. But it created a new problem: solar farms started finishing faster than the equipment needed to connect them could be manufactured.
The power plant is ready. The electricity cannot move.
And India is not alone. In 2025, global clean energy investment hit $2.3 trillion. The US, EU, India, and the Gulf are all running the largest energy buildouts in their histories, simultaneously, all ordering from the same handful of manufacturers. What felt like a local bottleneck turned out to be a global supply chain collision.
Between March and August 2025, at least 30 solar and wind projects across India faced curtailment, with financial losses estimated at ₹700 crore in just six months.
Rajasthan curtailment: nearly 4 GW; started at 8.5% in March, rose to 51.5% by August
Gujarat and Maharashtra: 10–30% curtailment during peak solar generation hours
Total solar curtailed (May–Dec 2025): 2.3 TWh – enough to power ~400,000 homes for a year
Rajasthan’s total approved transmission capacity: 14,000 MW. Commissioned and approved generation: ~22,500 MW. The state has 60% more generation than its transmission system can absorb.
The panels were generating. The electricity existed. The wires were not there.
This is green energy’s success creating its own constraint. The faster solar scaled, the more visible the gap became.
Every solar farm, wind project, data centre, and factory needs a transformer to connect to the transmission network. It is not optional. There is no substitute. And right now, it is one of the scarcest pieces of industrial equipment on earth.
Lead time, 2019: 24–30 months
Lead time, Q2 2025: 128–144 weeks for standard units; specialist orders stretching to 4 years
Power transformer price increase since 2019: 77%. Distribution transformers: 78–95%
Generator step-up transformer demand since 2019: up 274%. Manufacturing capacity has not kept pace
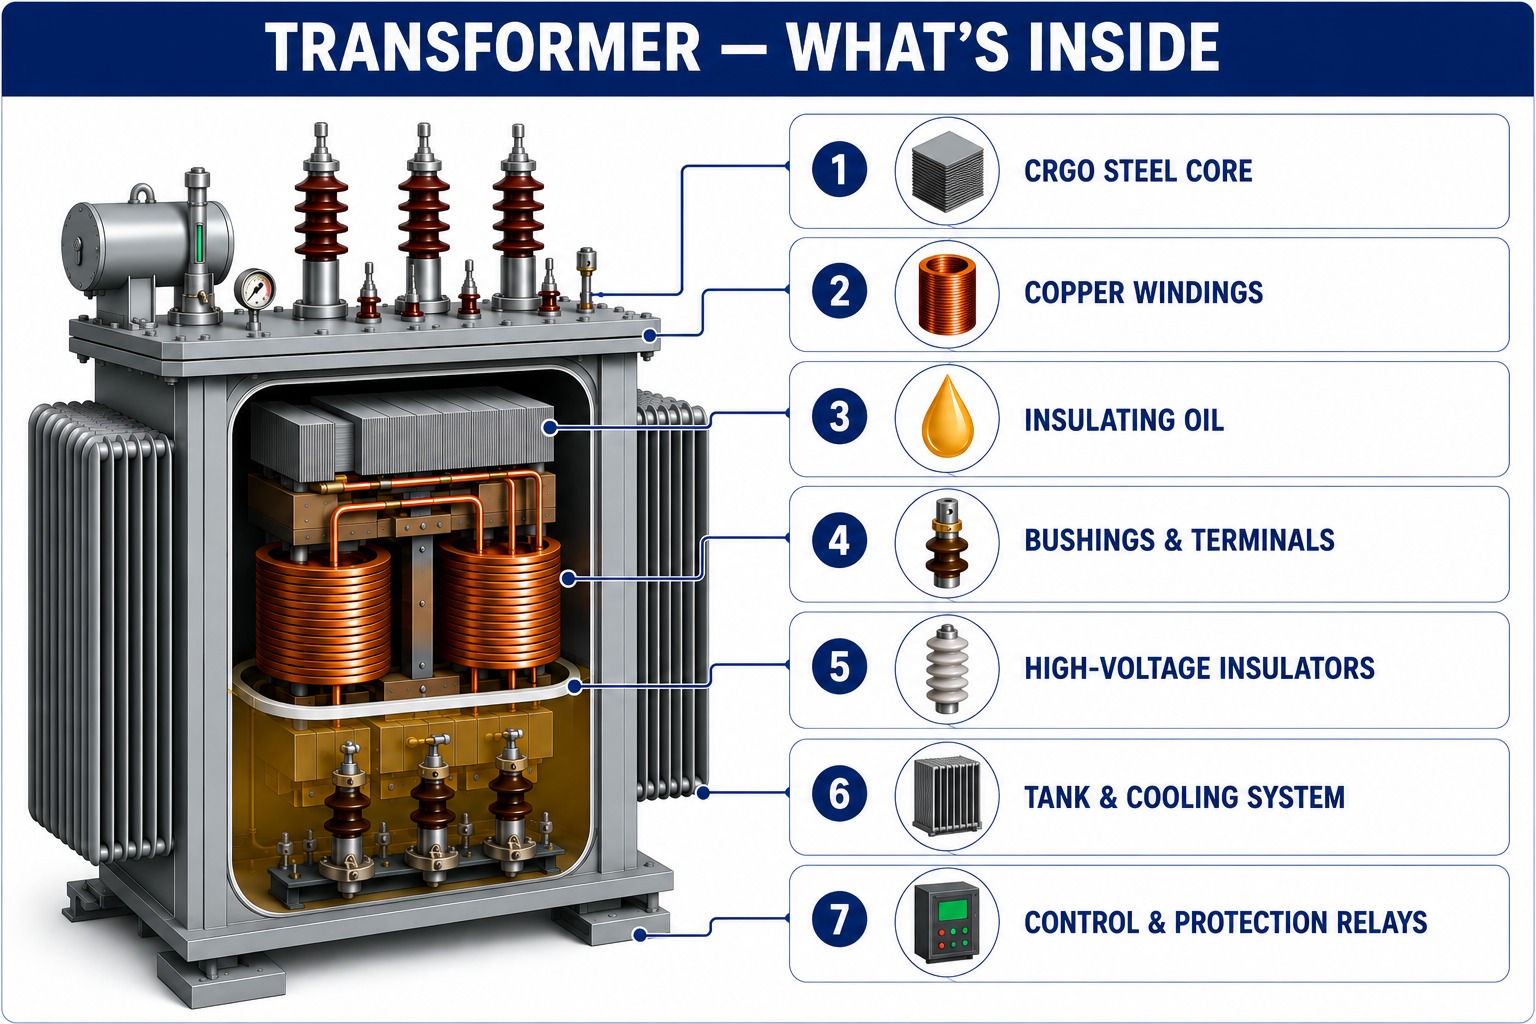
Transformers need CRGO steel, made by just five mills globally. Certified manufacturers take 2–3 years to qualify. Skilled engineers take years to train. Fix one layer, the next one still blocks. The shortage is expected to persist until 2029.
India Opportunity – Insulators
Inside every transformer bushing sits a high-voltage insulator, the ceramic sleeve that prevents arc discharge at transmission voltages. Without it, the transformer cannot operate. India imports ~70% of its requirement today.
India insulator market: $451 million (2025) → $725 million by 2034
The NEP targets 270,000 circuit km of new transmission lines by 2027. As corridors push to 765 kV and 1,200 kV UHV AC, certification requirements tighten. India already has global-scale domestic players:
Domestic plays on a component India currently imports heavily – demand scales directly with the NEP transmission buildout.
Connecting a solar farm to its nearest substation solves only part of the problem. India’s geography creates a second, larger challenge.
The best solar resource sits in Rajasthan and Gujarat. The largest demand centres, UP, Bihar, West Bengal – are 1,000 to 2,000+ km away. Standard AC transmission loses 5–8% of electricity per 1,000 km. HVDC loses just 2–3%. At these distances and volumes, HVDC is not a technical preference. It is the only economical solution.
India HVDC market: $3.86B (2025) → $5.84B by 2030 at 8.65% CAGR
Largest HVDC order in India’s history: ₹20,773 crore Ladakh-Kaithal project, Cabinet-approved
Hitachi Energy India order backlog (Q2FY26, Sept 2025): ₹29,412 crore, a company record
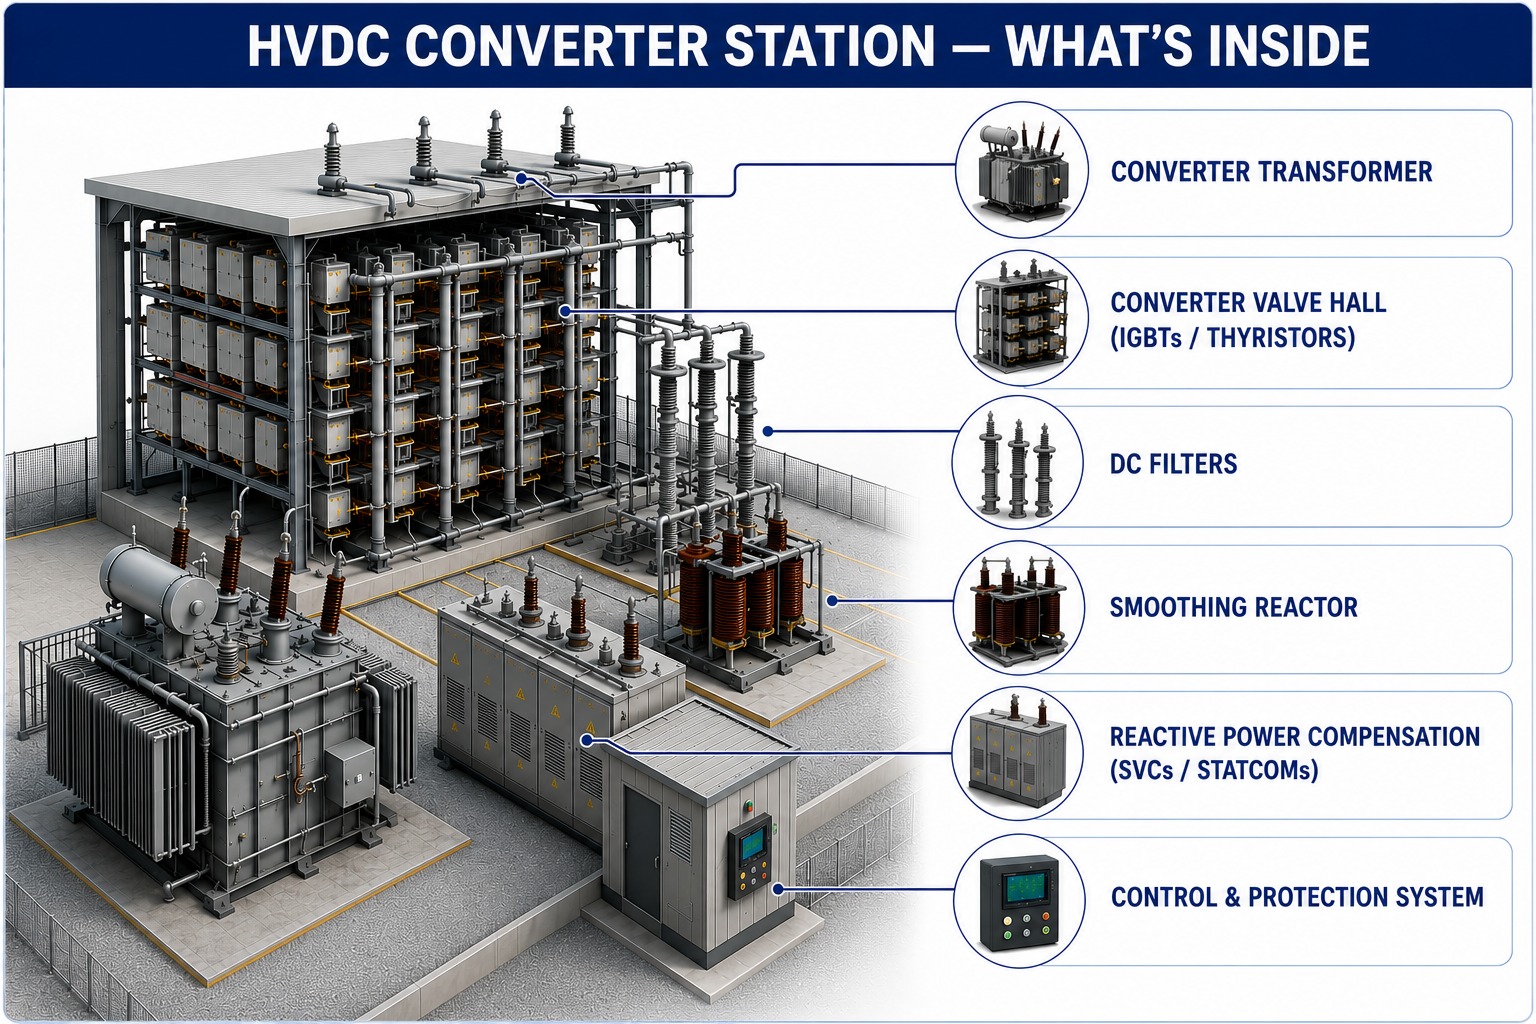
India Opportunity – HVDC Conductors & Cables
The converter station is only half the system. Every corridor also needs specialty high-voltage DC conductors and oil-filled cables running its entire length, engineered specifically for HVDC, non-substitutable, and procured fresh for every project.
JP Morgan estimates $14–15B in HVDC opportunity for Indian players over the next 5–6 years. The cable layer is where a domestic player is already qualified, already earning, and scaling with every corridor India builds.
Transformers connect solar farms to the network. HVDC moves power across long distances. But a fundamental timing problem remains: solar generates most heavily at noon. Demand peaks in the evening.
Without storage, that mismatch either forces curtailment, the ₹700 crore problem already playing out, or keeps fossil backup running permanently. BESS stores midday surplus and dispatches it when demand rises, reducing both curtailment and the peak load the transmission system must carry.
BESS is what converts intermittent green electricity into a 24/7 supply contract. Without it, every solar panel India installs is generating electricity that cannot be fully used.
India BESS market: $2.05B (2026) → $8.59B by 2031 at 33% CAGR
BESS growth in 2026: under 200 MWh (2025) → ~5 GWh (2026) – a near-tenfold expansion in one year
BESS tenders issued in 2025 alone: 69 new tenders totalling 102 GWh – nearly double all previous years combined
CEA BESS target by 2031–32: 236.2 GWh battery + 175.2 GWh pumped hydro = 411 GWh total
India Opportunity – Battery Cell Manufacturing
The constraint inside BESS is the cell – currently ~6 Chinese manufacturers dominate global supply. India’s ACC PLI target is 50 GWh; only 1.4 GWh is commissioned – 2.8% achievement. Two players are building outside the PLI framework, on commercially viable timelines:
Cell import dependency until 2027–28 is the constraint. These are the two domestic plays building into it.
The connection between green energy and gas turbine shortages is not obvious. Here is how it happened.
As solar and wind scaled globally, grids needed dispatchable backup- power that turns on in minutes when the sun is not generating. Gas turbines are that backup. Simultaneously, AI data centres that cannot wait 5–7 years for a network connection started generating their own power on-site. Gas turbines are the on-site solution.
The green energy buildout that is replacing gas in power generation is simultaneously driving record demand for gas turbines as backup and as data centre power. Green energy did not reduce gas turbine demand. It restructured it and compressed the timeline from years to months.
Gas turbine lead times, 2020: 12–18 months
Gas turbine lead times, 2025: 3–4 years – GE Vernova, Siemens Energy, Mitsubishi Power all at multi-decade high backlogs
US power connection queue, 2025: 2,600 GW+ waiting – more than the entire installed US generation base
Hyperscalers stopped waiting. Microsoft, Google, and Amazon became direct buyers of gas turbines, adding a third demand signal to a supply chain already strained by grid modernisation and industrial backup needs.
Gas turbines are powerful but inflexible, they need dedicated space, acoustic mitigation, and specialist maintenance crews. For an AI campus adding capacity server hall by server hall, that is operationally wasteful.
Solid Oxide Fuel Cells solve this differently. No combustion. No rotating parts. Efficiency of 60%+ versus 35–40% for a simple-cycle gas turbine. Units are containerised, stackable, modular, a campus can add 1 MW of SOFC power at a time, exactly as demand grows.
The constraint is the hot box, the core electrochemical unit. And this is where India has a position.
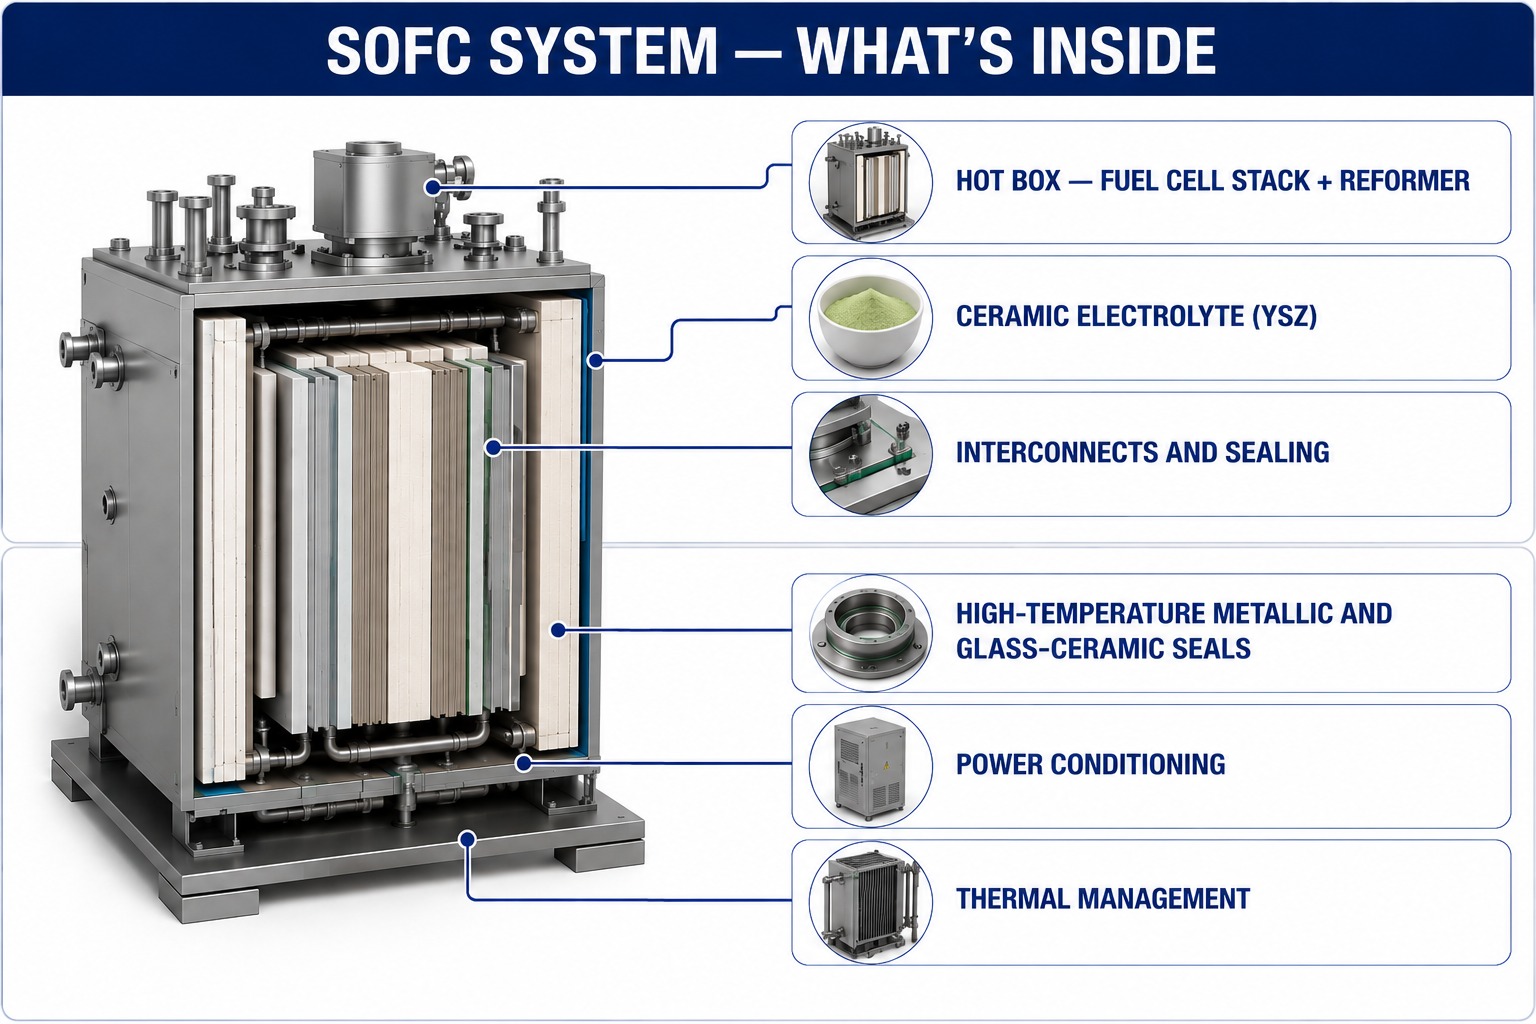
India Opportunity – SOFC Hot Box
The hot box is the highest-value, highest-scarcity node in the entire SOFC system – the single-crystal blade equivalent for this technology. MTAR Technologies manufactures it to the tolerances required by SOFC OEMs deploying systems at Google, Microsoft, and AT&T data centres across the US.
This is not thematic positioning. The orders are active. The OEM qualification cycle takes years; MTAR already holds it. Fewer than 5 manufacturers globally can produce this at commercial scale.
The ceramic electrolyte (YSZ), interconnects, and power conditioning layers all involve specialist materials — but the hot box is where the supply constraint is most acute and the India position most defensible.
Every major economy is placing orders with the same transformer factories, the same HVDC suppliers, the same cable producers, and the same gas turbine makers – simultaneously.
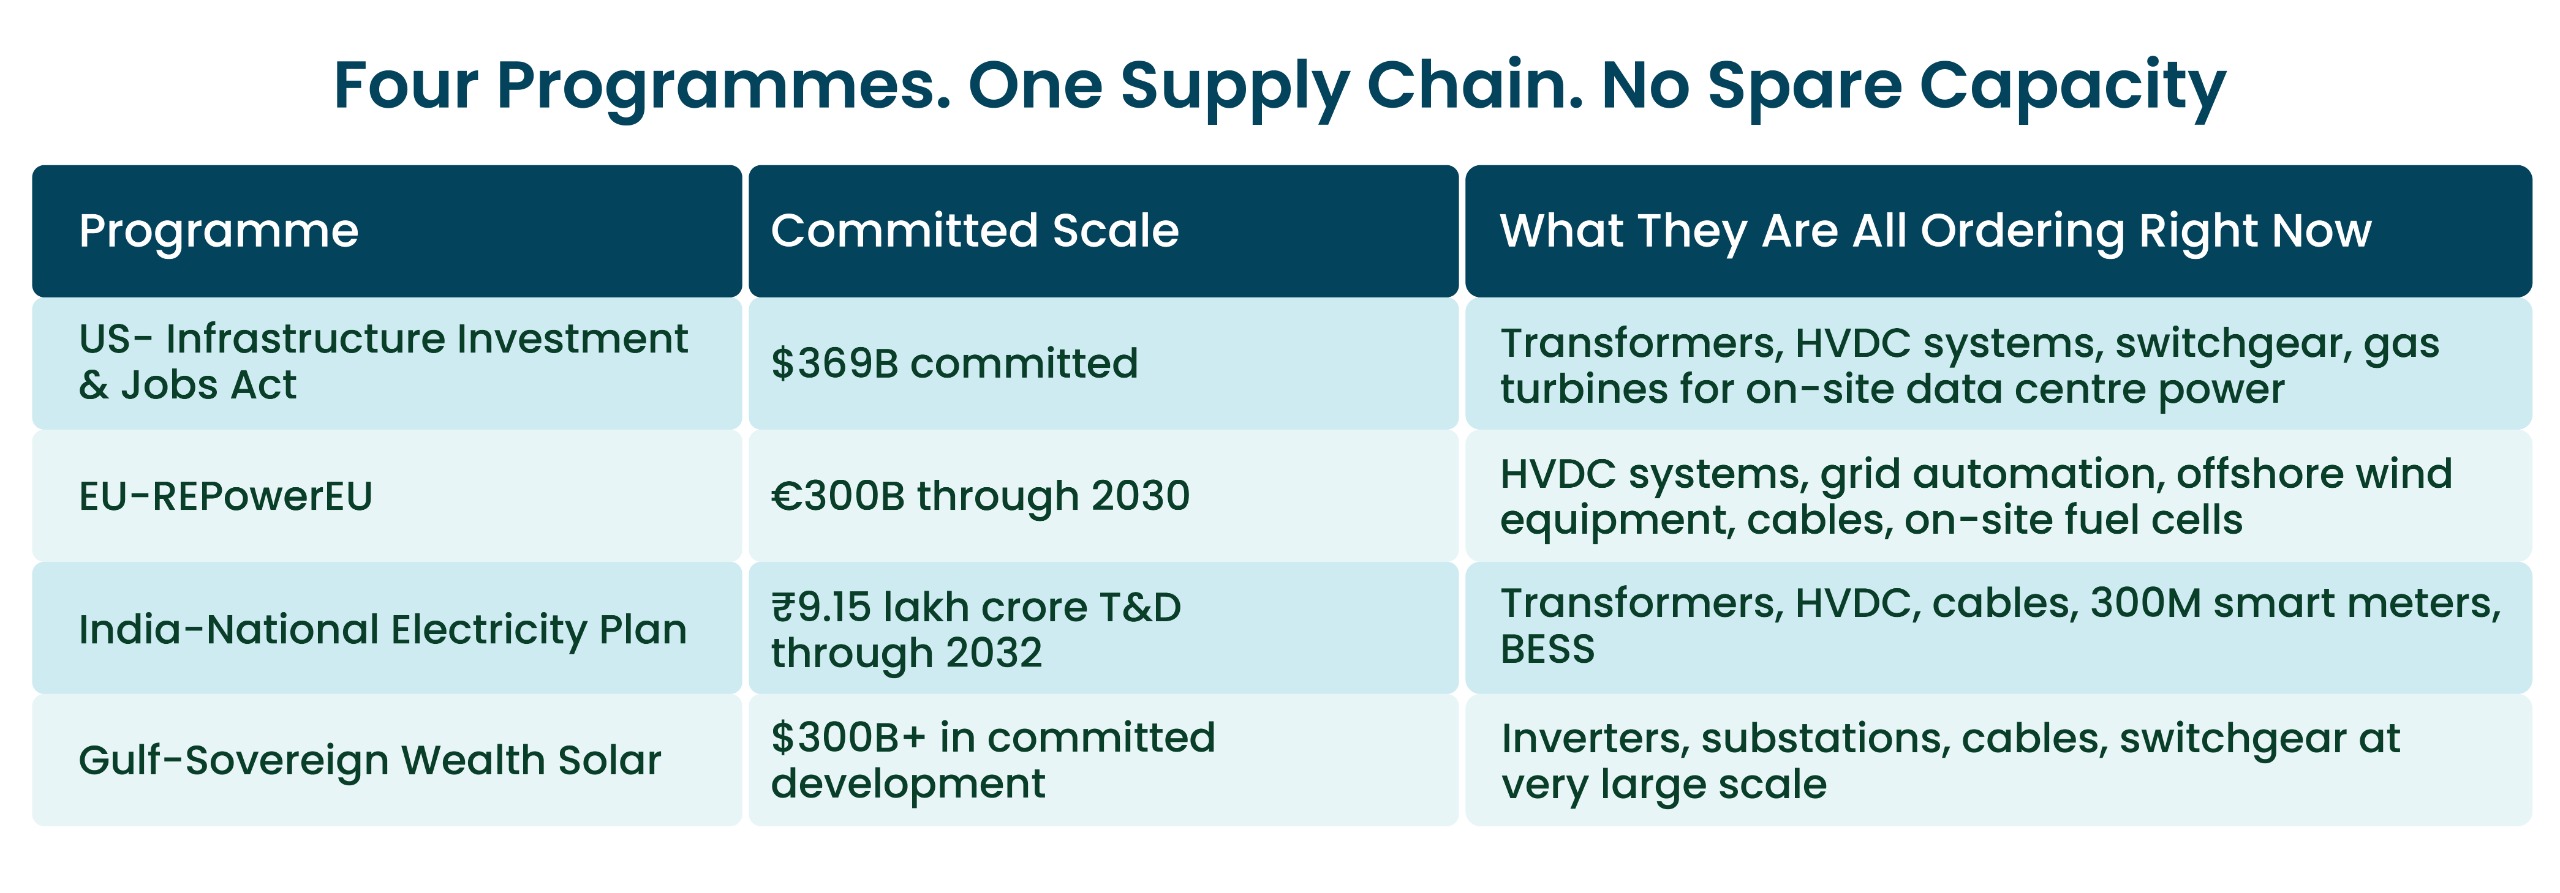
None of these programmes can be scaled quickly. All require years of qualification, specialist materials, and workers that take years to train. The demand arrived simultaneously. The supply did not.
Every previous infrastructure boom stressed supply chains that had recovery mechanisms. If one supplier was full, a second was available. The green energy supply chain does not work this way.
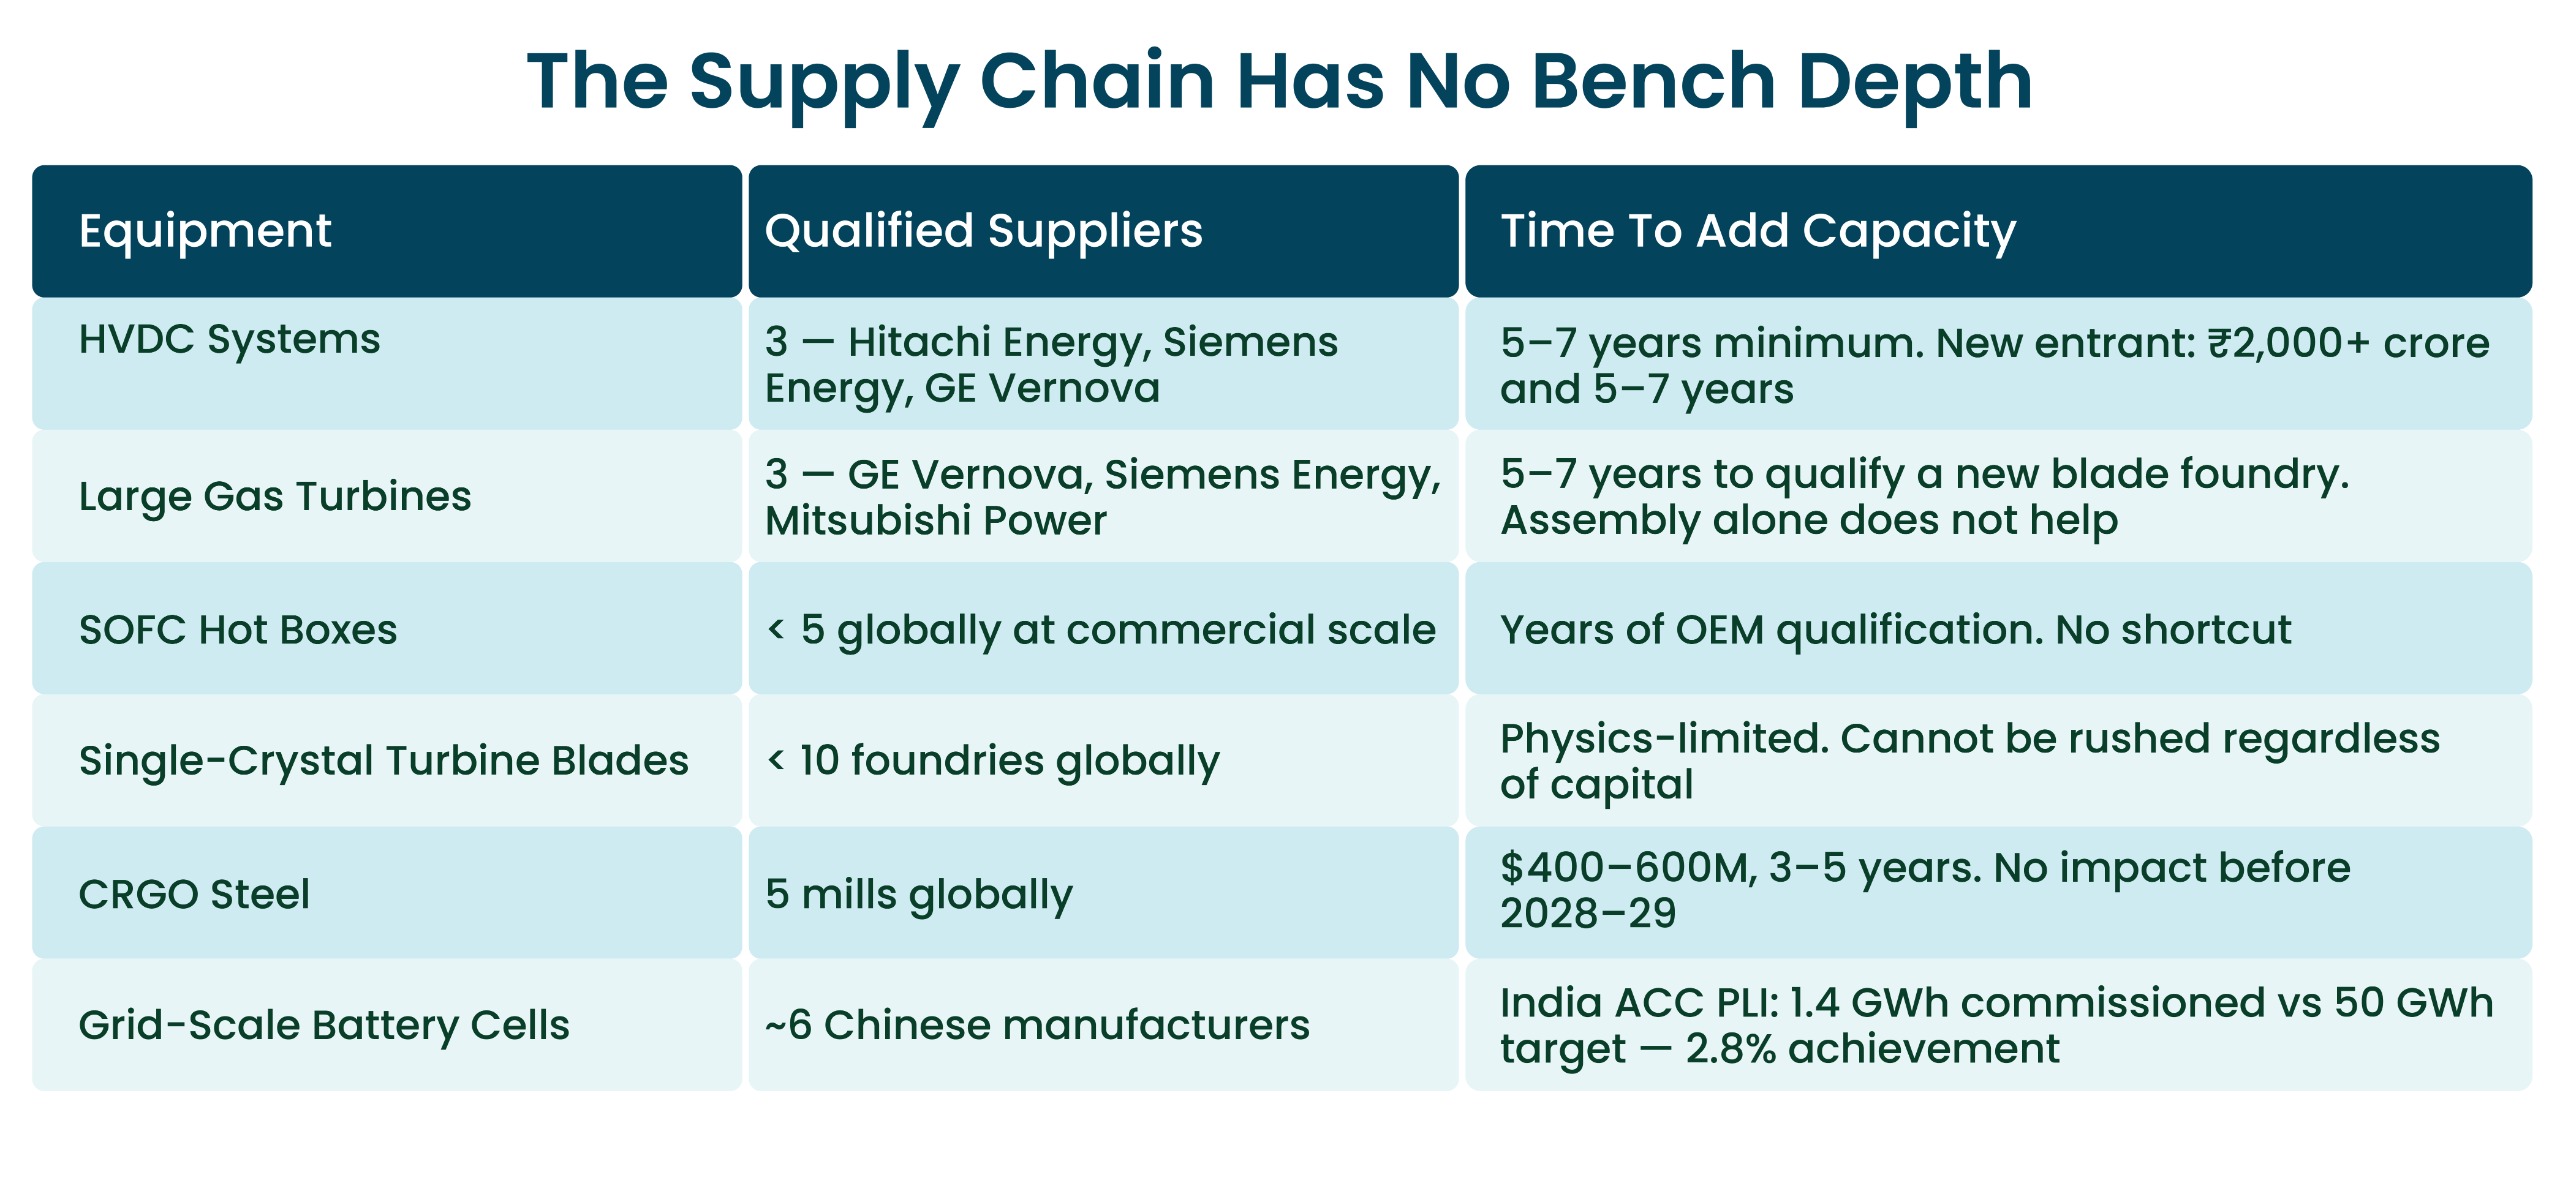
When the top tier is full, there is no second tier. That single fact is what makes this crunch structurally different from everything that came before – and why it lasts longer than most forecasts suggest.
India is simultaneously the largest new buyer in this constrained market and earning certified positions inside the very supply chain it is ordering from, qualifying at the highest-value, hardest-to-enter nodes:
Gas turbine blades, SOFC hot boxes, HVDC components, battery cells – not commodities. They are the bottlenecks. And Indian manufacturers are earning certified positions inside them, one qualification at a time.
Key Insight
Solar scaled faster than the infrastructure built to carry it. India is generating electricity it cannot use – ₹700 crore lost in six months to missing wires. The fix needs transformers (shortage until 2029), HVDC (three global manufacturers, all at capacity), gas turbines (lead times now 3–4 years), and BESS (cell import dependency until 2027–28).
Green energy created four simultaneous demand signals on a supply chain built for one. There is no bench depth anywhere in it – when the top tier is full, everyone waits. India’s position is unusual: it is simultaneously the largest new buyer in this constrained global market and earning certified manufacturing positions inside the very supply chain it is ordering from.
These markets together represent over $13B in India today, growing at 8–33% annually, backed by committed government capex. Green energy built the demand. The infrastructure that carries it is where the investment case lives.
→ The supply chain crunch is reshaping who can manufacture competitively. When lower-cost electricity arrives at industrial scale, it reshapes something even bigger – where manufacturing happens at all, and who wins in it.
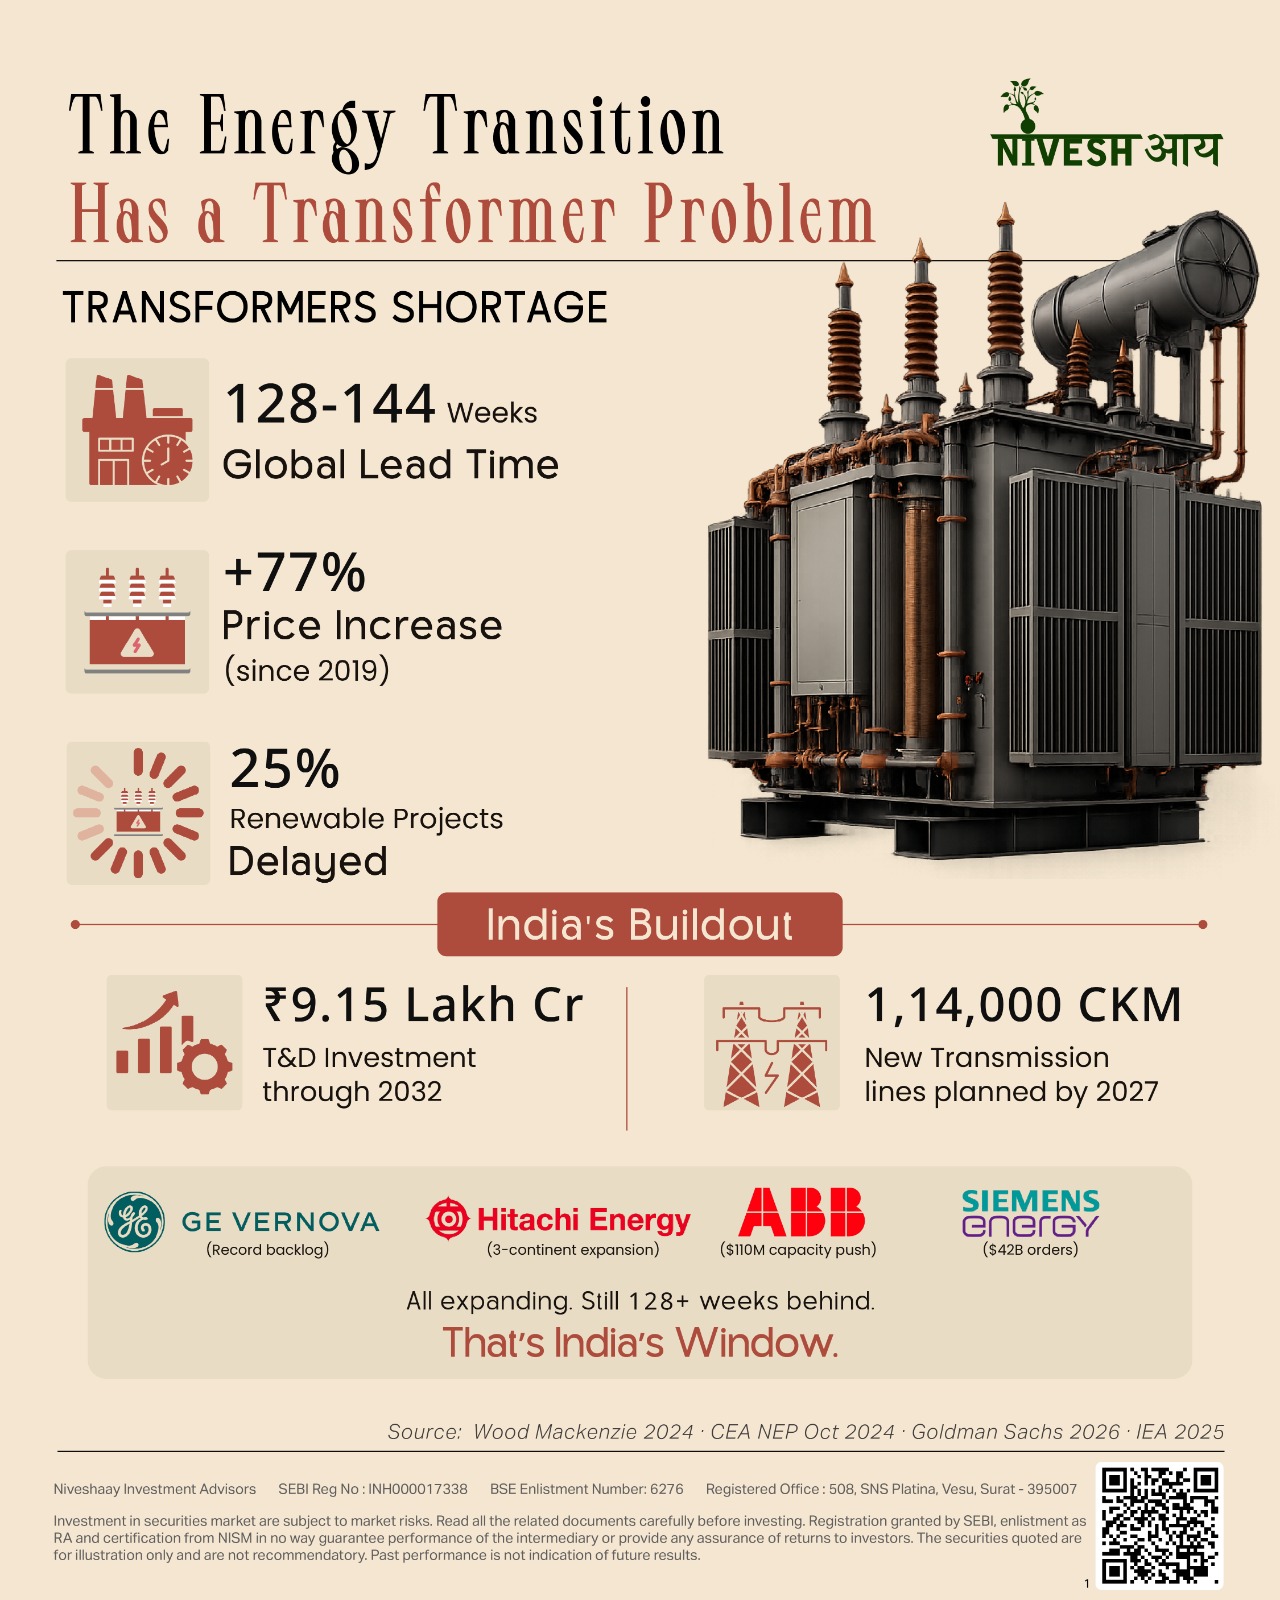
Power & Renewable Energy
Green Energy 2.0: How India Got Inside Every Layer
Transformers, HVDC, BESS, insulators, SOFC hot boxes — the equipment the energy transition needs most is running short. India is inside every layer of the supply chain.
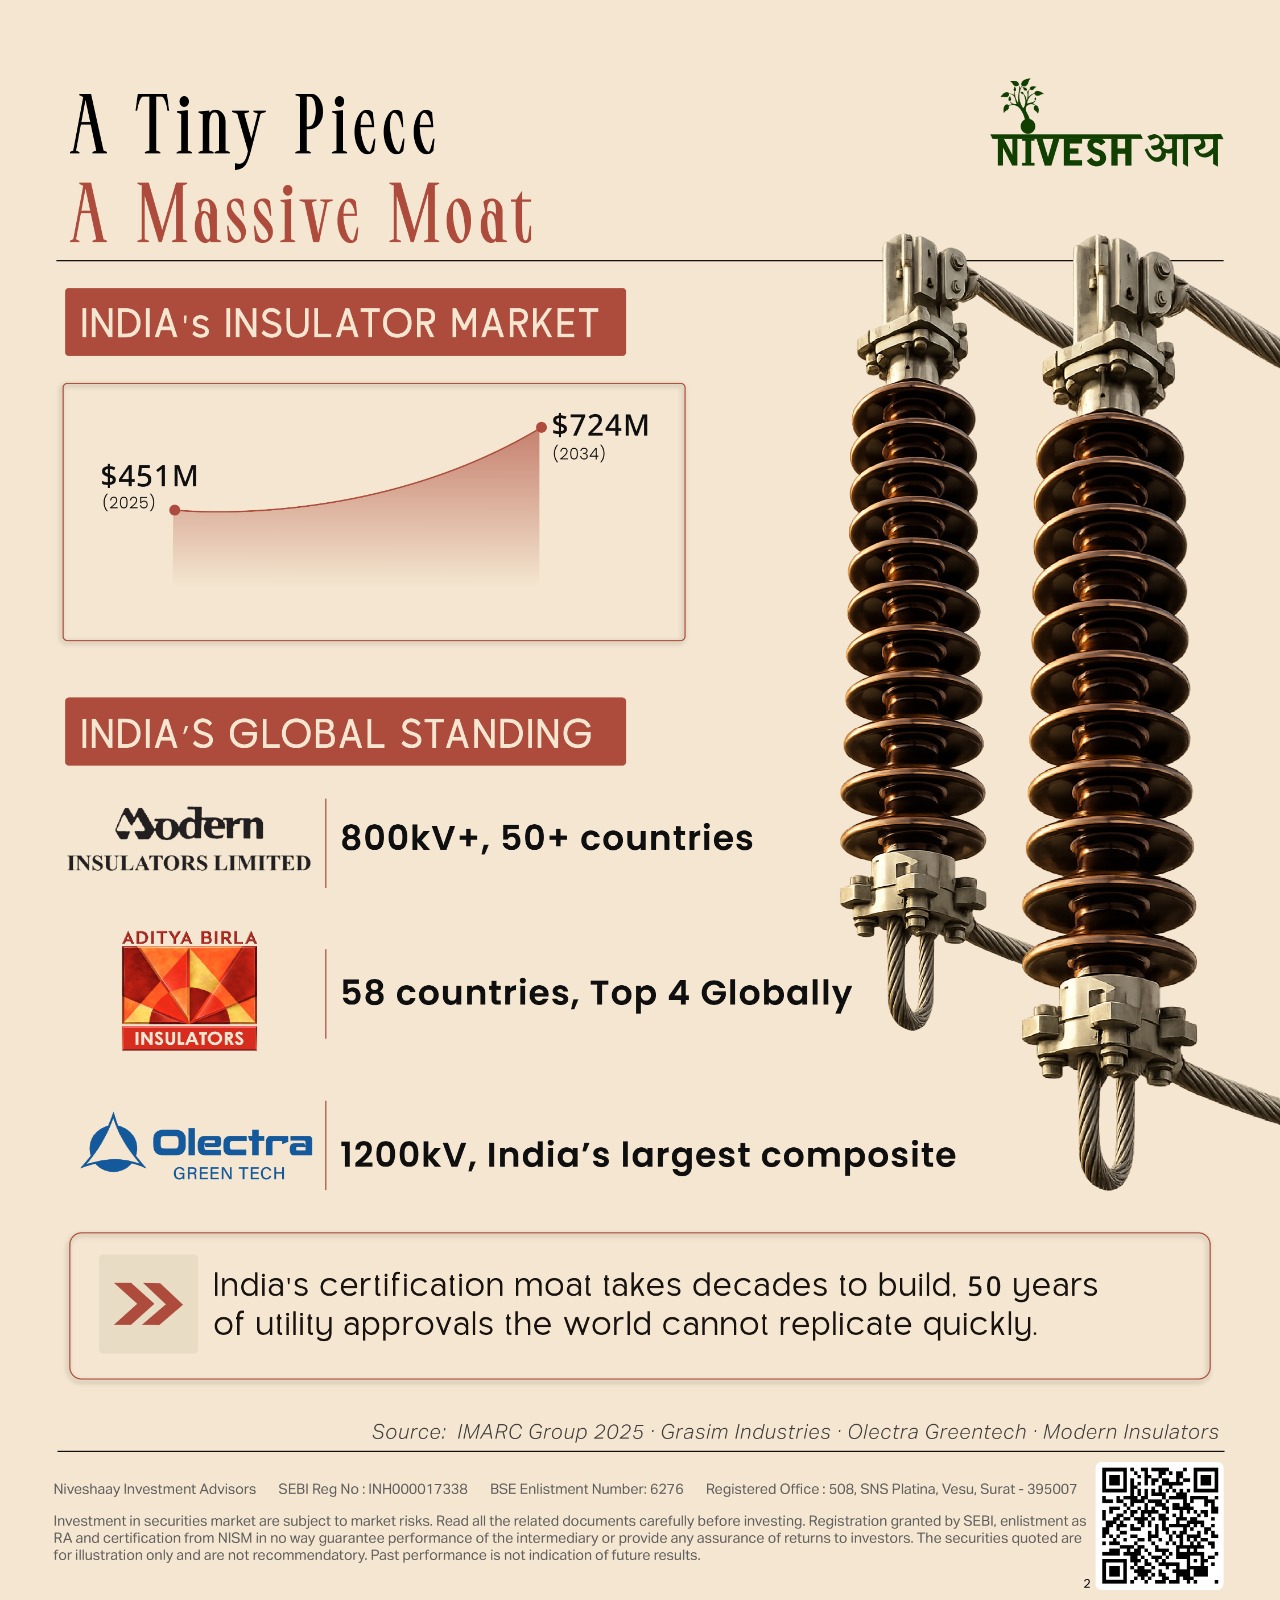
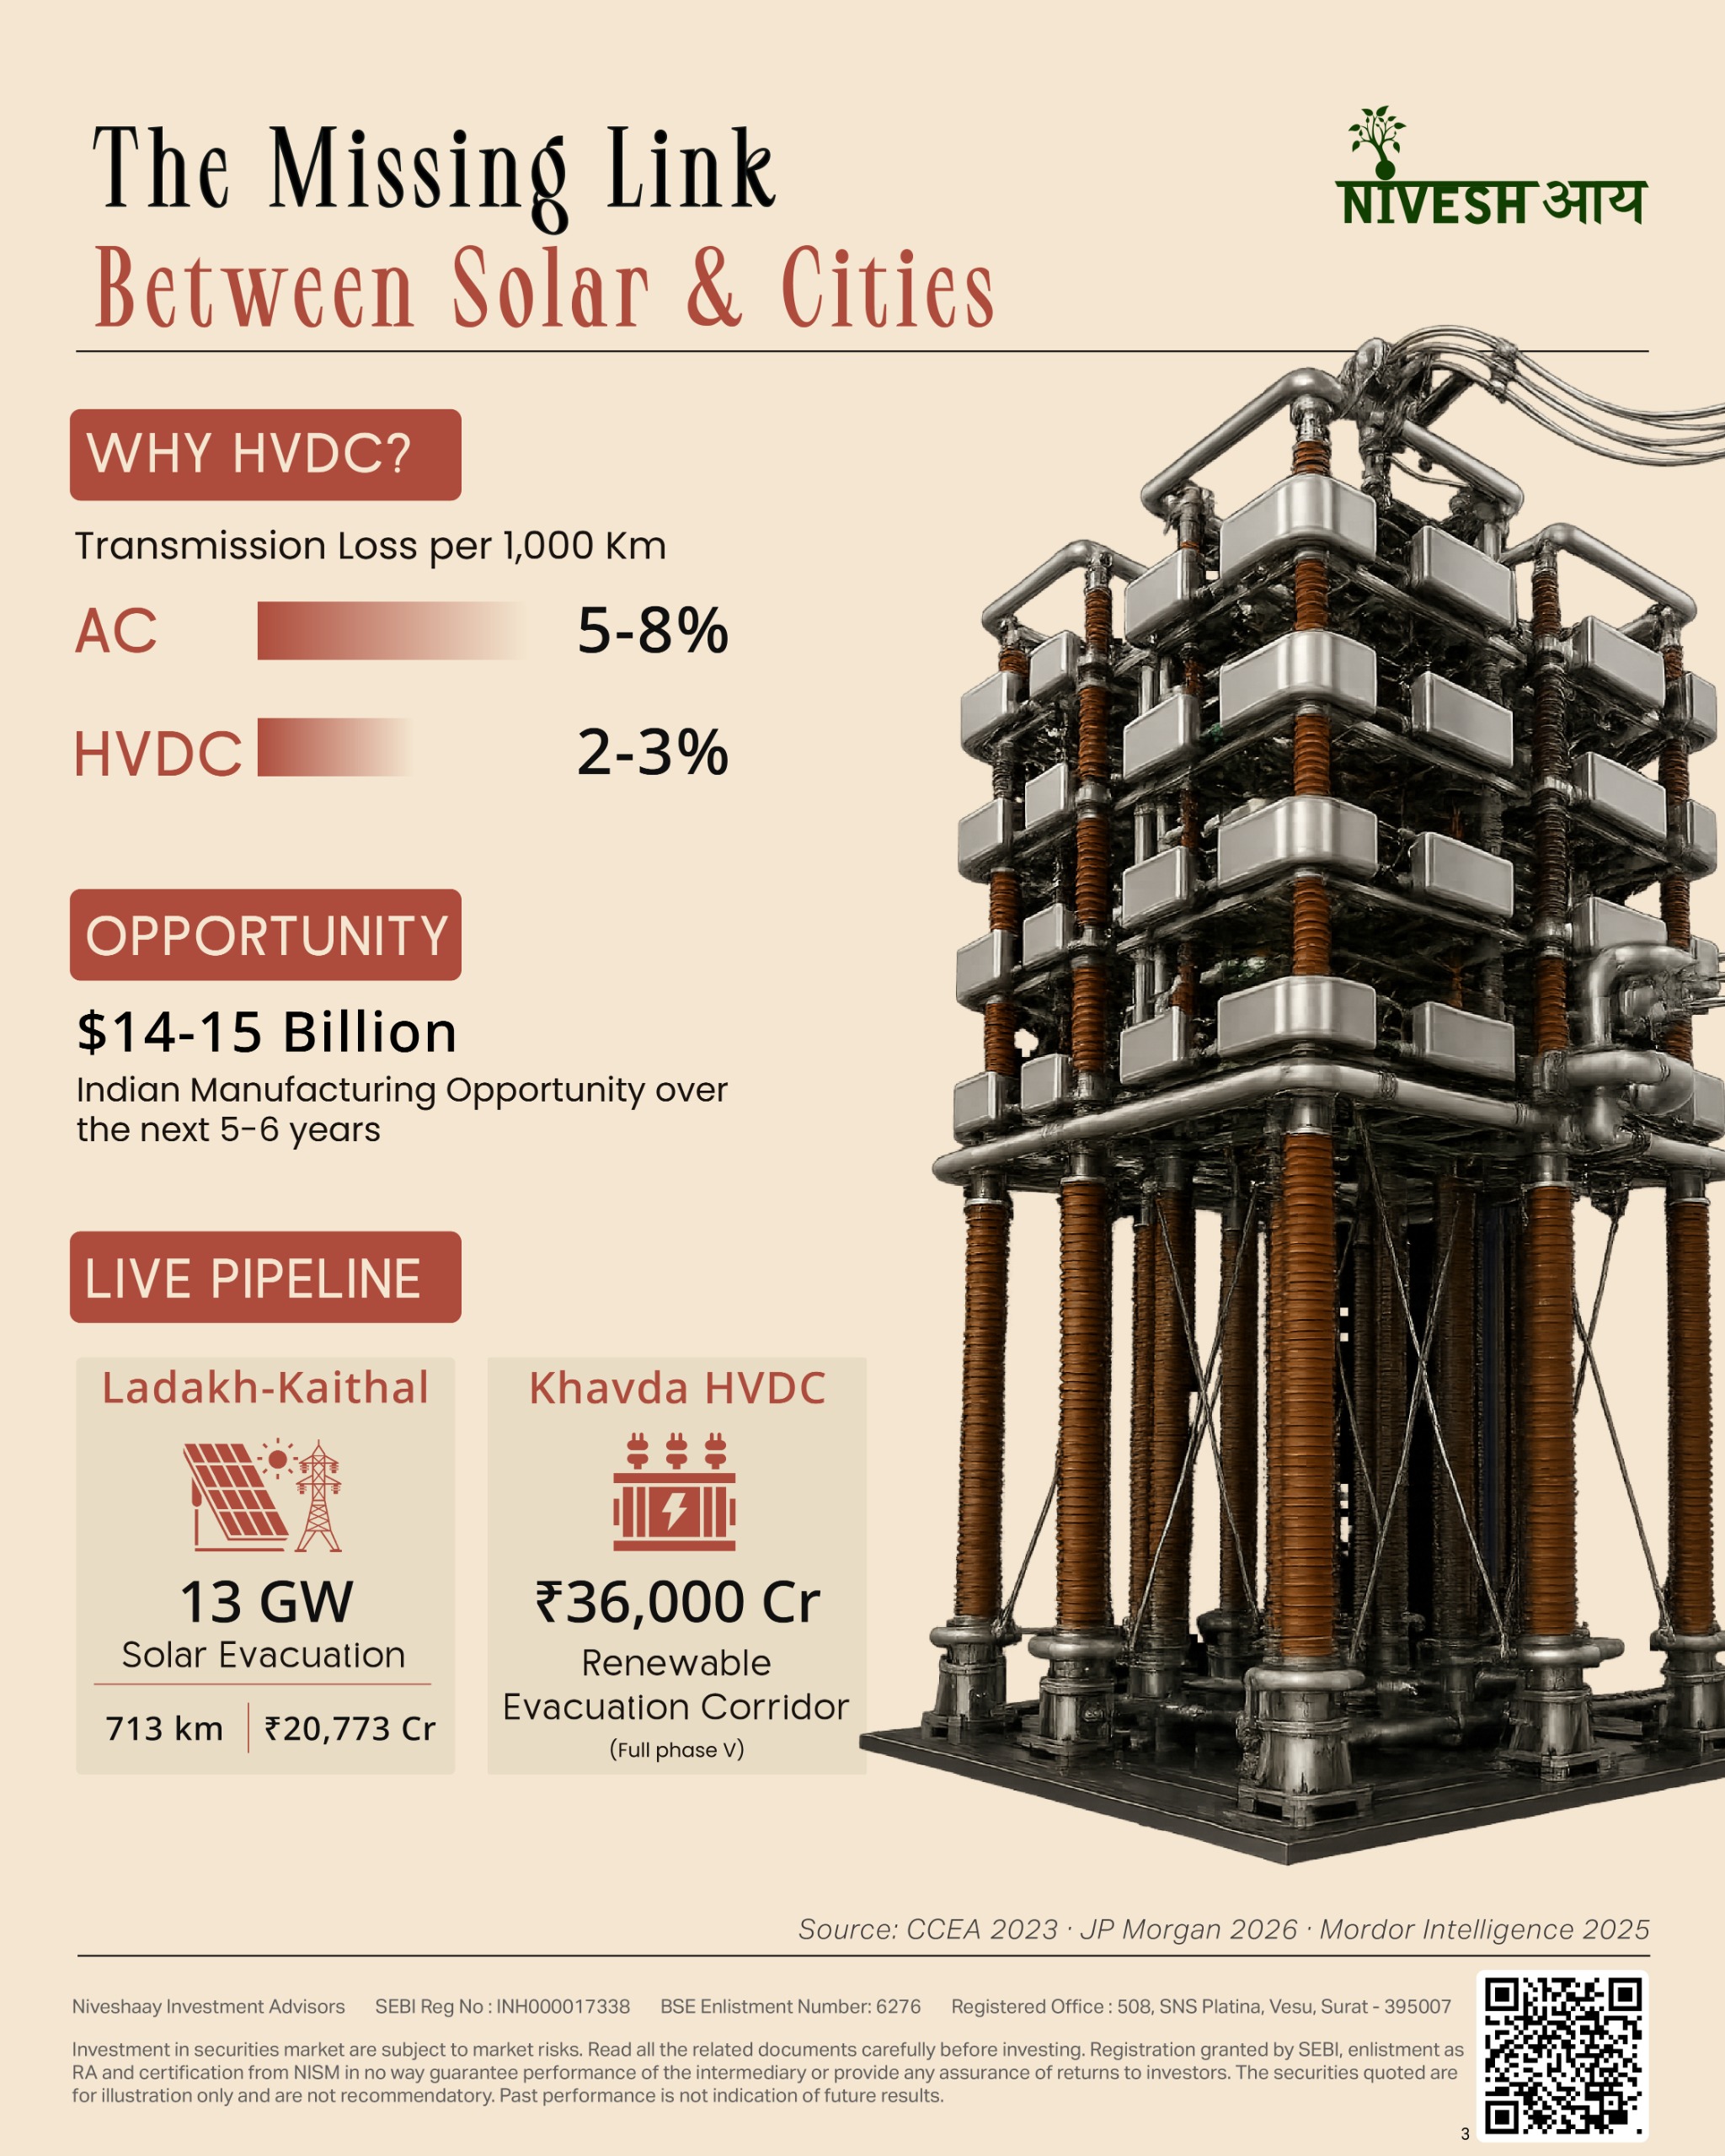
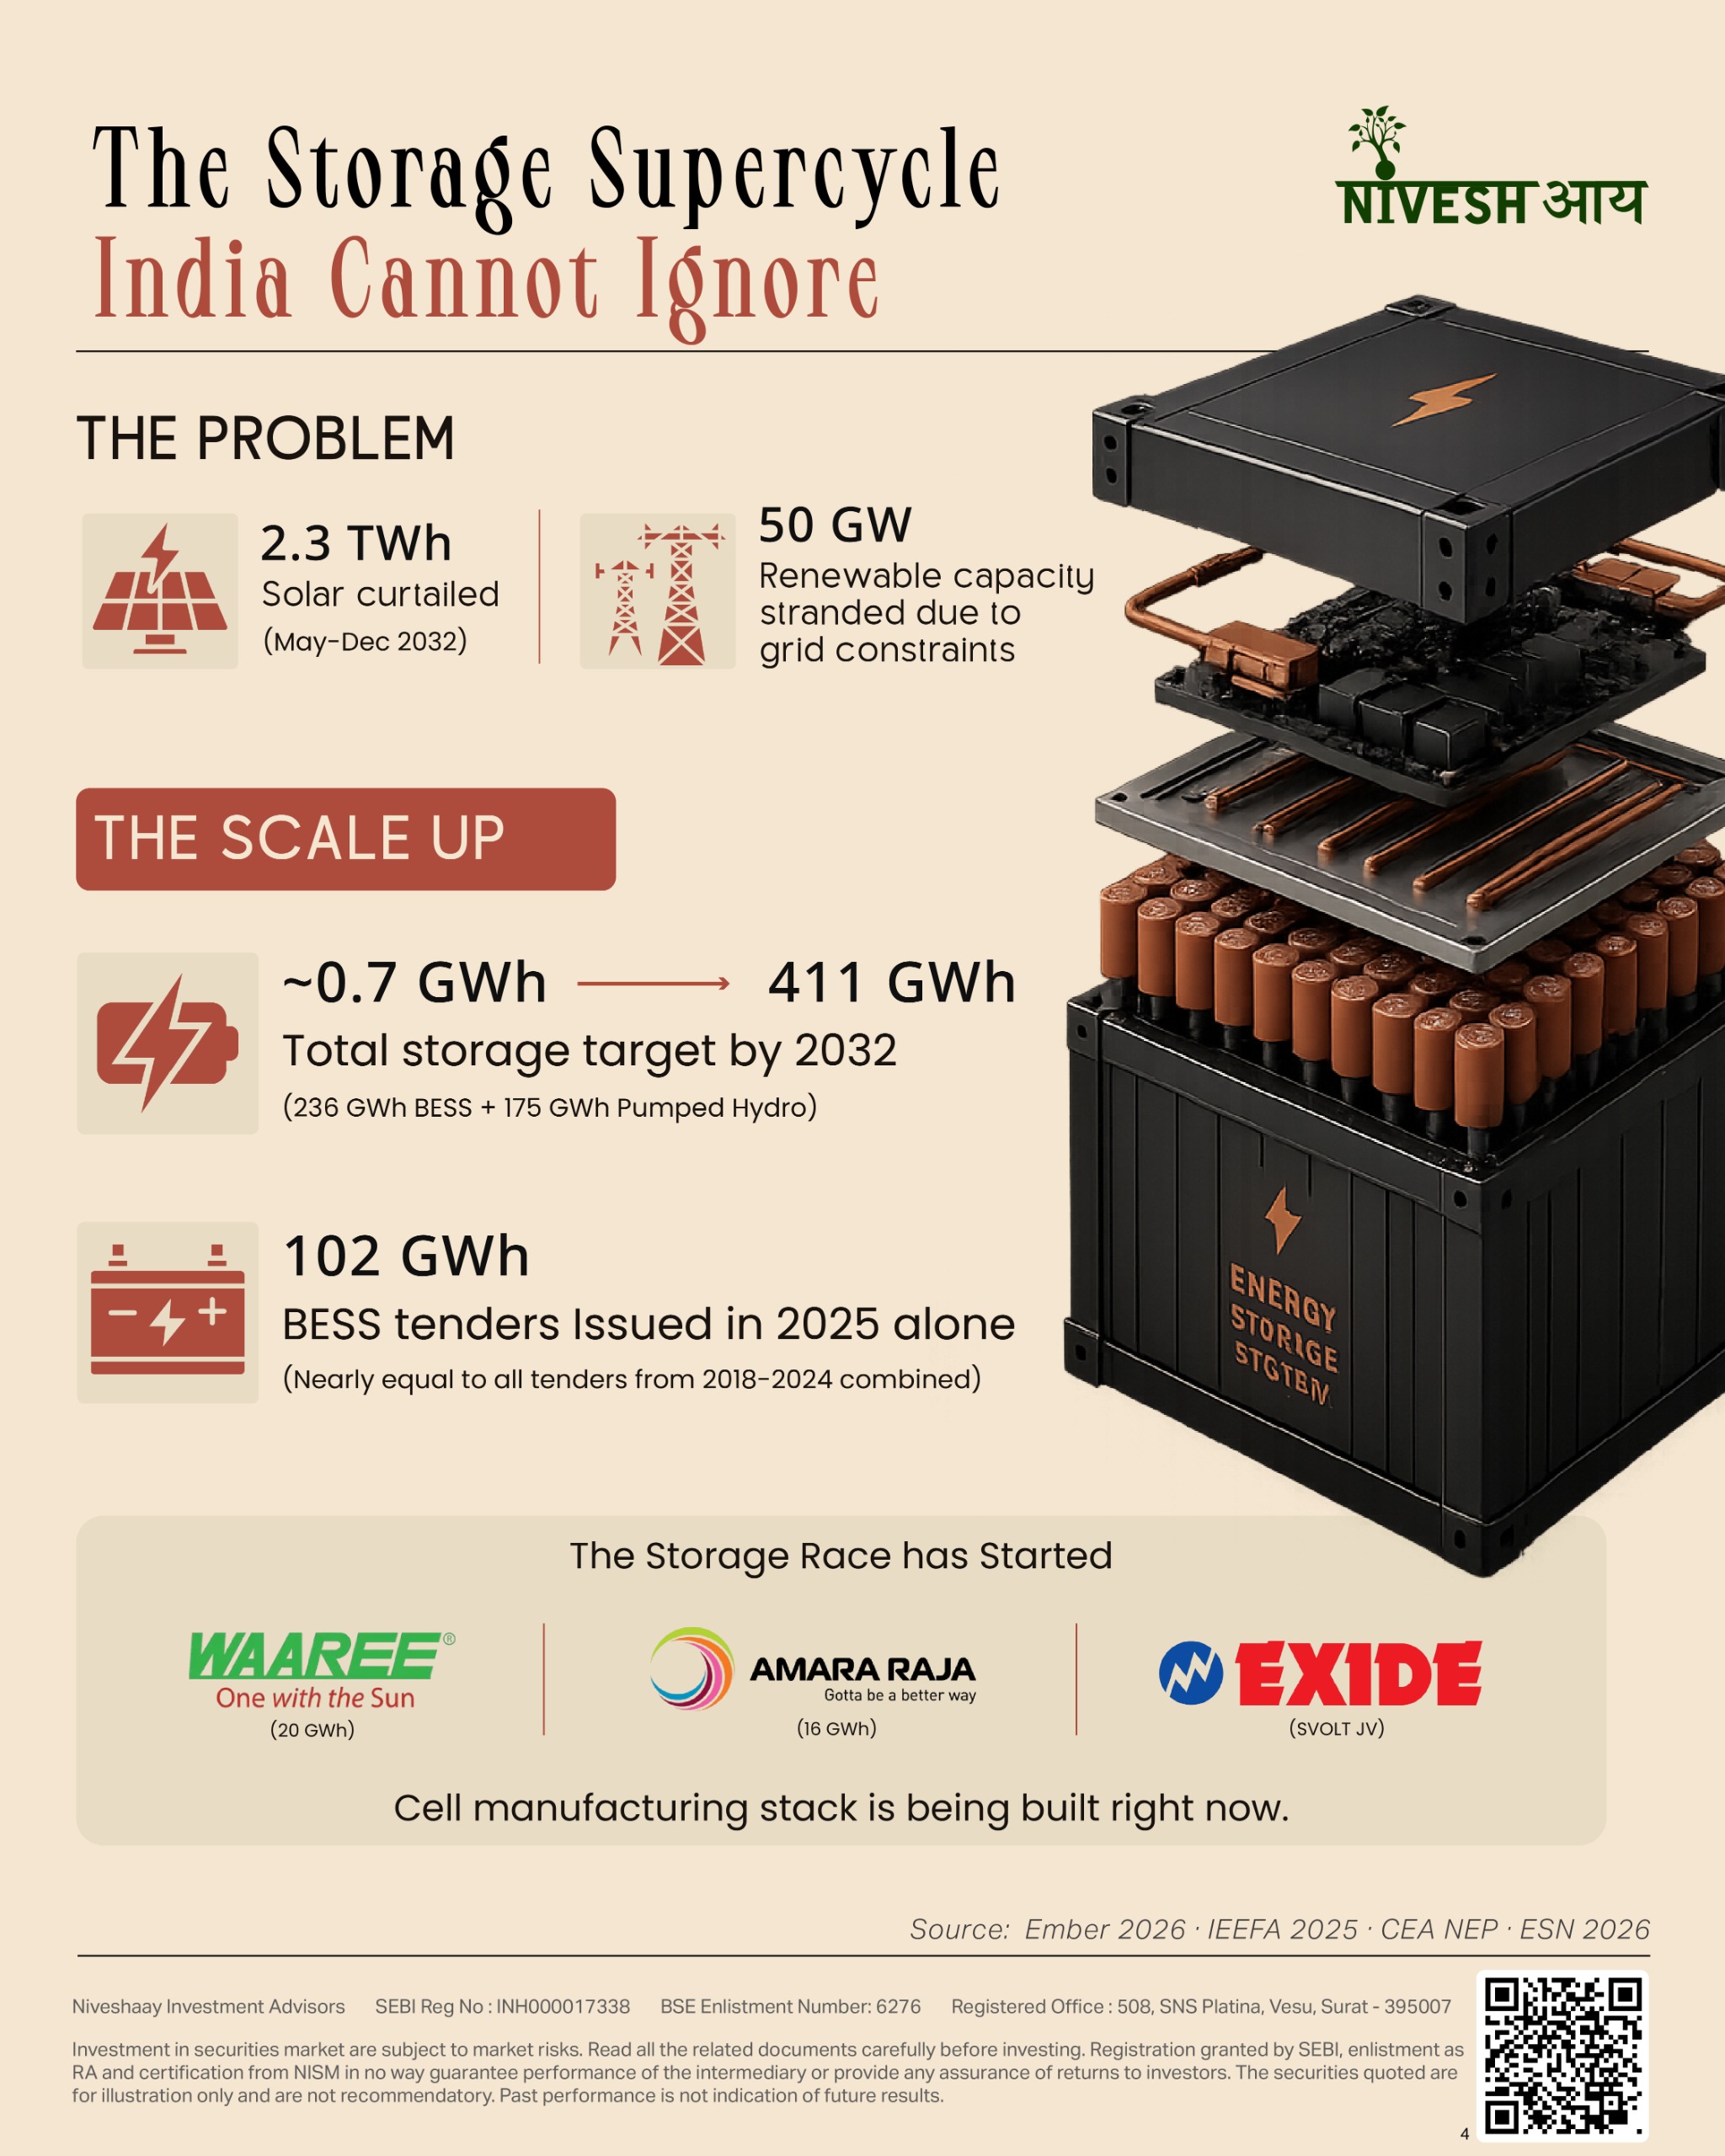
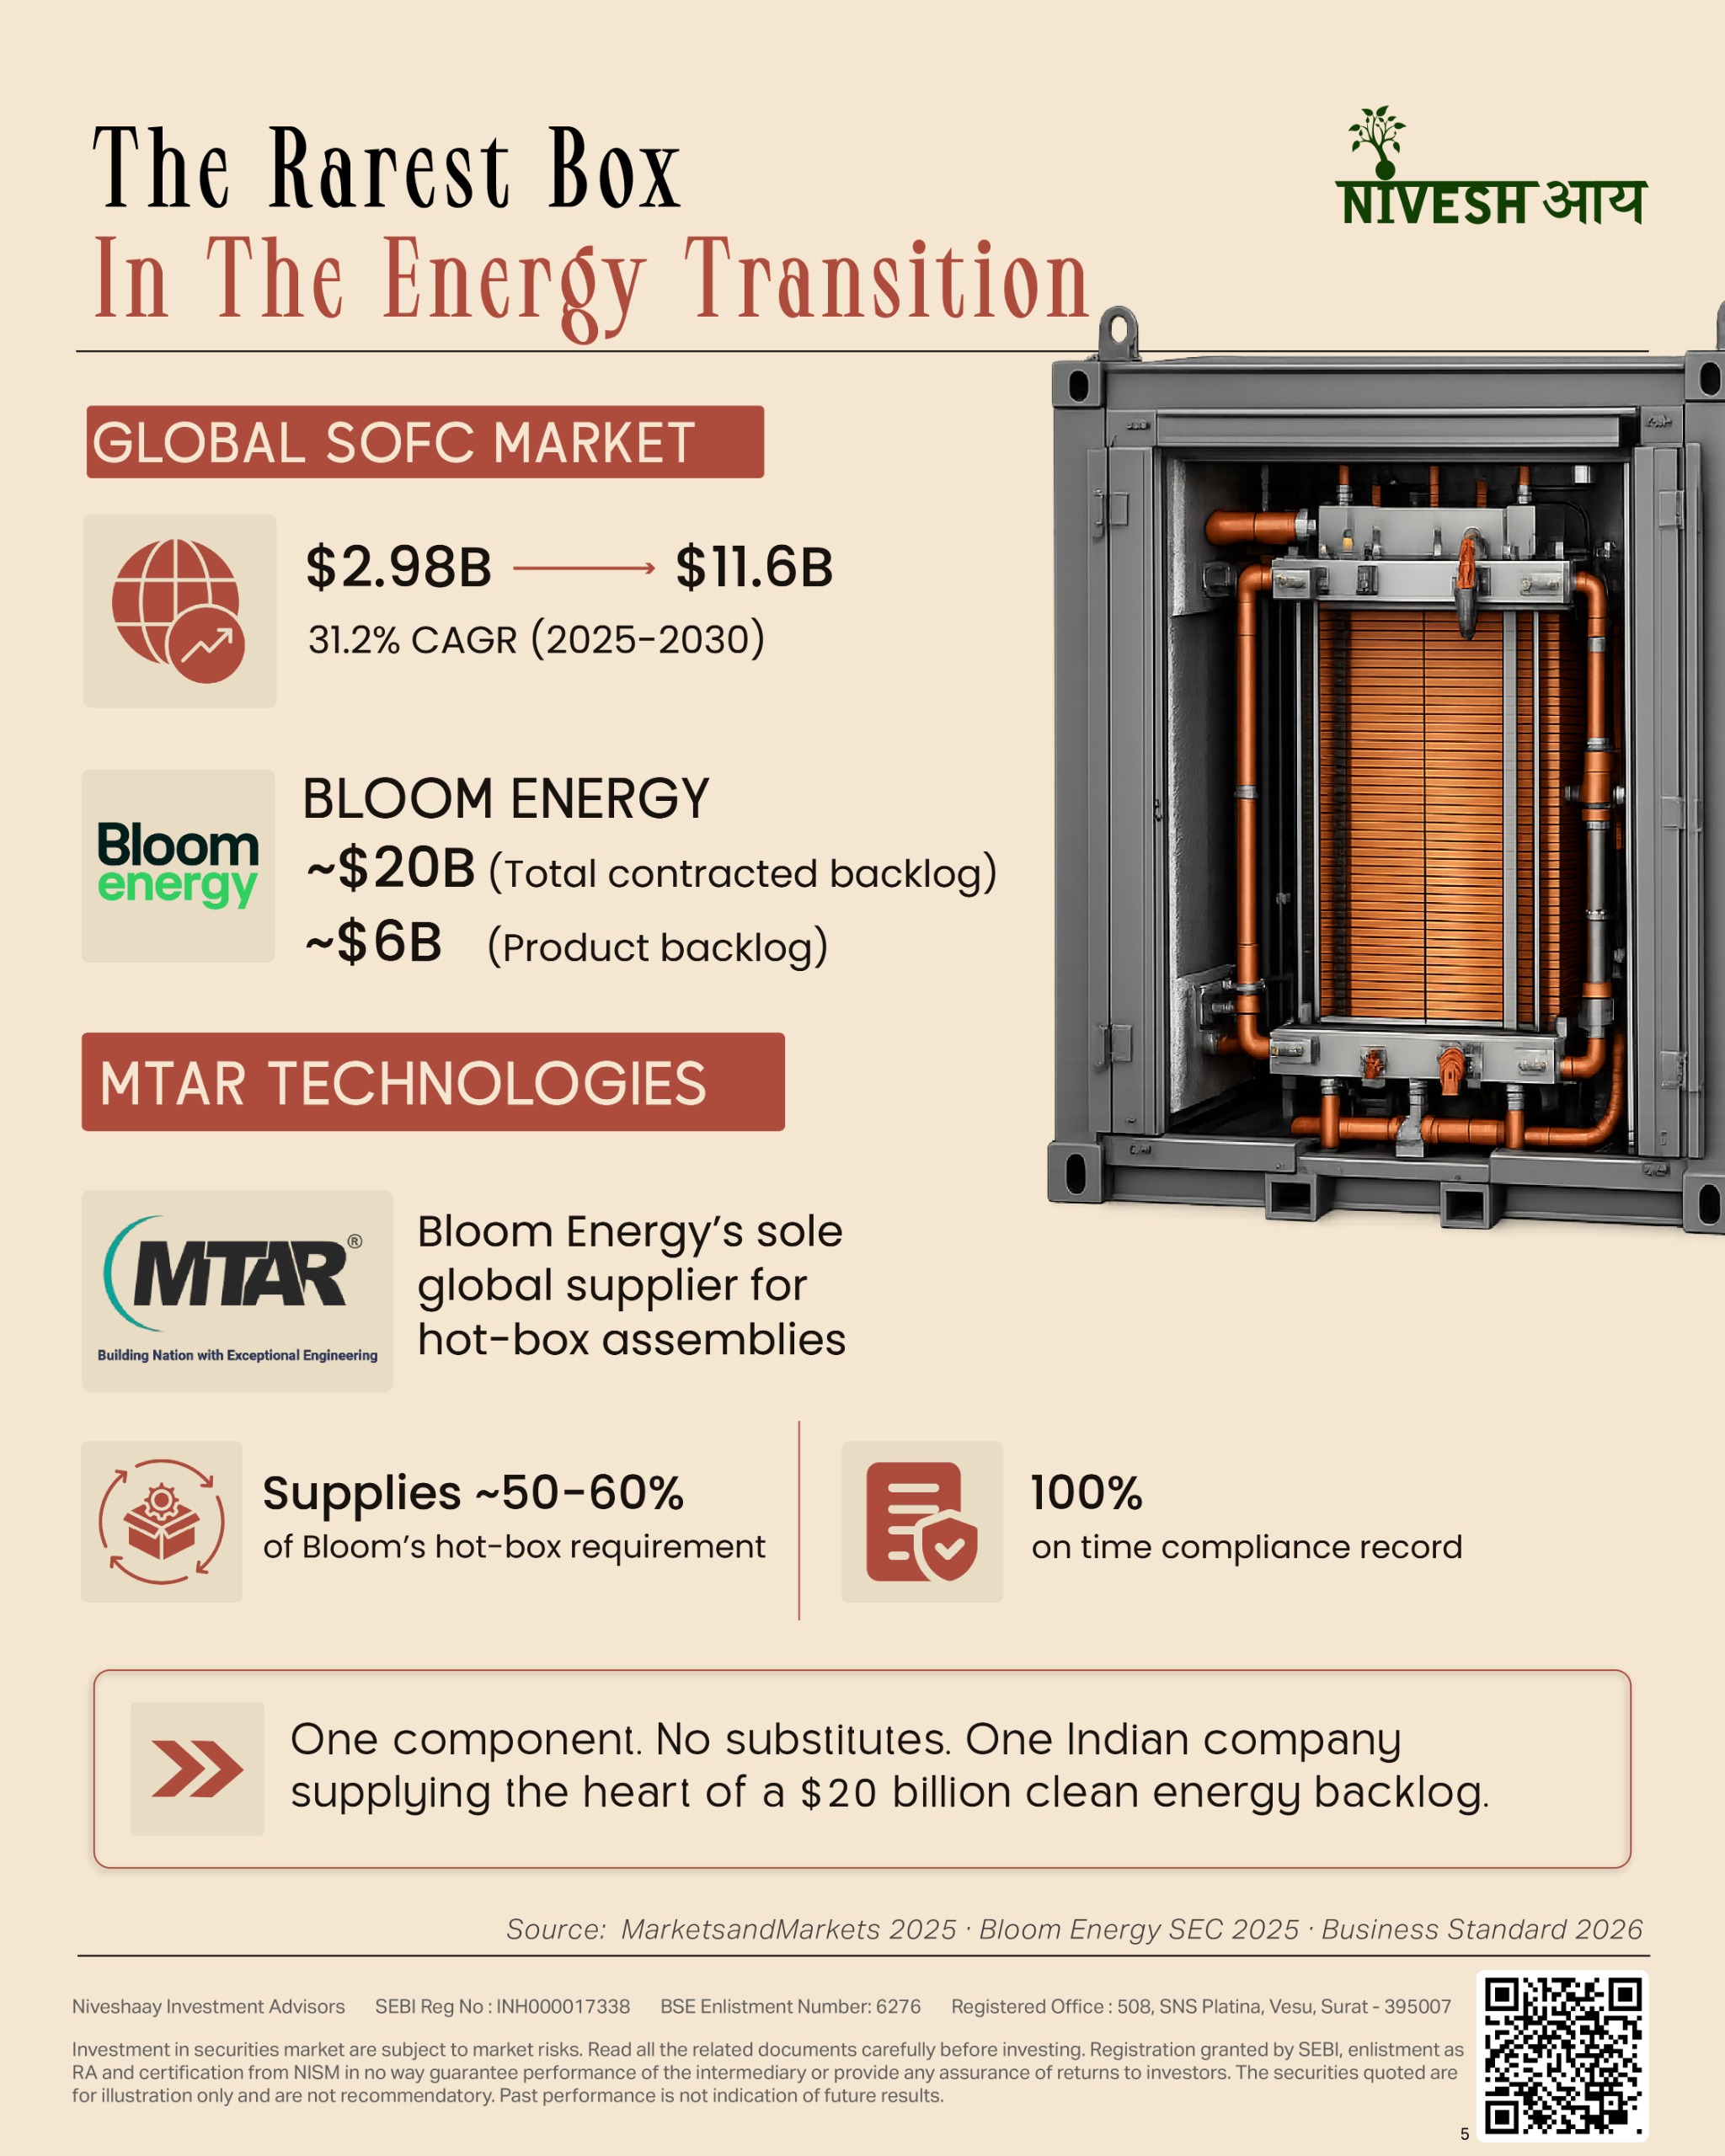
The World Is Building The Largest Energy Infrastructure In History. India Is Inside Every Layer Of It.
The world cracked solar. The infrastructure that makes it useful? That’s the real story.
Transformers – Every solar farm needs one. The wait is 128 weeks. GE Vernova, Siemens Energy – fully booked until 2029. India’s window is open.
Insulators – You can’t buy a shortcut to 800kV certification. It takes decades. India earned it quietly – now exporting to 58 countries through players like Olectra and Modern Insulators.
HVDC – India’s richest solar sits 1,500 km from its biggest demand centres. A handful of qualified builders globally. All full. JP Morgan puts India’s opportunity at $14–15 billion over 5–6 years.
Battery Storage – 51.5% of Rajasthan’s peak solar was switched off in August 2025. Not failure – no storage. 102 GWh tendered in 2025 alone. Waaree, Amara Raja, Exide all building simultaneously.
Fuel Cell Hotbox – Bloom Energy. $20 billion backlog. MTAR Technologies supplies 50–60% of its most critical component. 14 years to earn. No alternative external supplier.
Five markets. Five shortages. India inside all of them- and most haven’t priced that in yet.
Check out our full breakdown of India’s energy supply chain opportunity: https://shorturl.at/jriOx
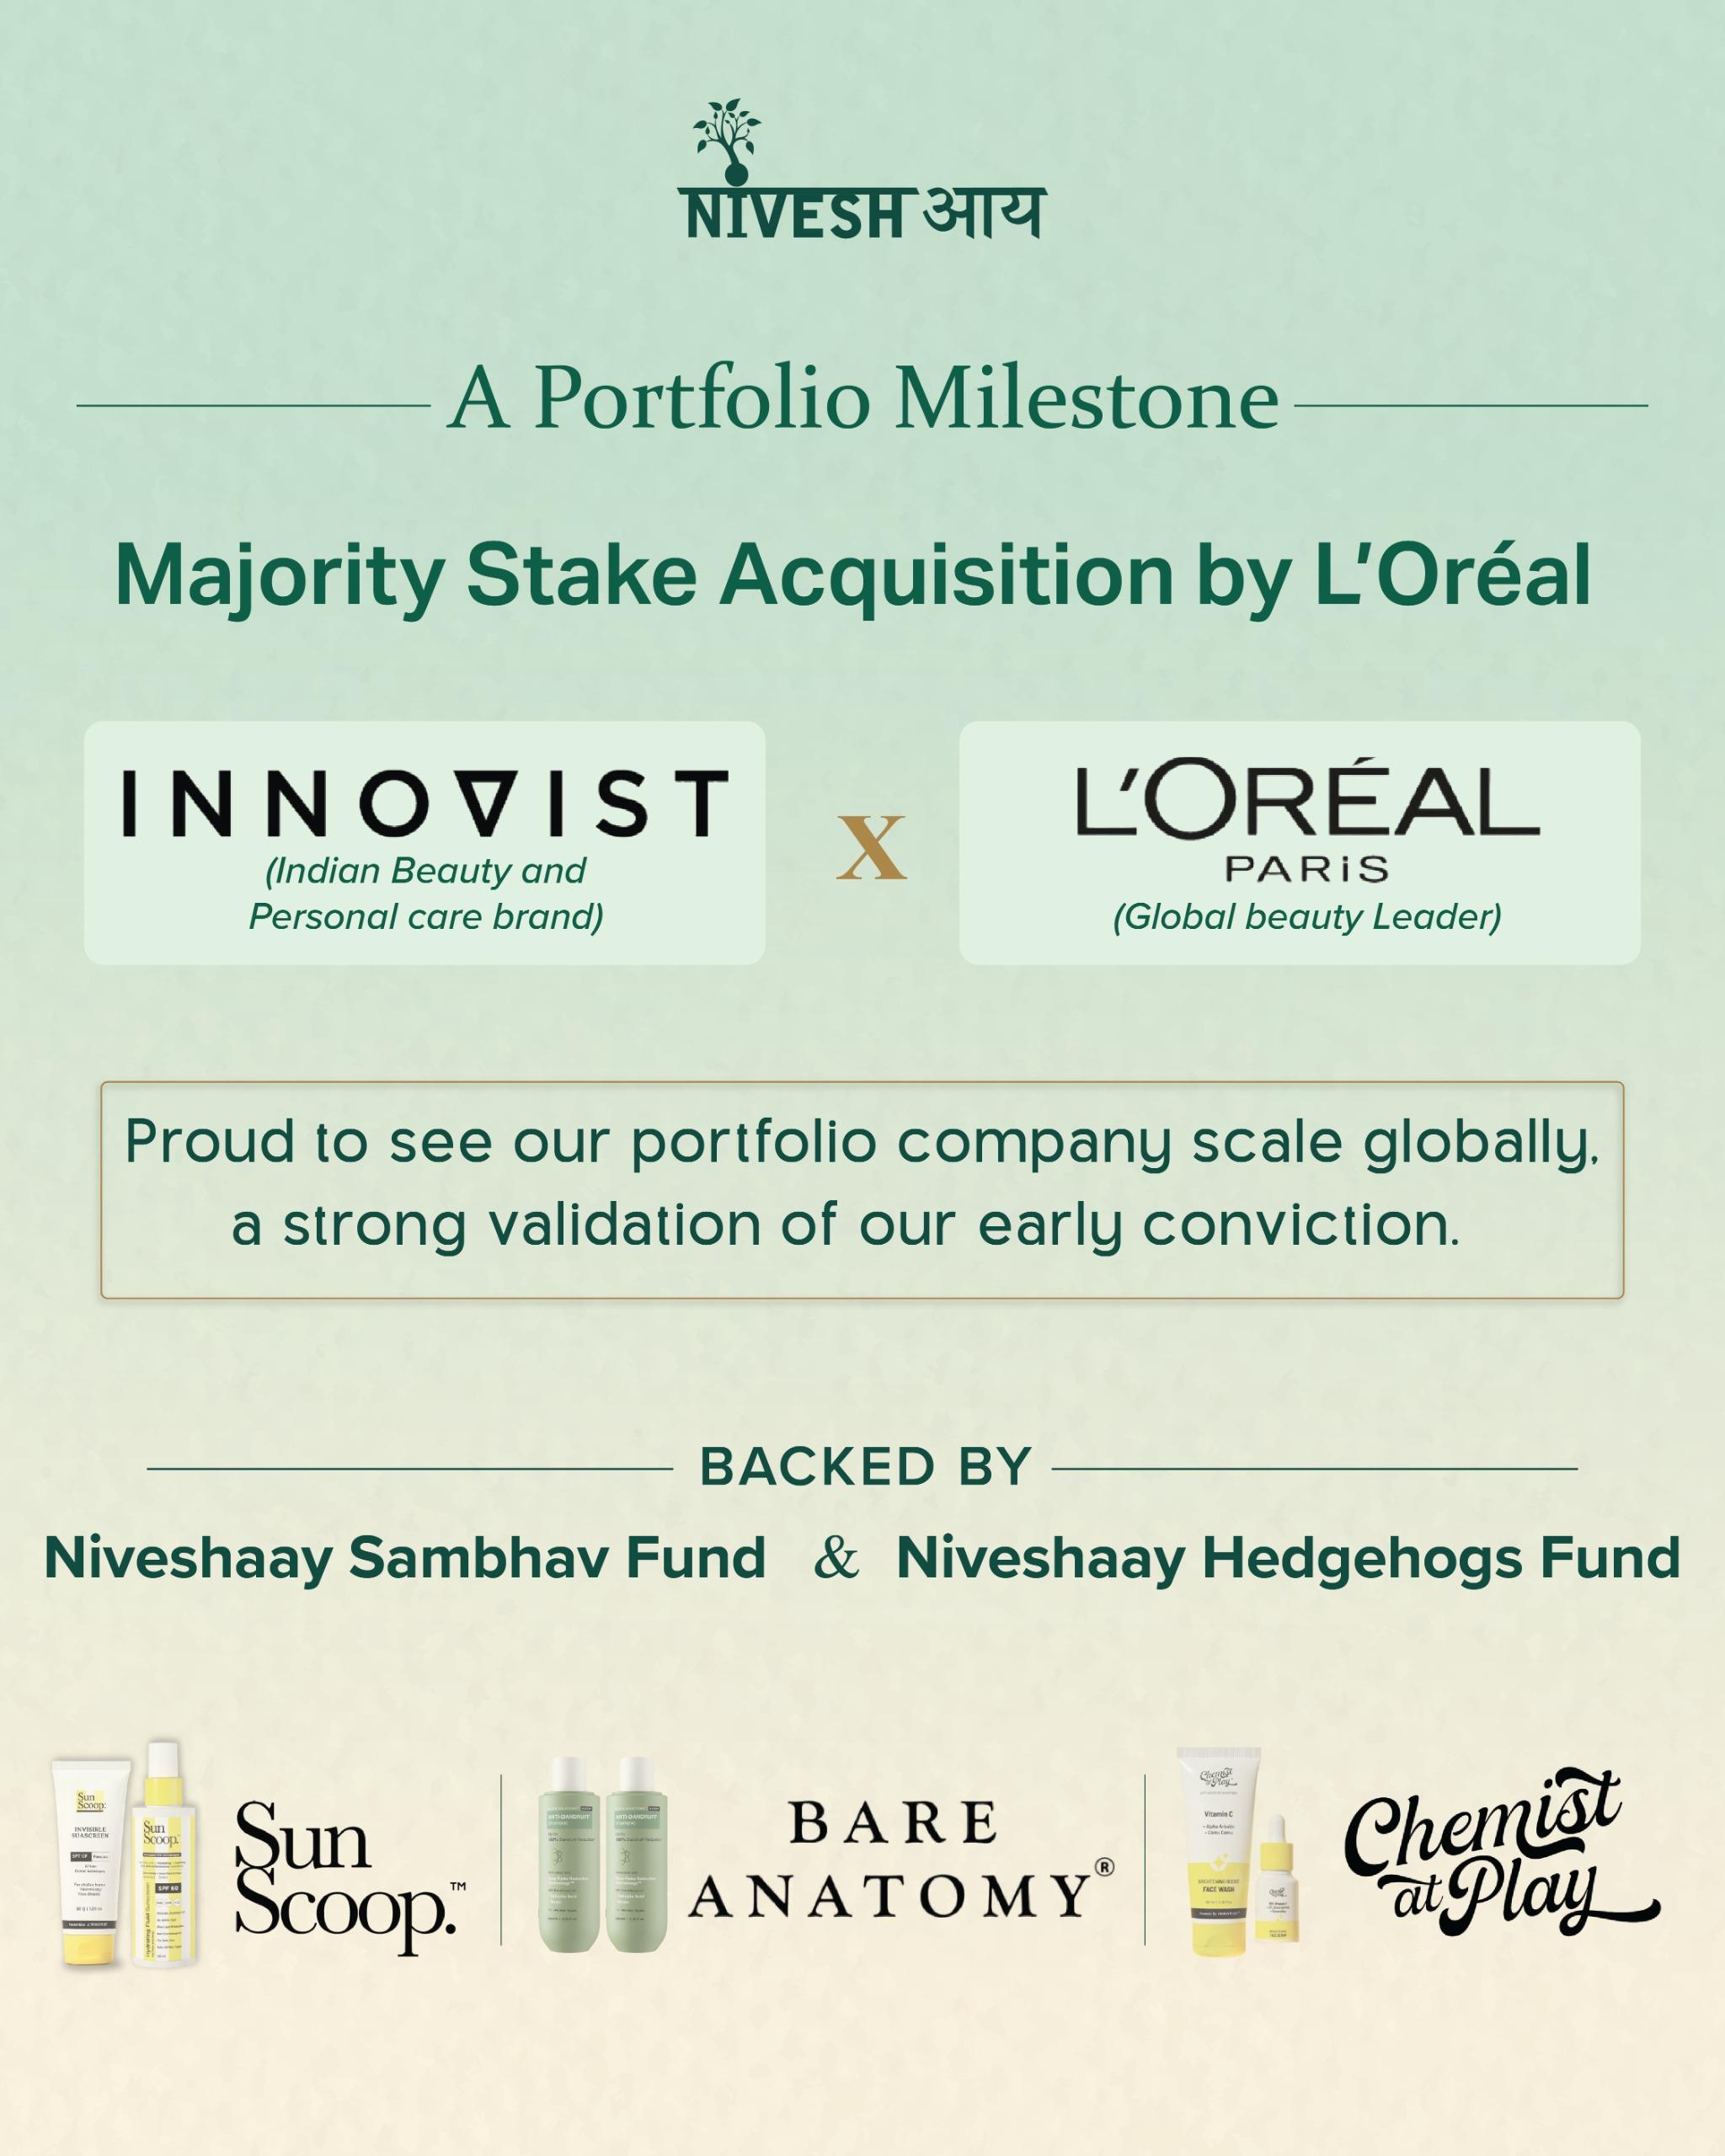
Consumer Durables, Services & Consumption
Niveshaay Portfolio Milestone: L’Oréal x Innovist
Niveshaay early bet Innovist pays off as L'Oréal acquires a majority stake, marking a proud portfolio milestone for Indian beauty brands.
We at Niveshaay are incredibly proud to celebrate a milestone for one of our portfolio companies: L’Oréal, a global beauty leader is acquiring Innovist (the powerhouse behind Sun Scoop, Bare Anatomy, and Chemist at Play).
This marks a significant moment for the Indian beauty and personal care landscape. Having backed Innovist early through both our Niveshaay Hedgehogs Fund and Niveshaay Sambhav Fund, seeing them scale is a strong validation of our conviction.
From day one, the team’s focus on execution, clean formulations, R&D, and deep consumer resonance stood out. They built highly trusted, category-defining brands that captured the market’s attention.
To see an Indian consumer brand transition to the global stage under the stewardship of a giant like L’Oréal is exactly the kind of value creation we strive to support.
Huge congratulations to the entire team at Innovist. We are excited to see the brand reach new heights globally in this next chapter.

Electric Vehicle & Ancillaries
AI Energy Demand: Why Green Energy Is the Only Answer
AI queries use 10× the power of a web search. Discover how surging AI energy demand is reshaping solar investment in India.

One AI query uses roughly 10× the electricity of a normal web search. Multiply that across trillions of daily interactions and you have a new kind of infrastructure crisis, one that solar is the only technology fast enough to solve.
Goldman Sachs published a landmark report in May 2026 that most people likely scrolled past.
AI token usage will multiply 24 times by 2030.
Every token is a compute job. Every compute job burns electricity.
At 24× scale, this stop being just a tech story. It becomes an energy story.
The numbers are more dramatic than most people realise.
One AI query uses approximately 2.9 watt-hours of electricity. A standard Google search uses 0.3 watt-hours, the same task, at roughly one-tenth the power consumption.
Now apply a 24× scale-up in AI usage by 2030.
Even if AI models become more efficient per token over time, the sheer volume overwhelms those efficiency gains.
At 120 quintillion tokens per month, the grid impact is not abstract, it is structural.
What a Hyperscale Data Centre Actually Needs
A single hyperscale AI campus, the kind Google, Microsoft, and Amazon build, needs 400–500 MW of electricity. That is as much electricity a small city needs.
The cooling load nobody includes in the headline number
AI chips generate heat at densities that air cooling cannot handle.
Modern data centres now pump liquid coolant directly onto chip packages, and the pumps, chillers, and cooling towers that support this system draw their own electricity load on top of the computing load.
Server load (headline): 500 MW
Actual grid draw (with cooling): 600–700 MW, 20% more at best-in-class facilities; 50–100% more at older ones
unlike most industrial loads, this runs continuously, 24 hours a day, 7 days a week.
Here is the bottleneck that most coverage misses entirely.
Building a hyperscale campus takes approximately 18 months. Connecting it to the electricity network takes 5–7 years.
A single large transformer takes over 36 months to procure. New substations must be built from scratch.
The consequence?
The US power connection queue has grown from roughly 900 GW in 2019 to over 2,600 GW today, more than the entire installed US generation base.
Virginia, which hosts approximately 25% of global hyperscale capacity, has effectively run out of available electricity.
No new large campus power connections are being granted there.
When the world’s biggest technology companies encountered this wall, they did not wait for governments to solve it. They began securing their own electricity supply directly:
These are not climate decisions. They are infrastructure emergencies.
And here is why solar became the default answer for most data centres:
Solar farm, built and running: 18–24 months
Nuclear plant: 15–20 years
Gas plant: 5–7 years, plus fuel cost forever
Solar moves at AI speed. Nothing else does.
The United States built its data centre infrastructure on coal and gas networks. It is now retrofitting renewables into a legacy system, expensive, slow, and constrained by decades of fixed connections.
India’s data centre base currently stands at approximately 1.4 GW, small enough that the entire sector can still be designed from scratch, with solar and battery storage at the foundation rather than bolted on afterwards.
FY24: ~1.4 GW
FY30P: ~9 GW, a 6× increase in six years
₹3.95 lakh crore in confirmed investment from Microsoft, Google, and AWS was announced in FY25–26 alone.
The window to build this infrastructure cleanly and cost-efficiently is open right now.
In most other markets, it has already closed.
Once campuses are built on a power connection, changing that connection takes years. India is still making those foundational choices.
India’s data centre build is a$50B+ infrastructure programme happening in one of the world’s cheapest renewable electricity markets.
Four investment layers compound here:
(1) Renewable IPPs and BESS manufacturers serving data centre campuses, each GW of data centre capacity needs 1.2–1.5 GW of dedicated power when cooling is included;
(2) Power infrastructure equipment makers – Transformers, switchgear, and substation builders are embedded in every campus project;
(3) Liquid cooling technology companies – As chip density rises, air cooling becomes unworkable and liquid cooling becomes the standard;
(4) Data centre developers themselves – Where revenue per MW is rising as power availability, not land or labour, becomes the primary differentiator.
The question is not whether AI drives electricity demand. Goldman Sachs has answered that. The question is which part of the Indian electricity value chain captures the margin.
AI is no longer just a software story. It is an electricity story. Every query is an electricity transaction. Solar, the fastest source to build, is the only one keeping up with AI’s growth rate.
India is the only major economy where the data centre buildout and the renewable buildout are happening simultaneously. That sequencing is a structural advantage that cannot be replicated later.
→ AI created explosive electricity demand. Solar is the fastest answer. But deploying solar at this speed has created a supply chain constraint that most investors have never heard of. That is the subject of the next blog.
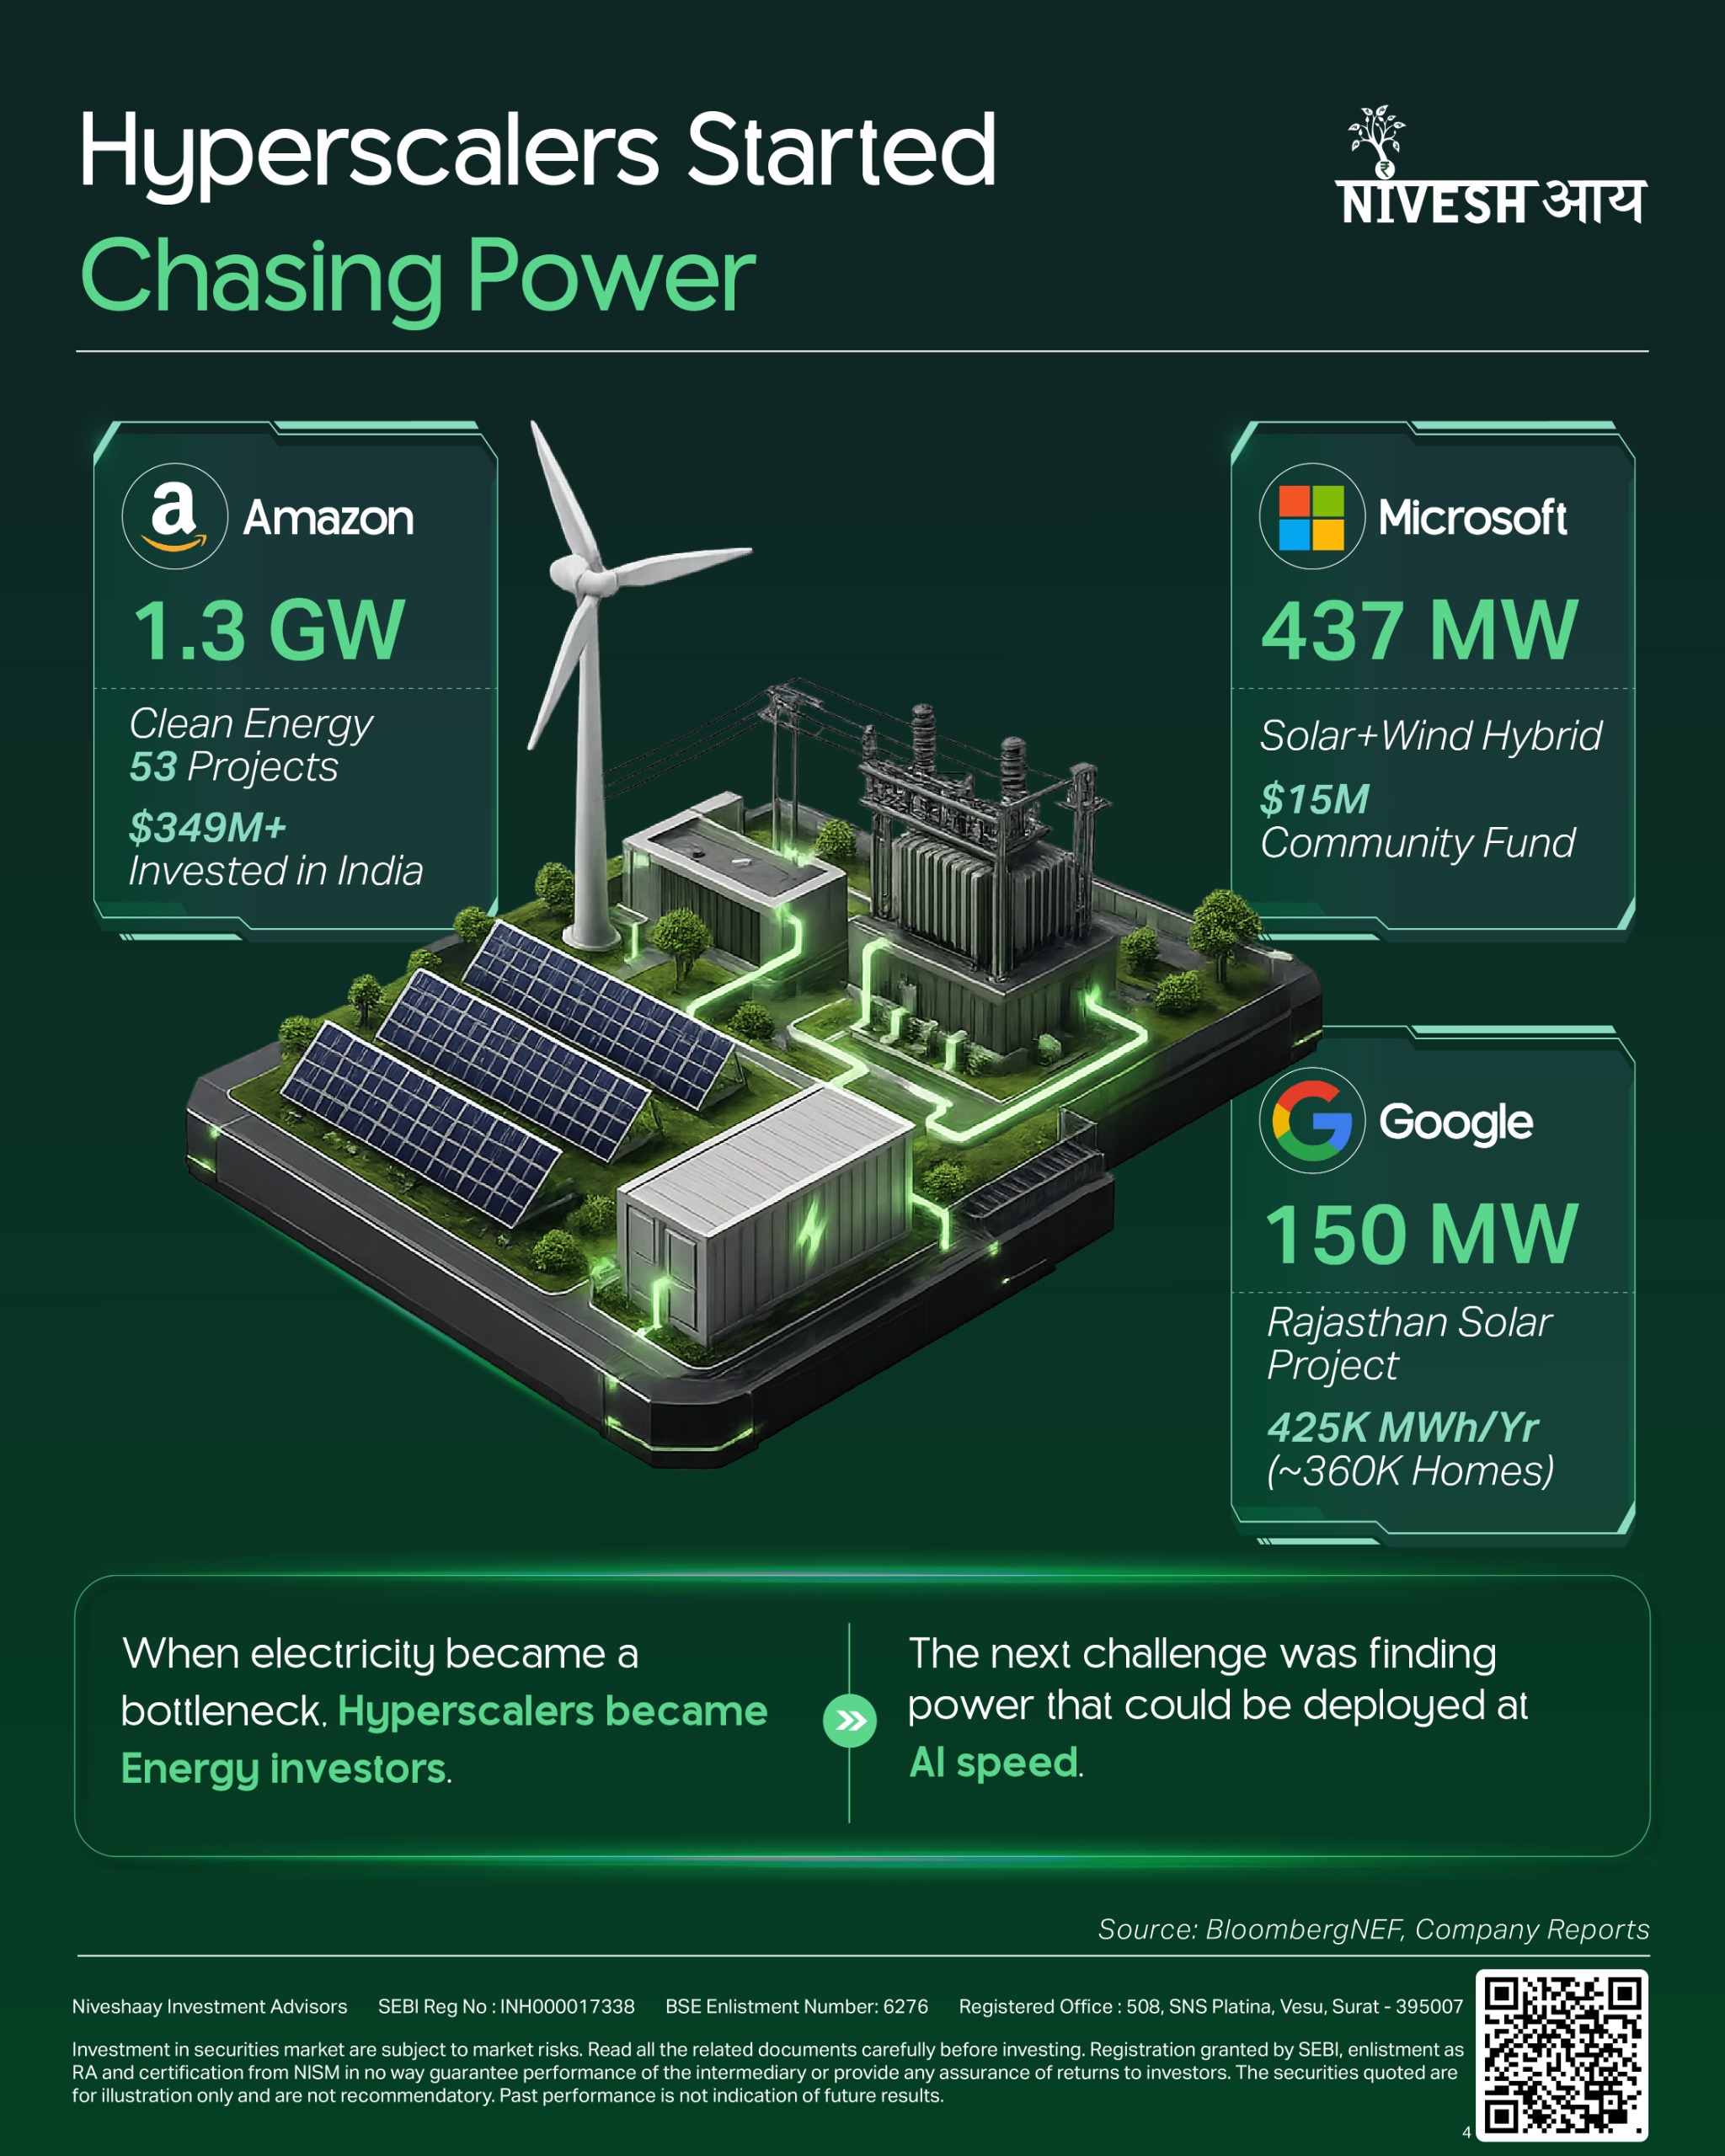
AI & Data Center
Green Energy 2.0 – The Power Behind the AI Race
AI queries use 10× the power of a web search. Discover how surging AI energy demand is reshaping solar investment in India.
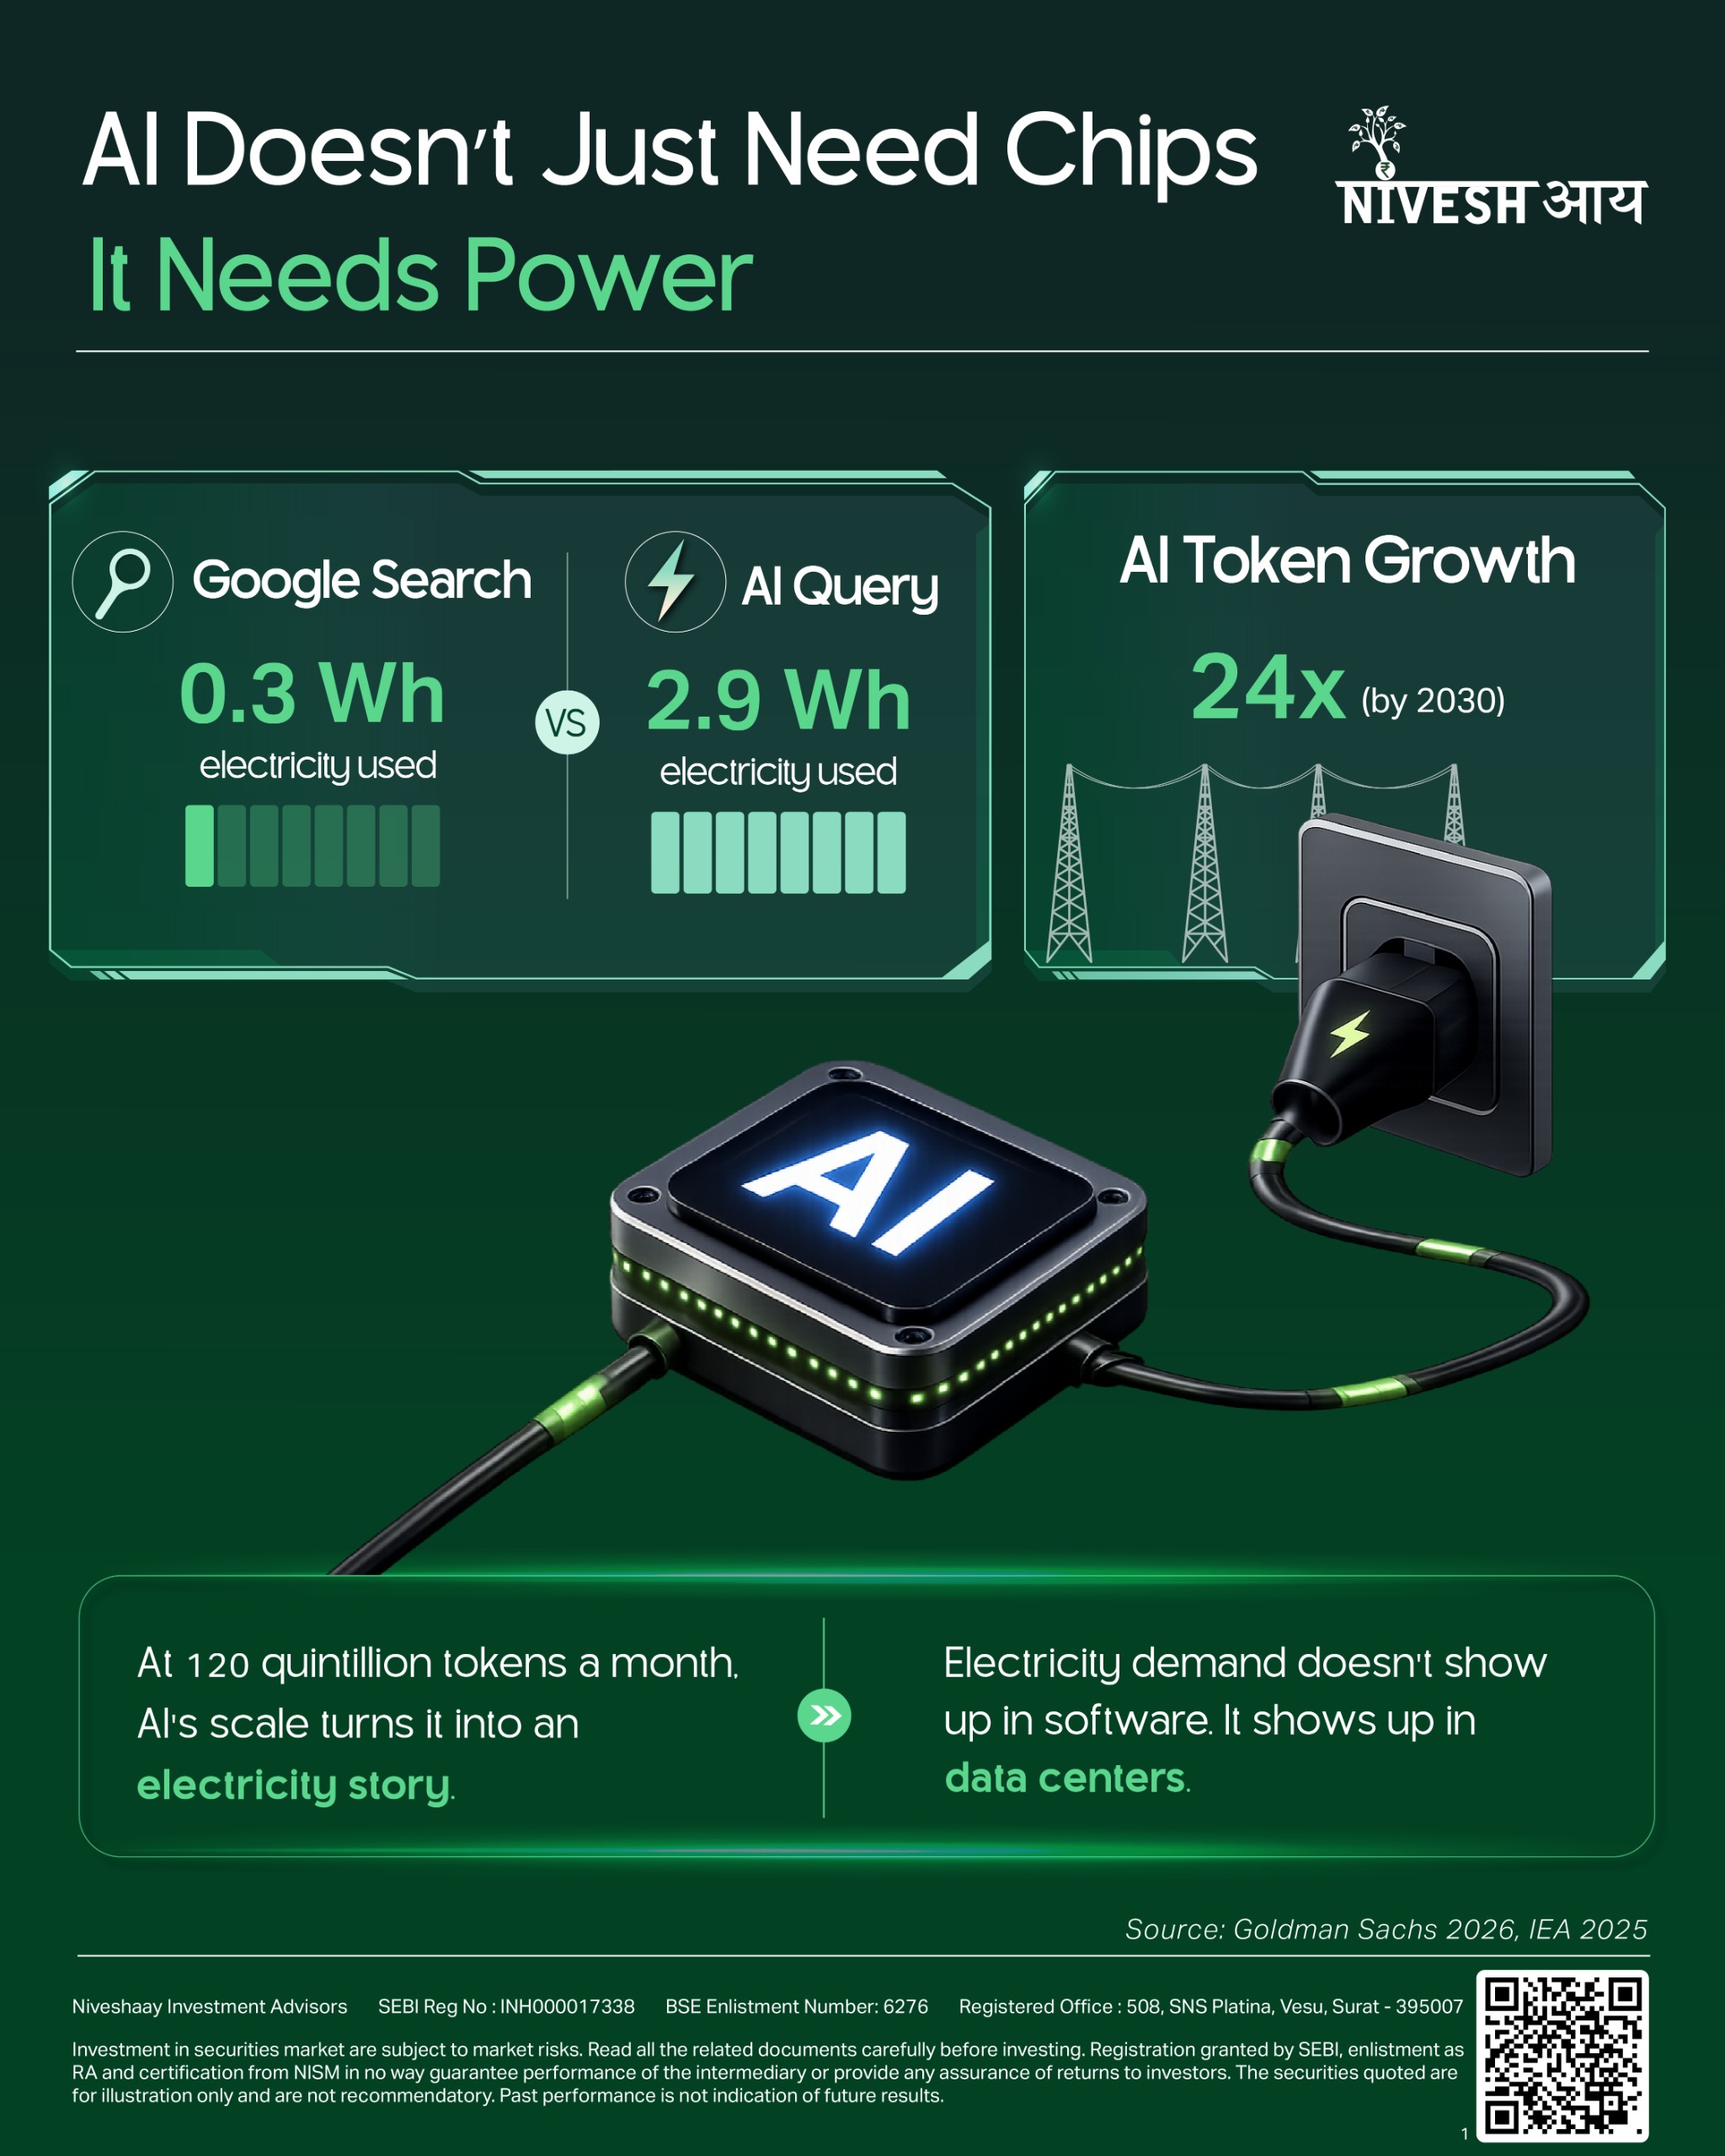
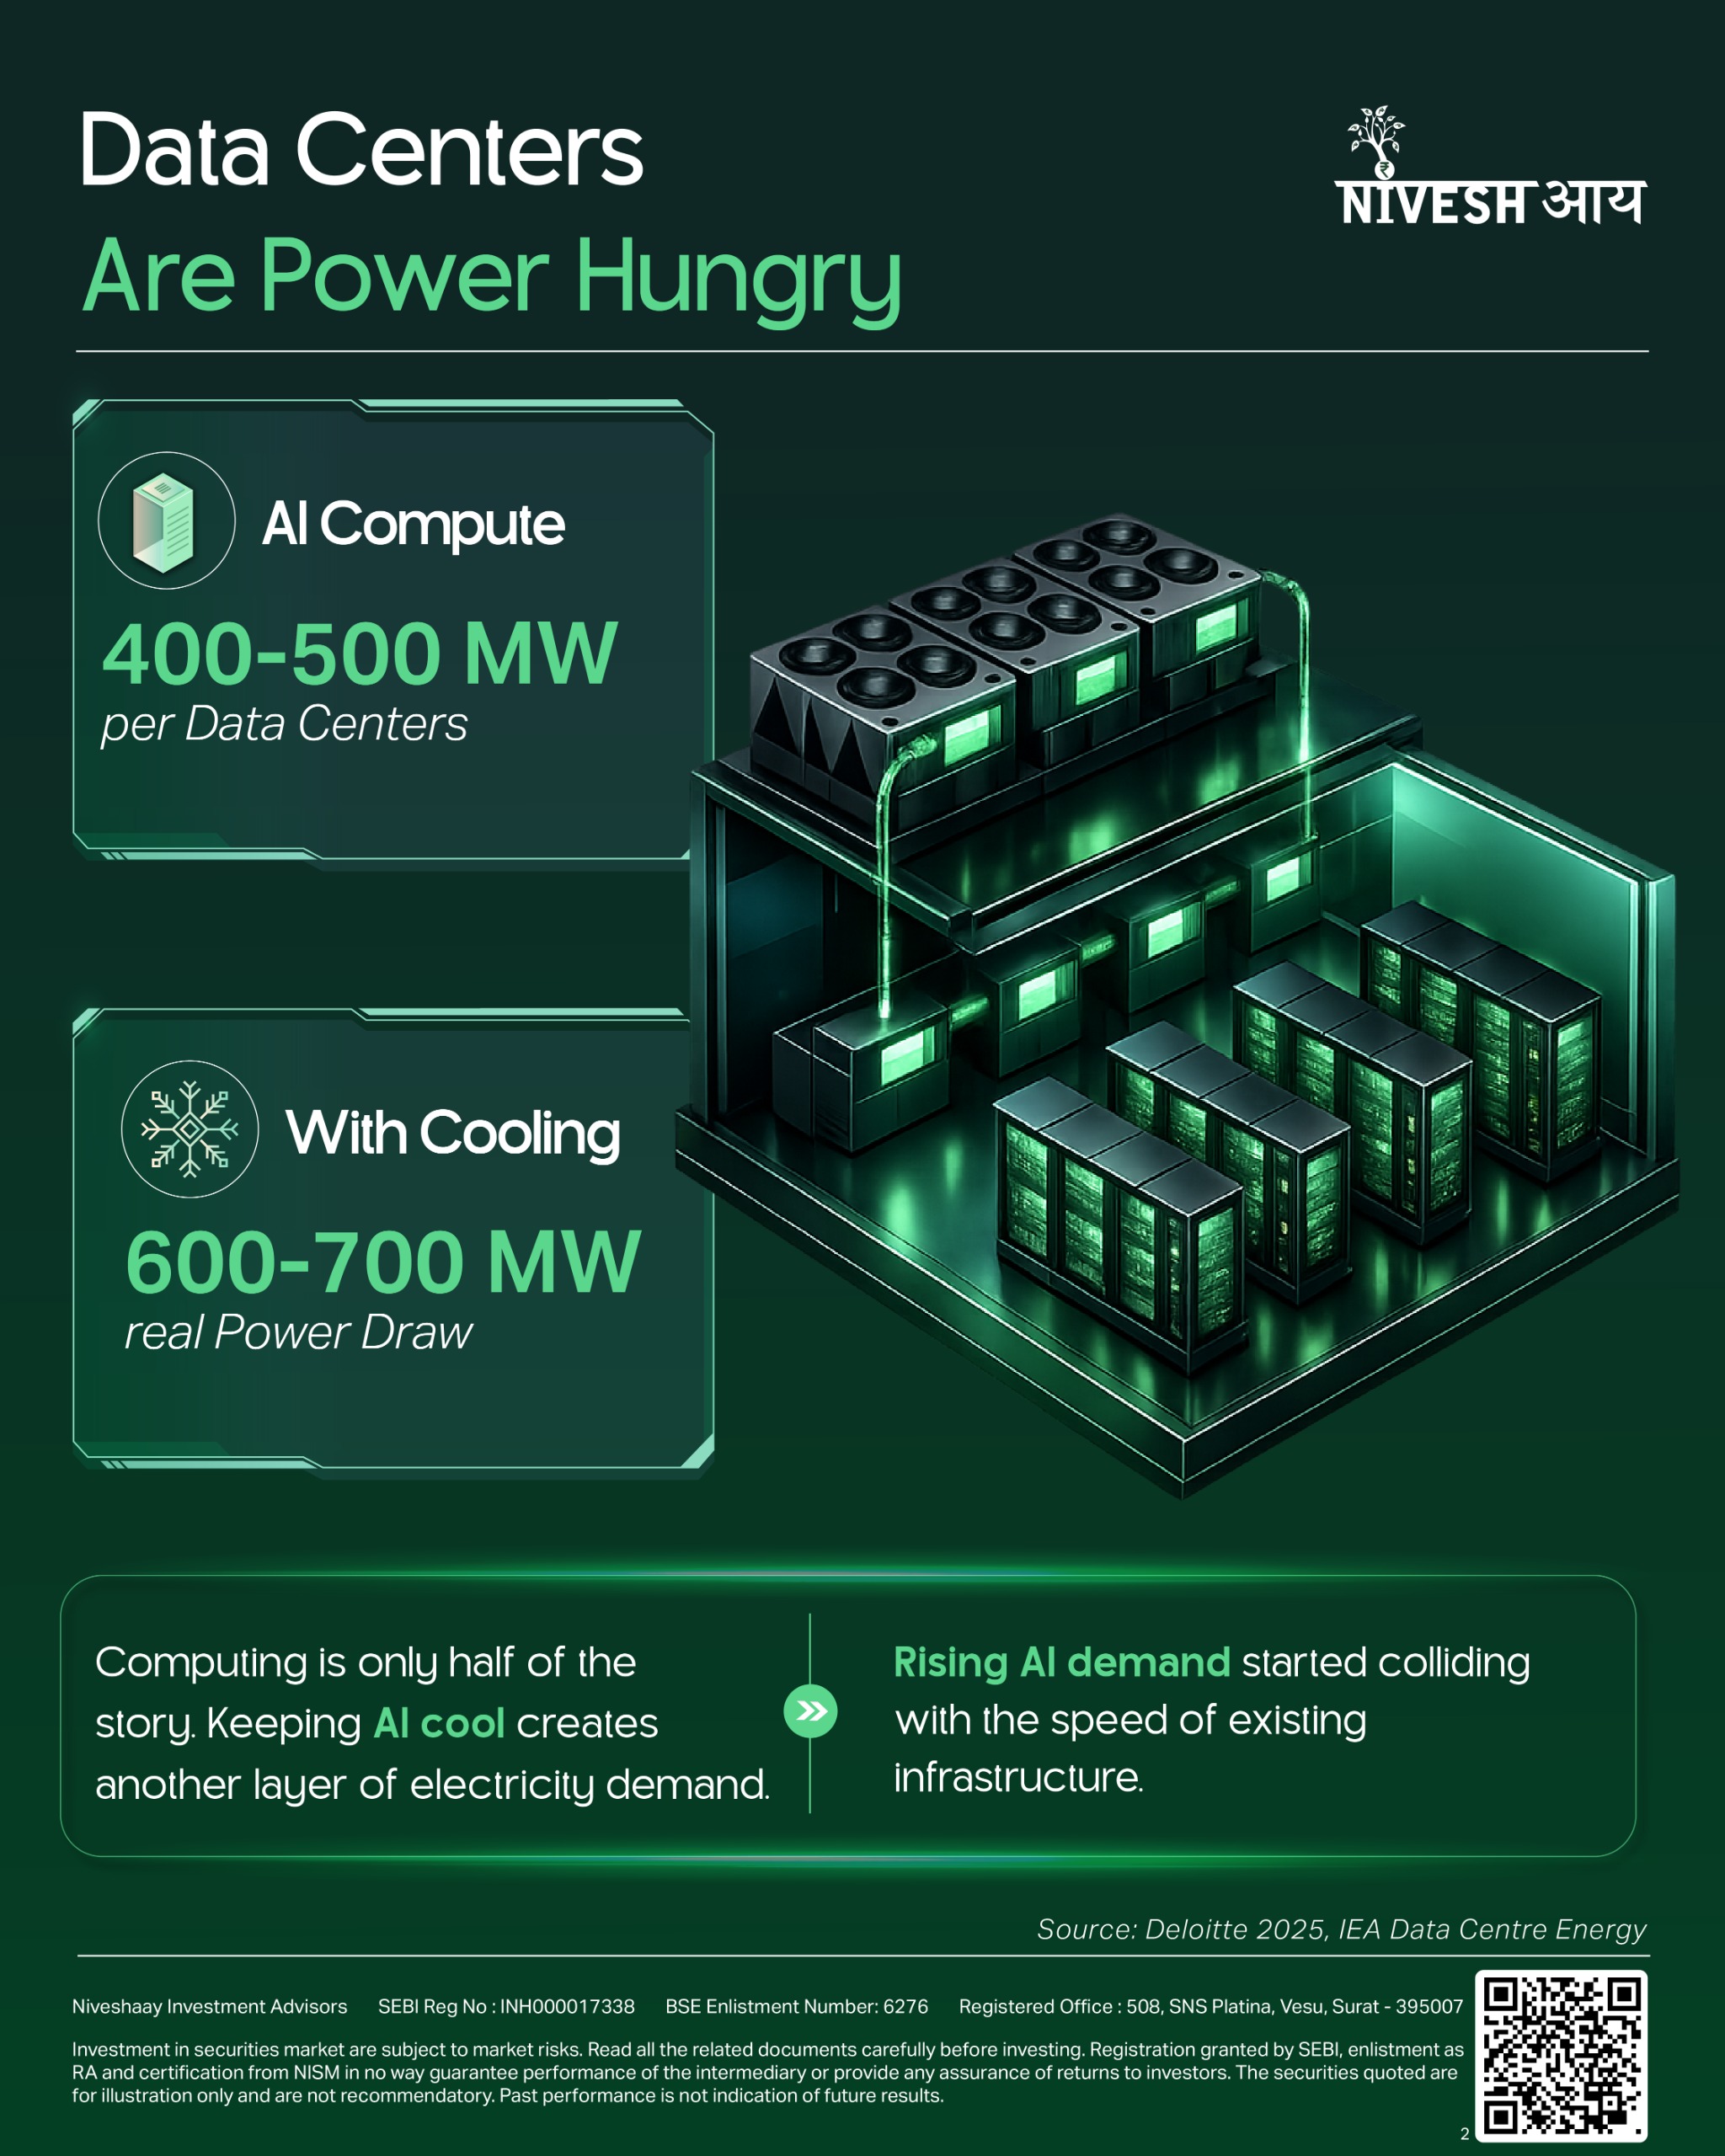
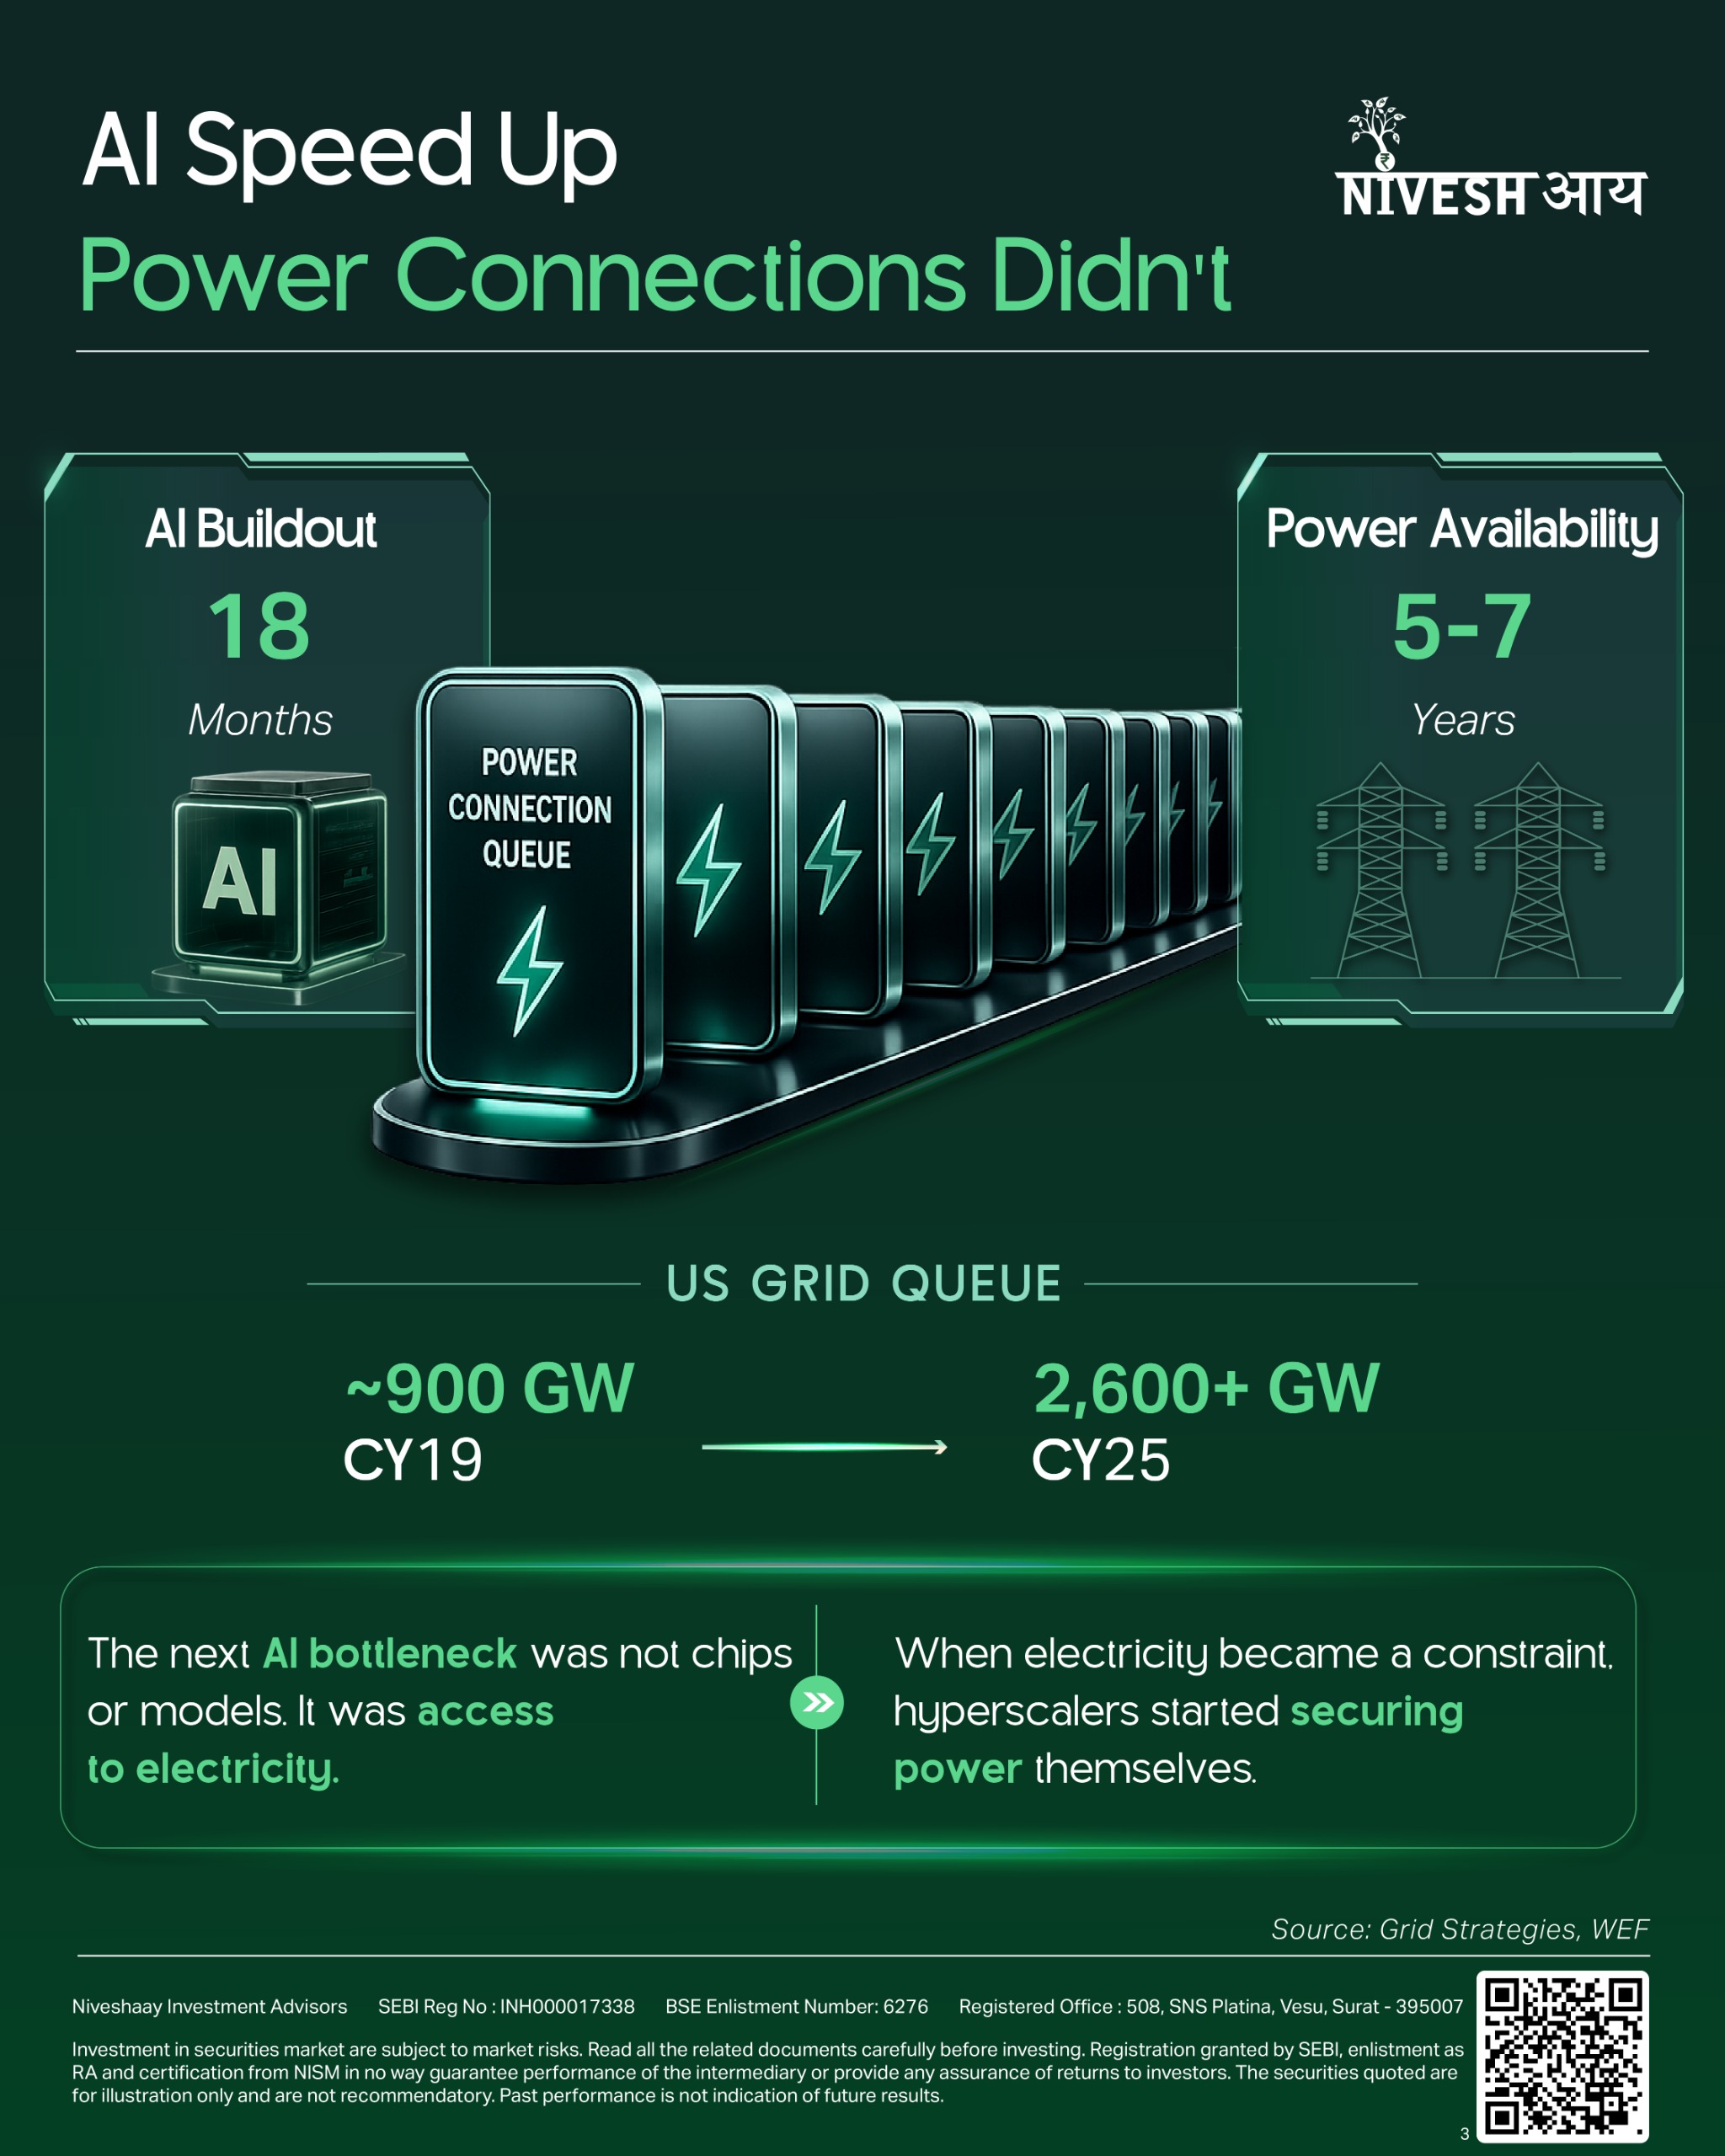
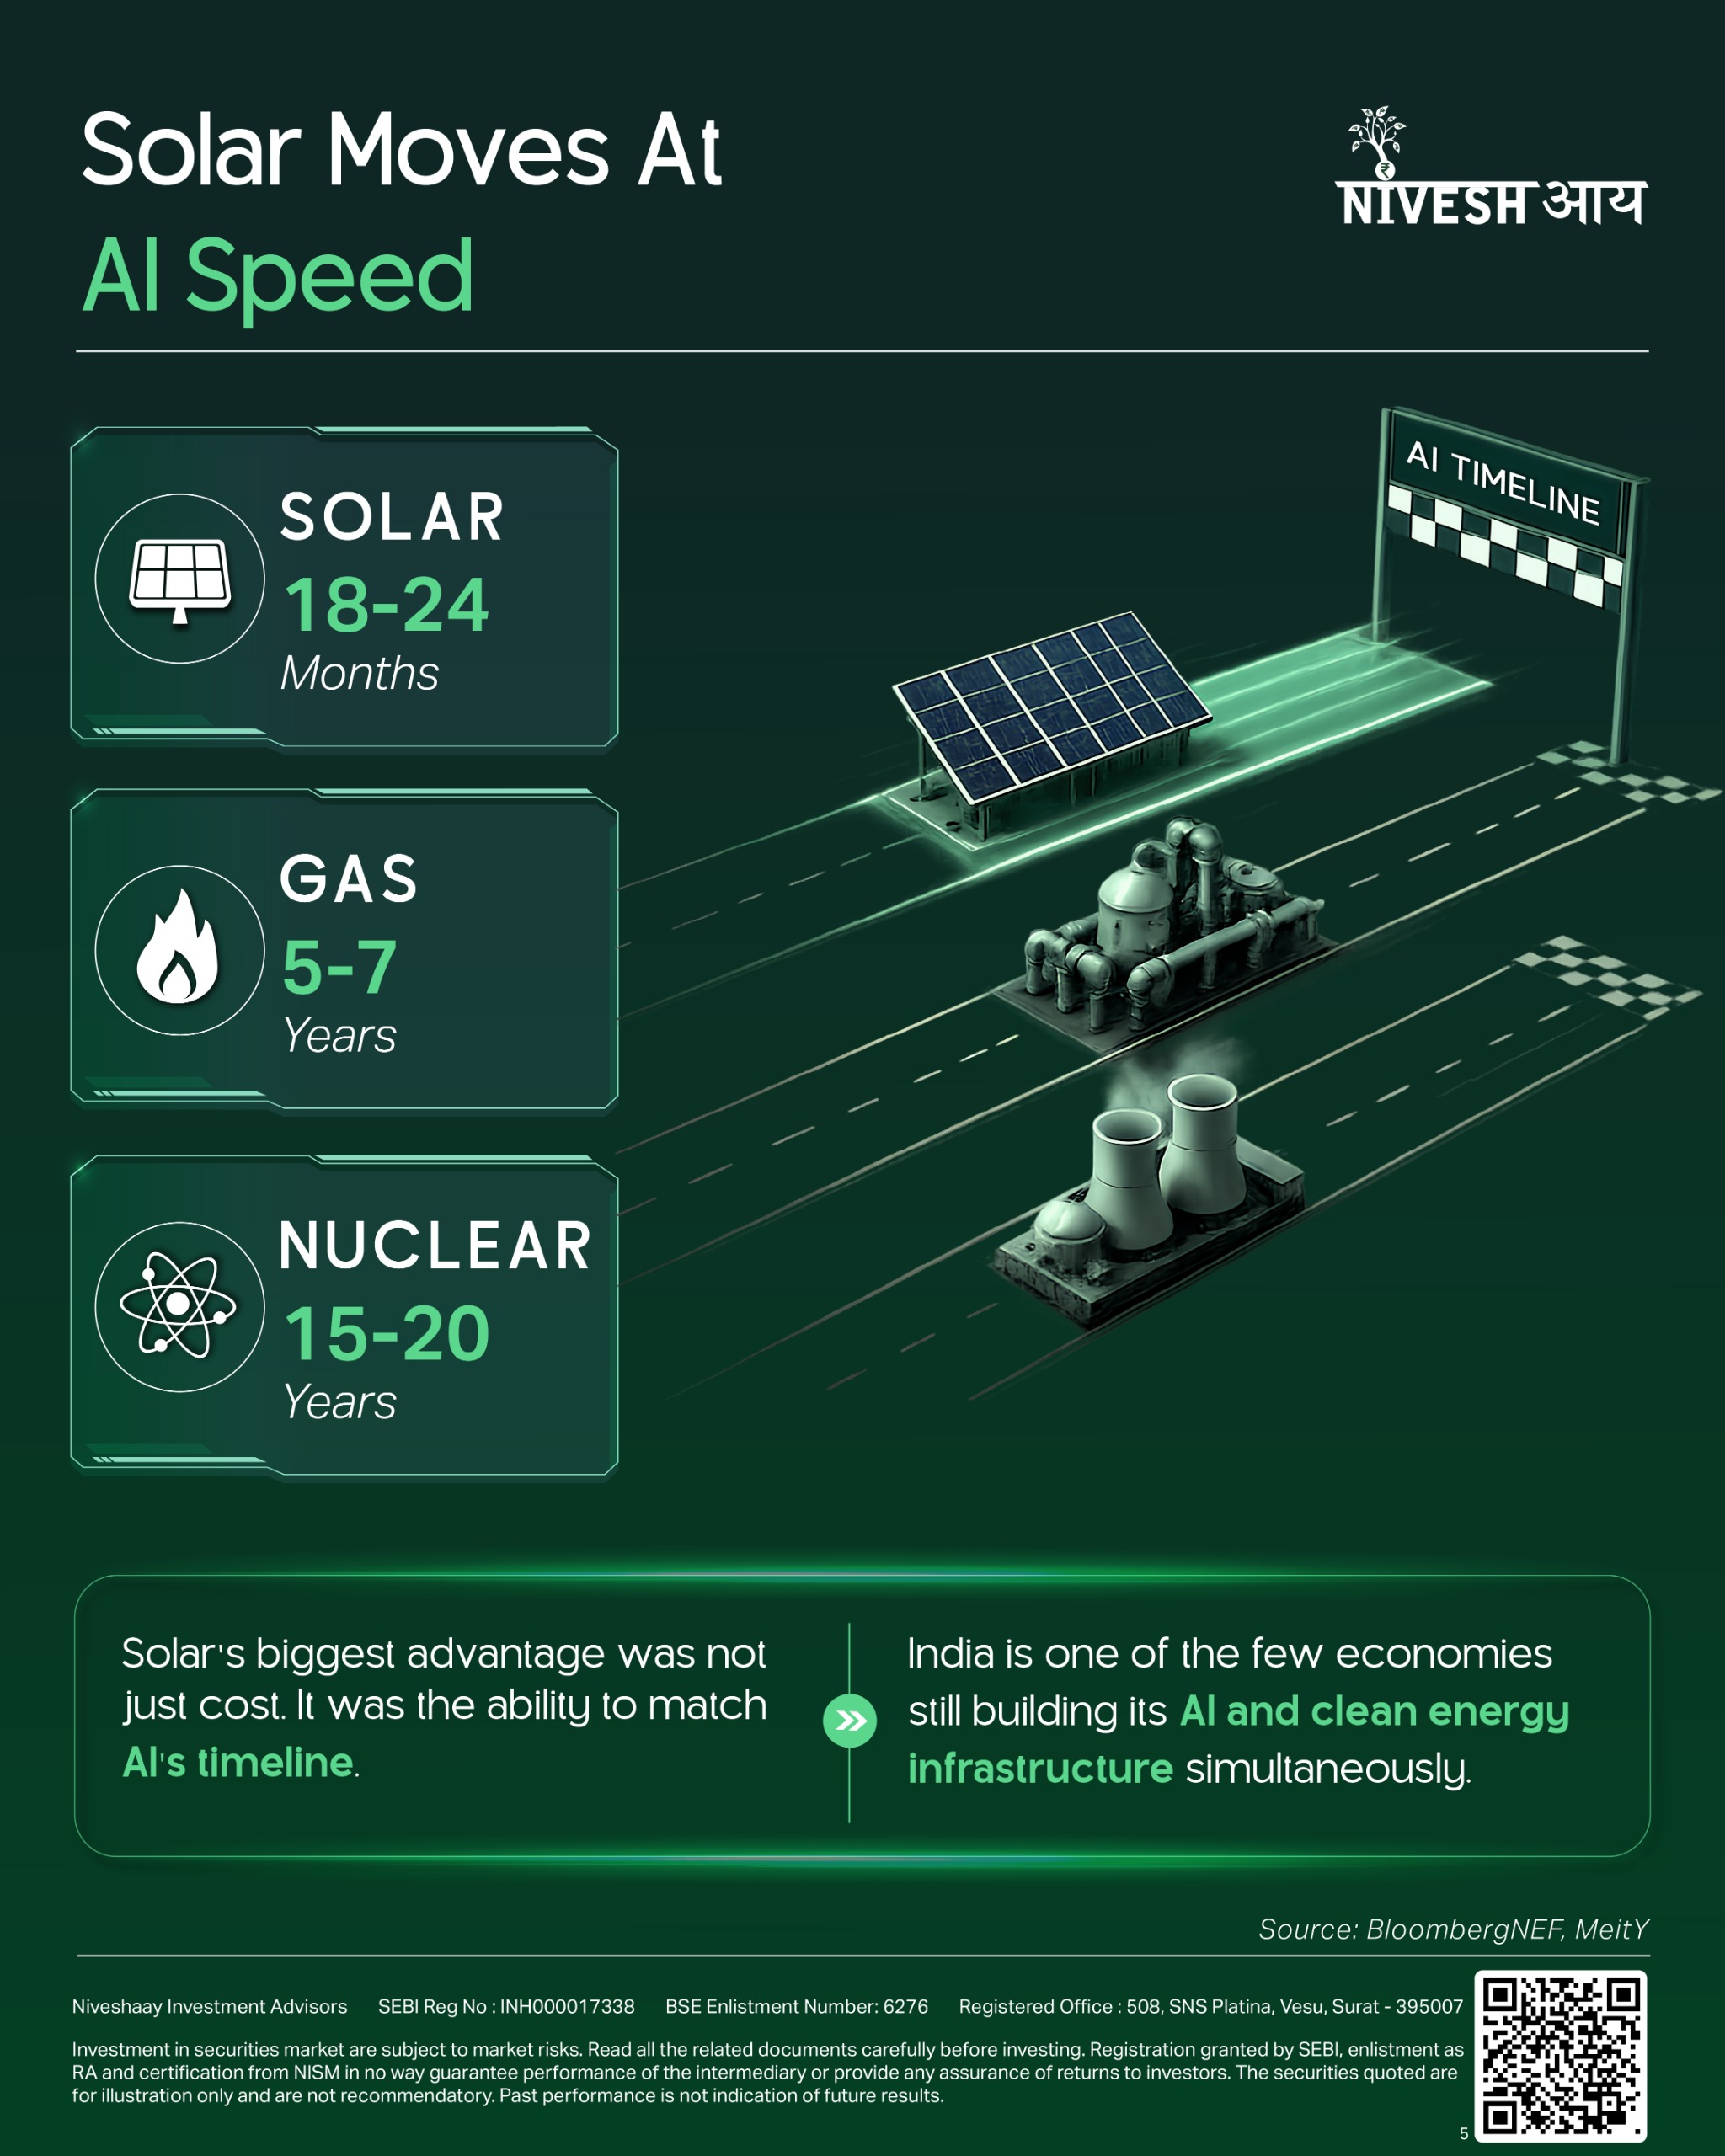
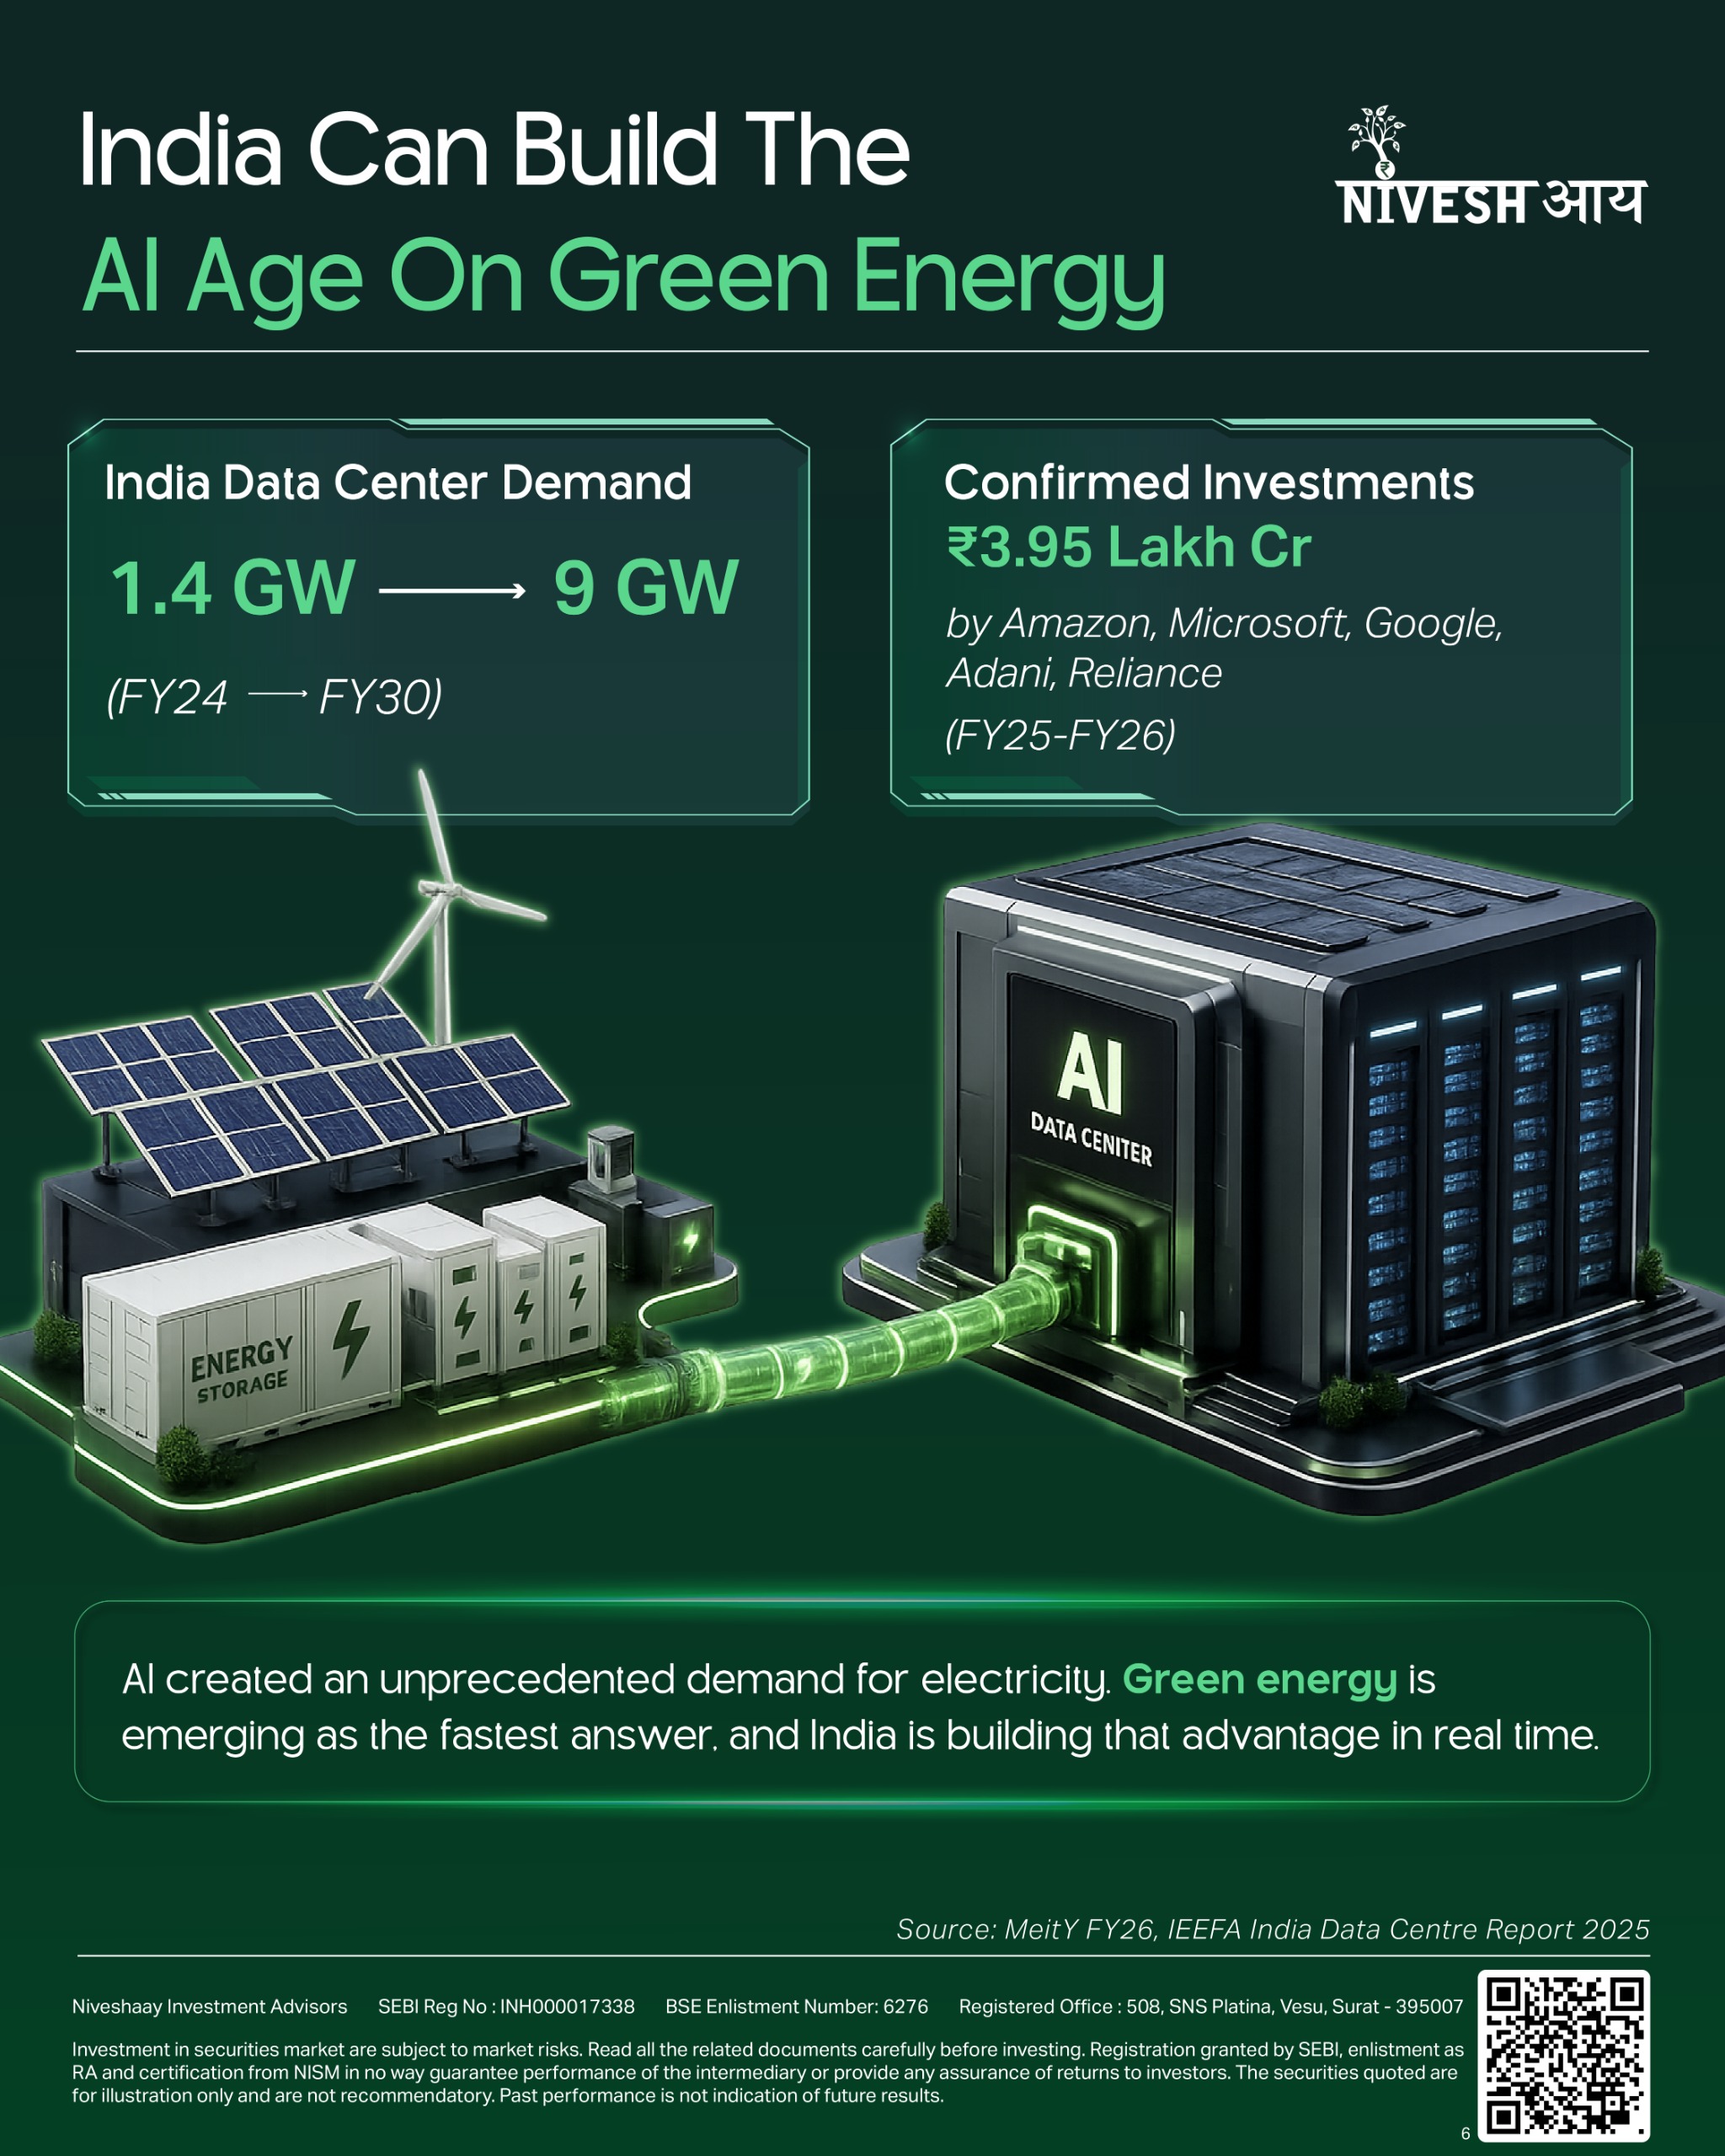
Less than four years ago, ChatGPT did not exist. Today, AI models are becoming so powerful that questions around their access, security, and control have entered the global conversation.
Yet, beneath every major breakthrough lies a simple truth: intelligence has a massive power bill.
• The Reality: Every AI query requires compute, and every data centre needs a massive, uninterrupted supply of electricity.
• The Bottleneck: AI can evolve in months, but power infrastructure takes years to build. The next challenge is no longer just creating better intelligence; it is generating enough energy to sustain it.
• The Silent Hero: Green energy, especially solar, is moving beyond sustainability. It is becoming the critical infrastructure powering the next generation of AI, because the future of intelligence depends on the speed and scale at which we can produce clean energy.
India holds a rare structural advantage.
While many developed economies are upgrading legacy power systems, India is building its digital infrastructure and renewable energy ecosystem simultaneously.
The biggest AI winners may not only be the companies writing the code. They may be the ones powering the computers that run it.
Explore the ecosystem behind this transition: https://shorturl.at/jriOx
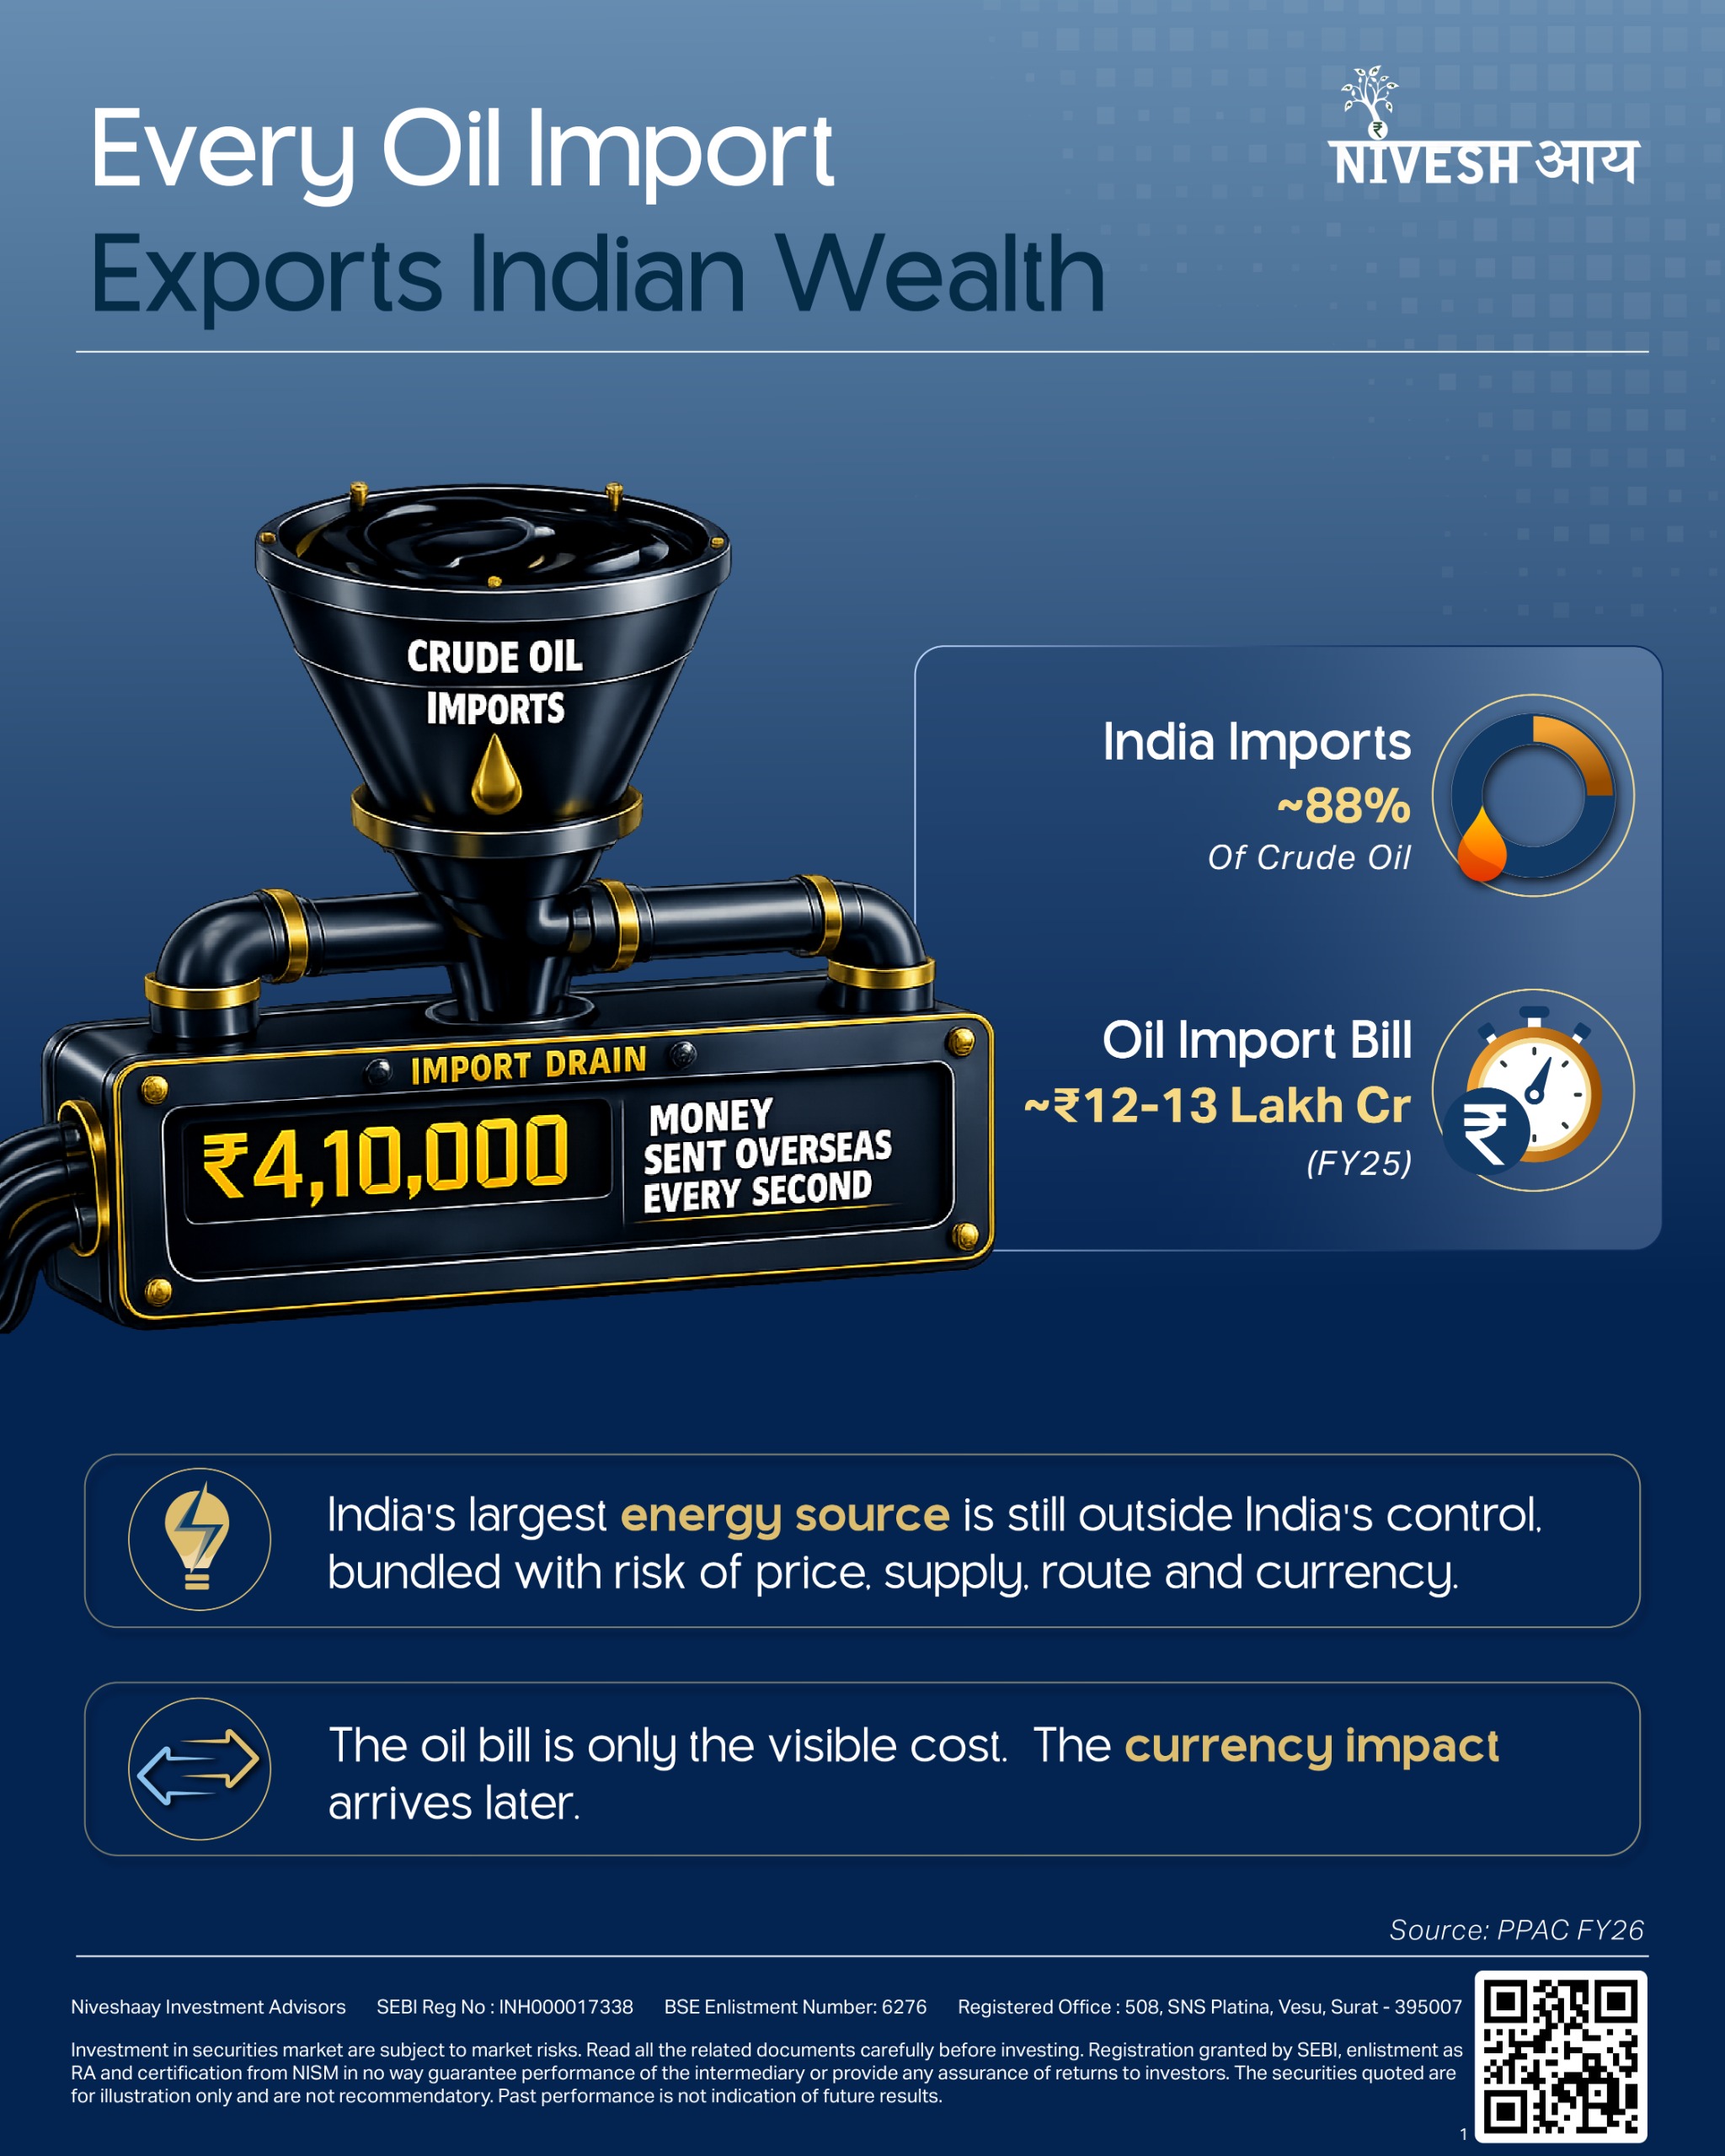
Electric Vehicle & Ancillaries
From Oil Dependence to India’s Green energy Independence
India Green Energy: Rising oil import dependence is accelerating the shift toward domestic renewable energy, energy security, and long-term investment opportunities.
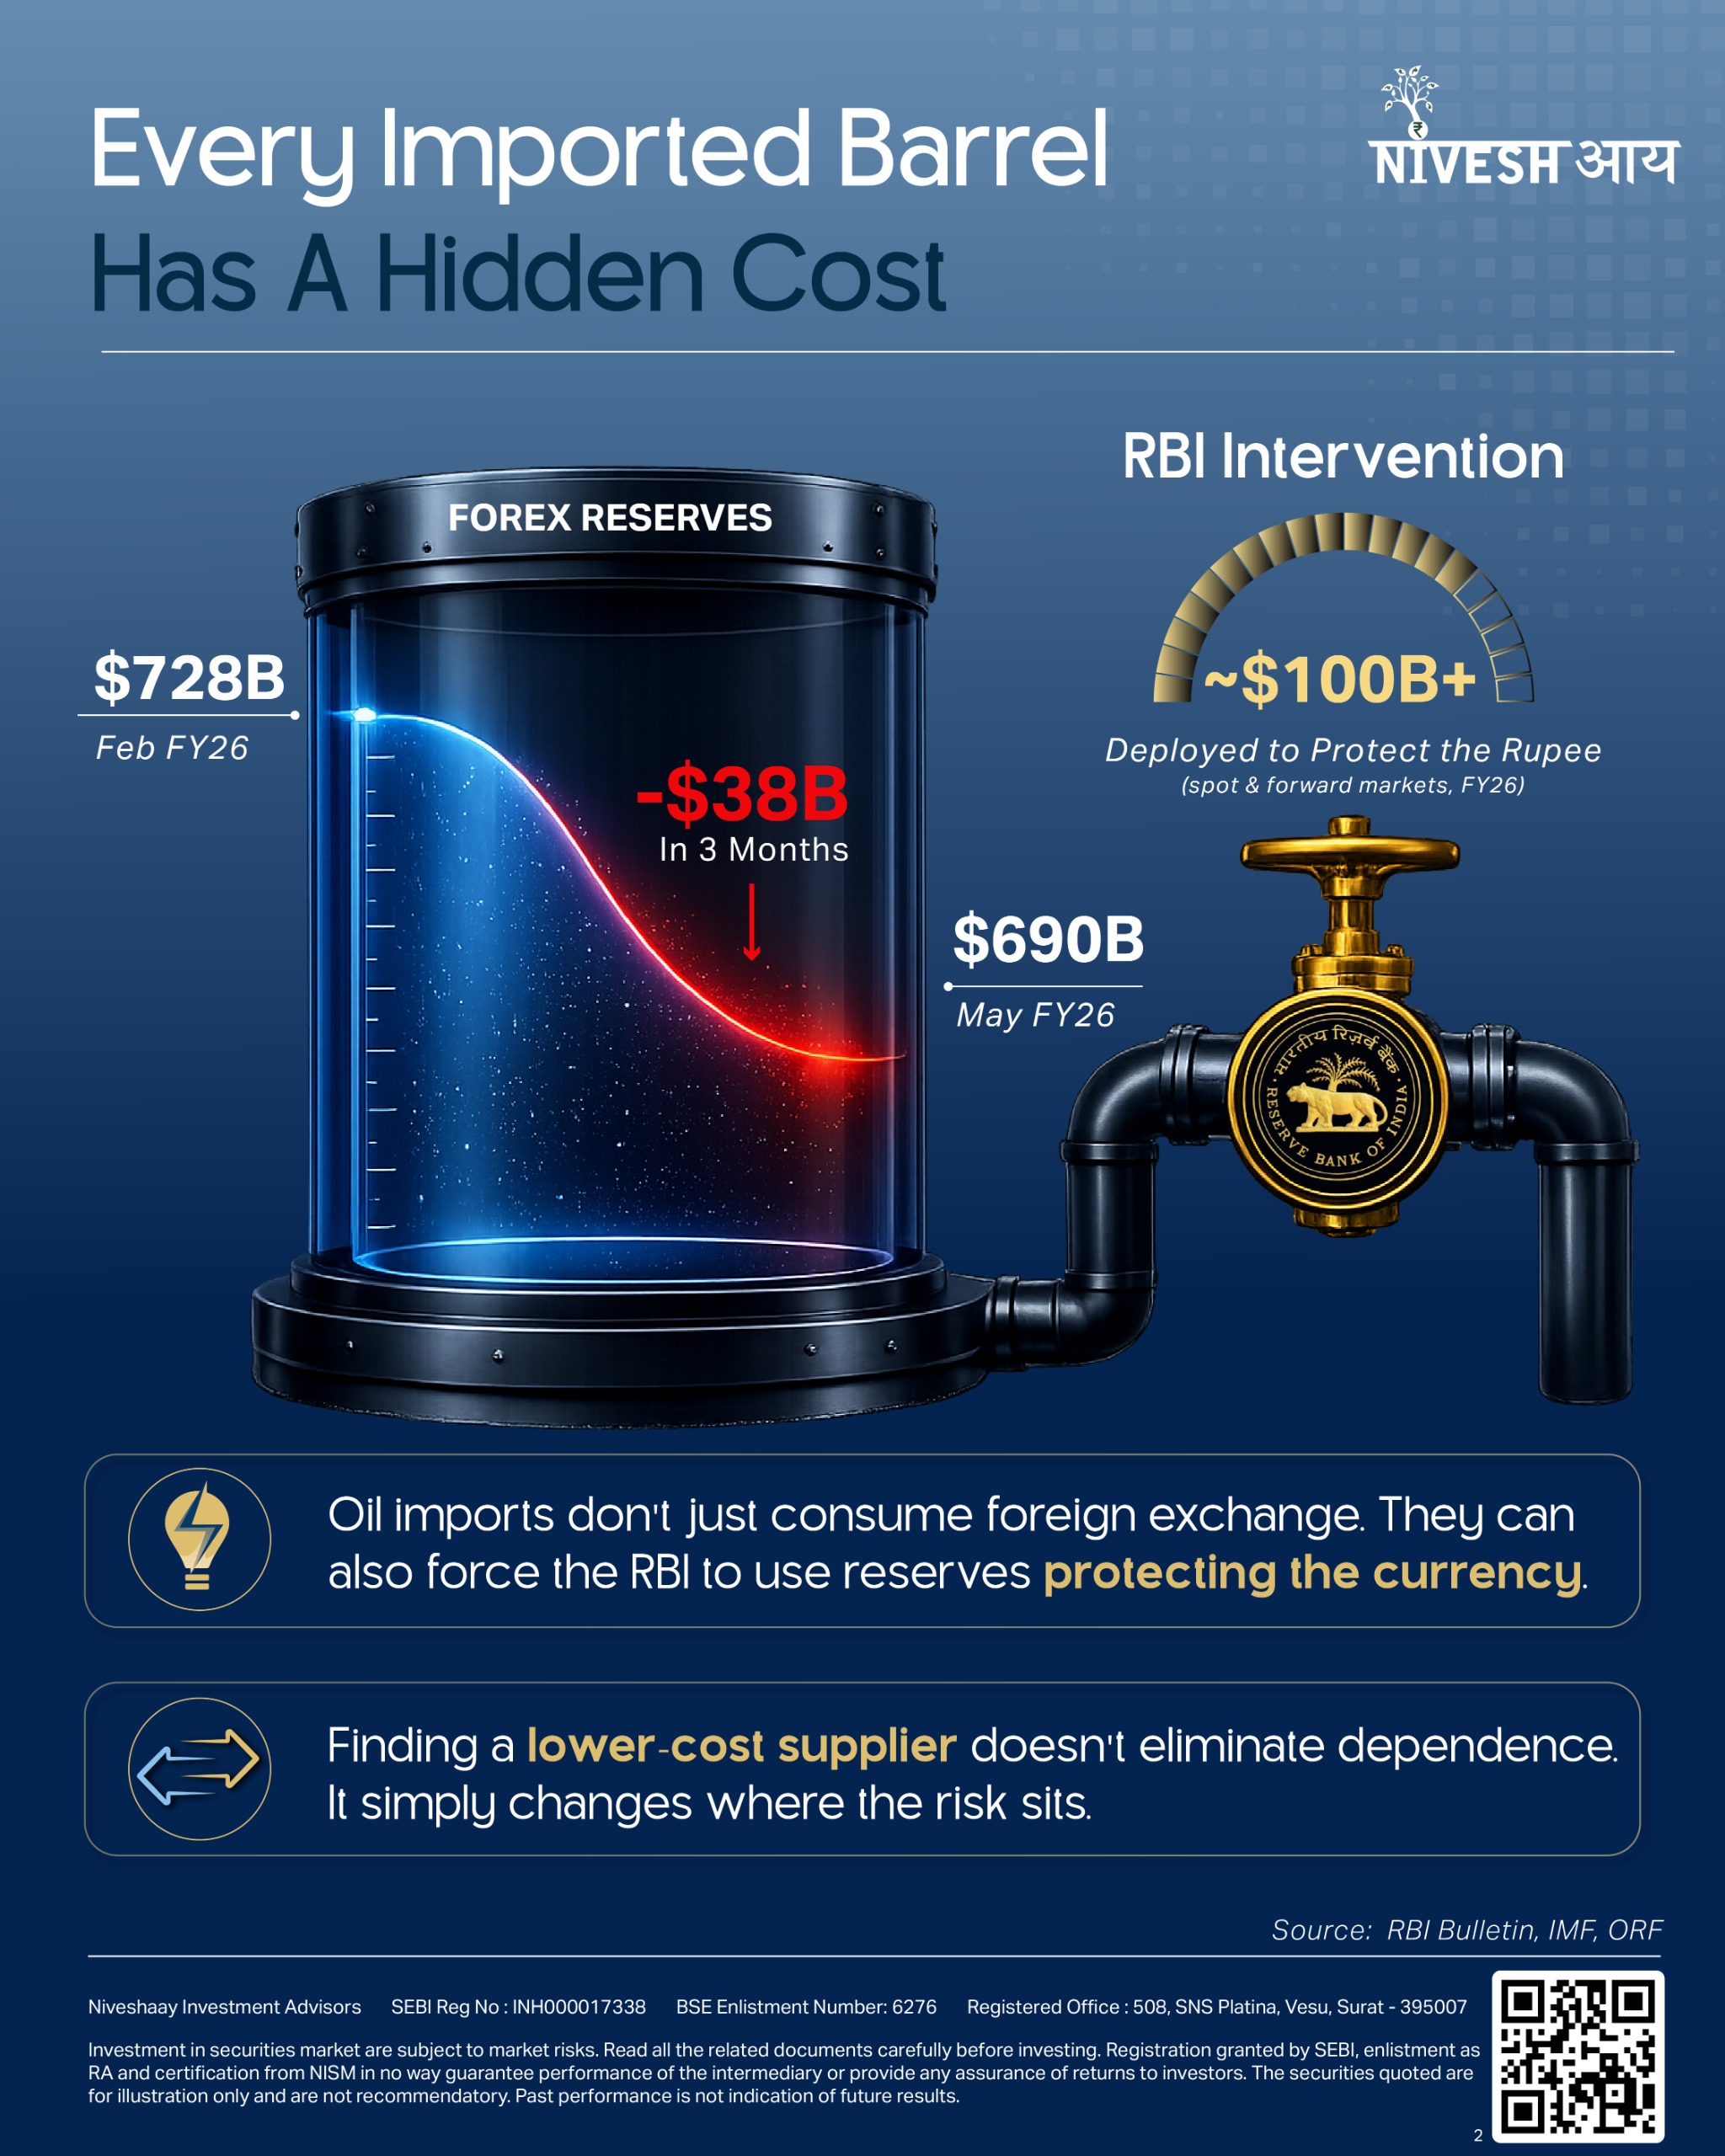
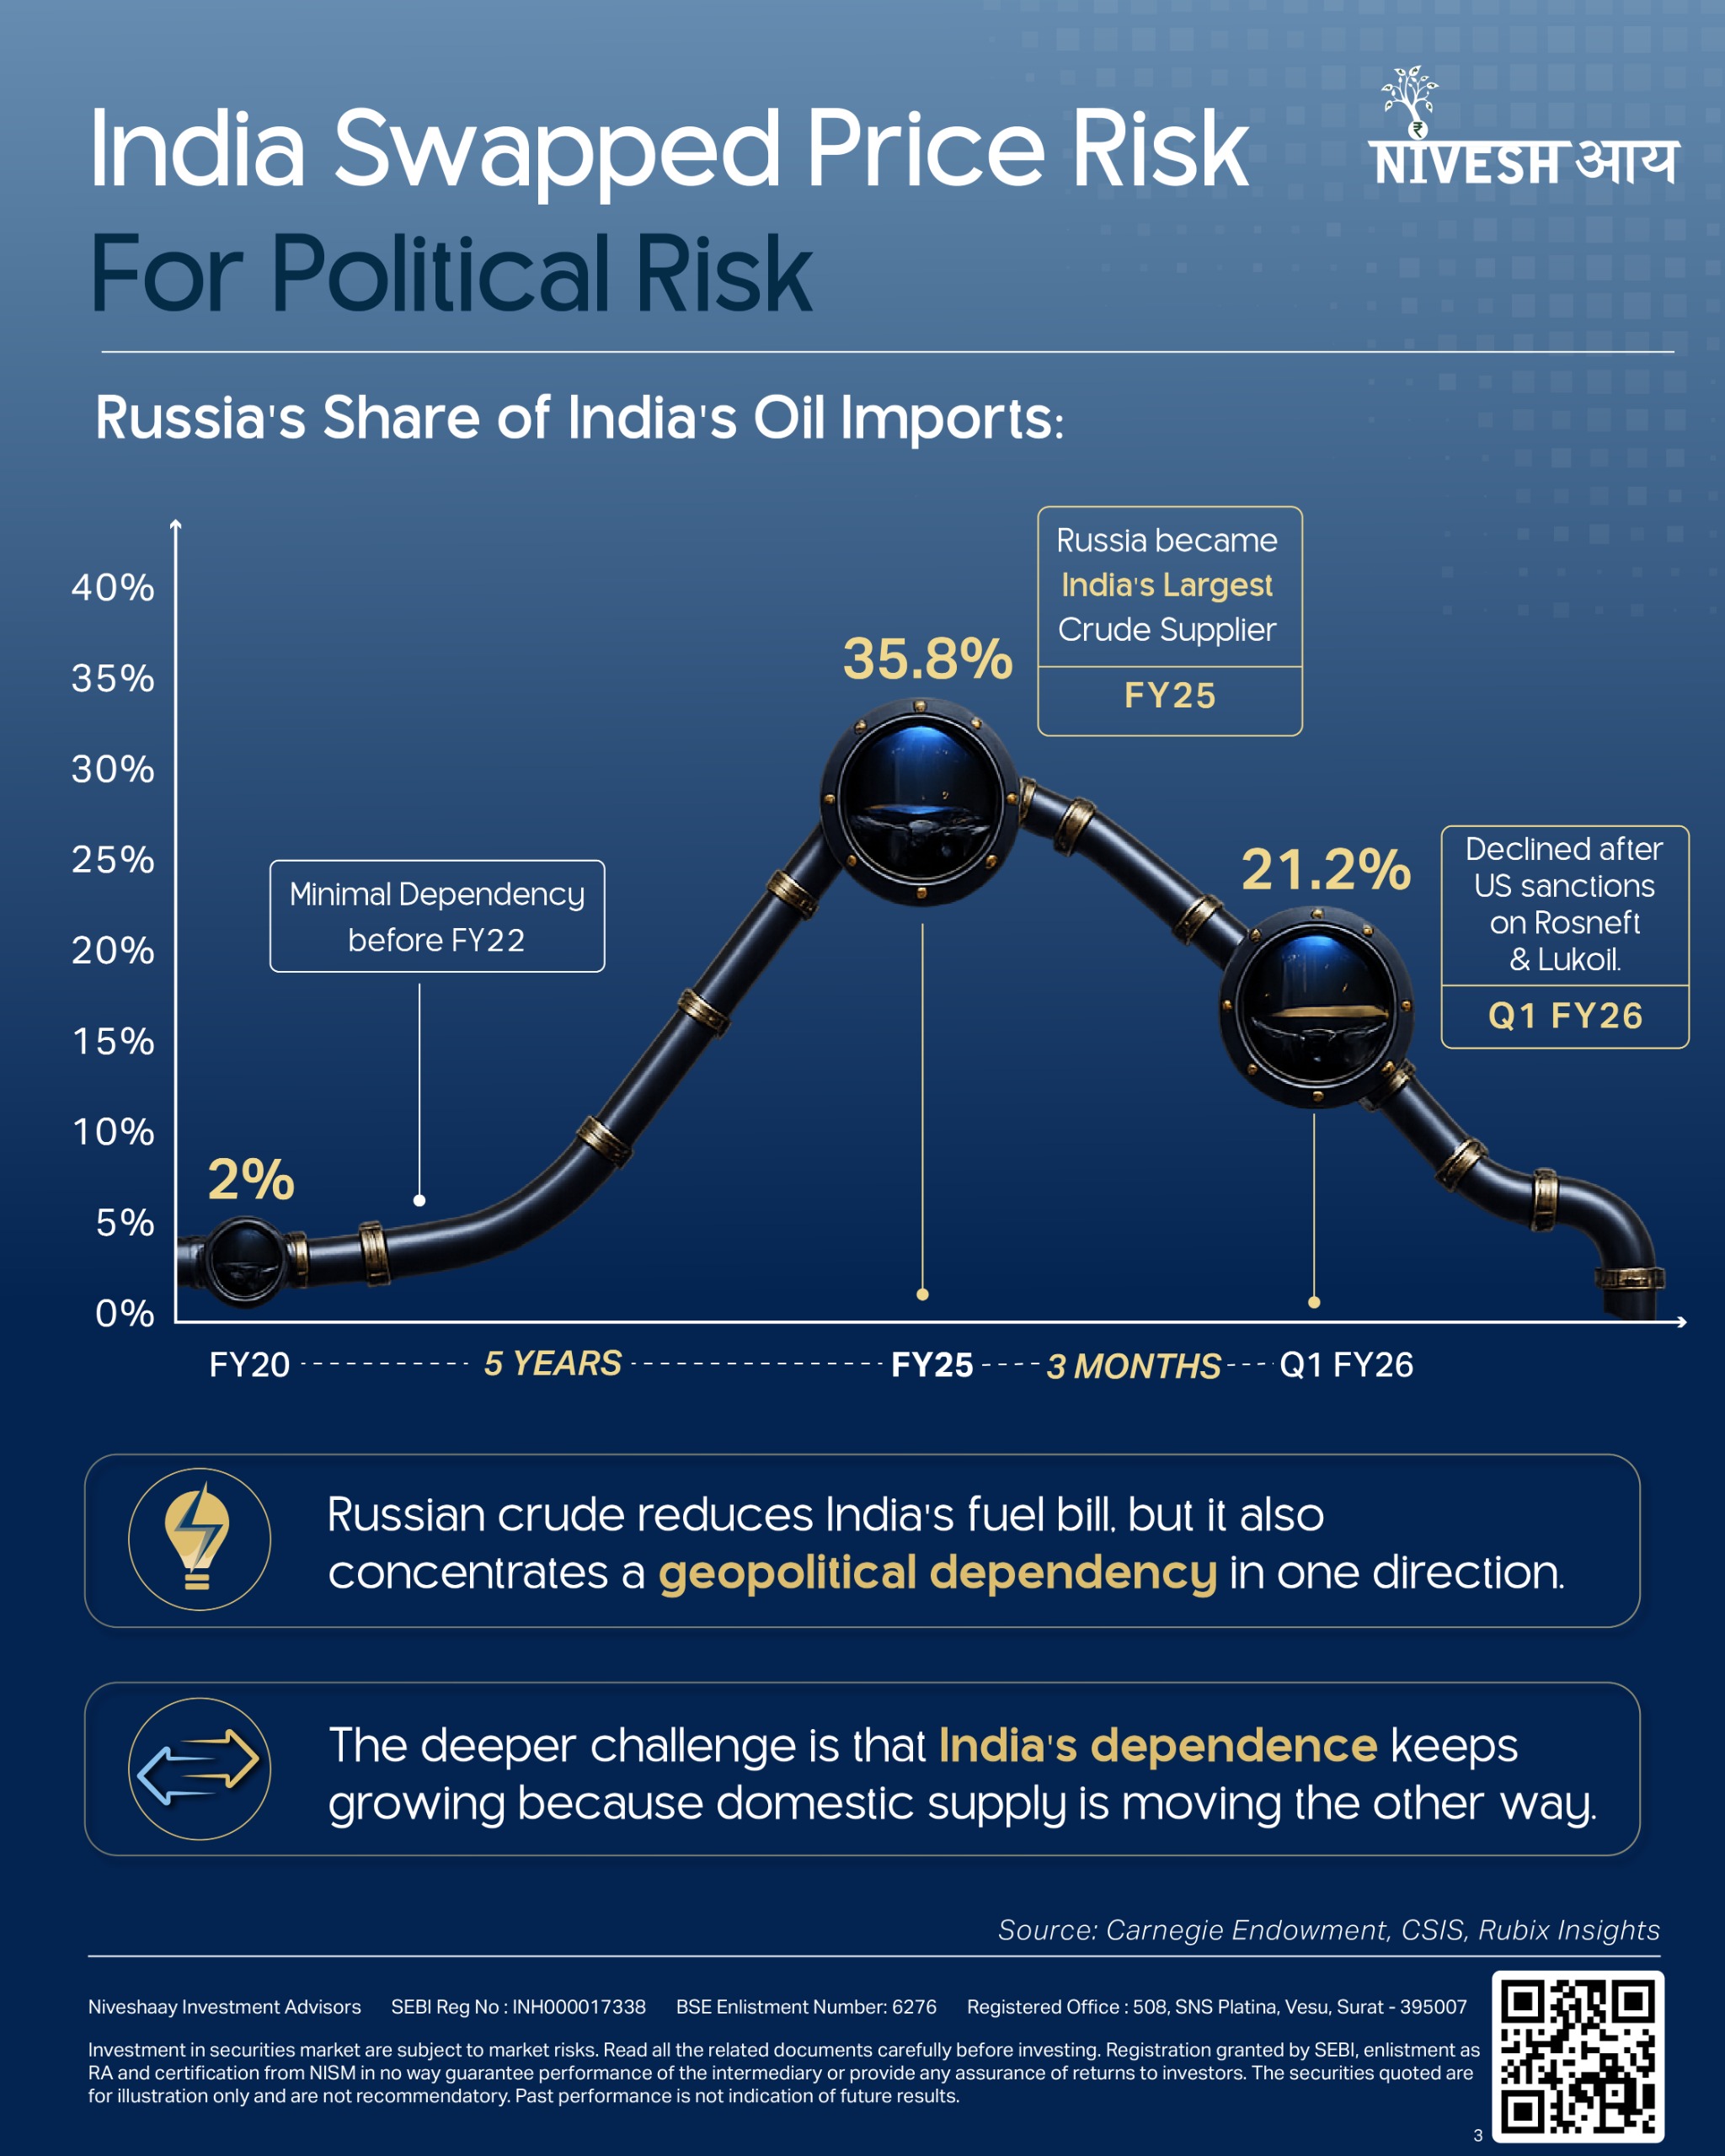
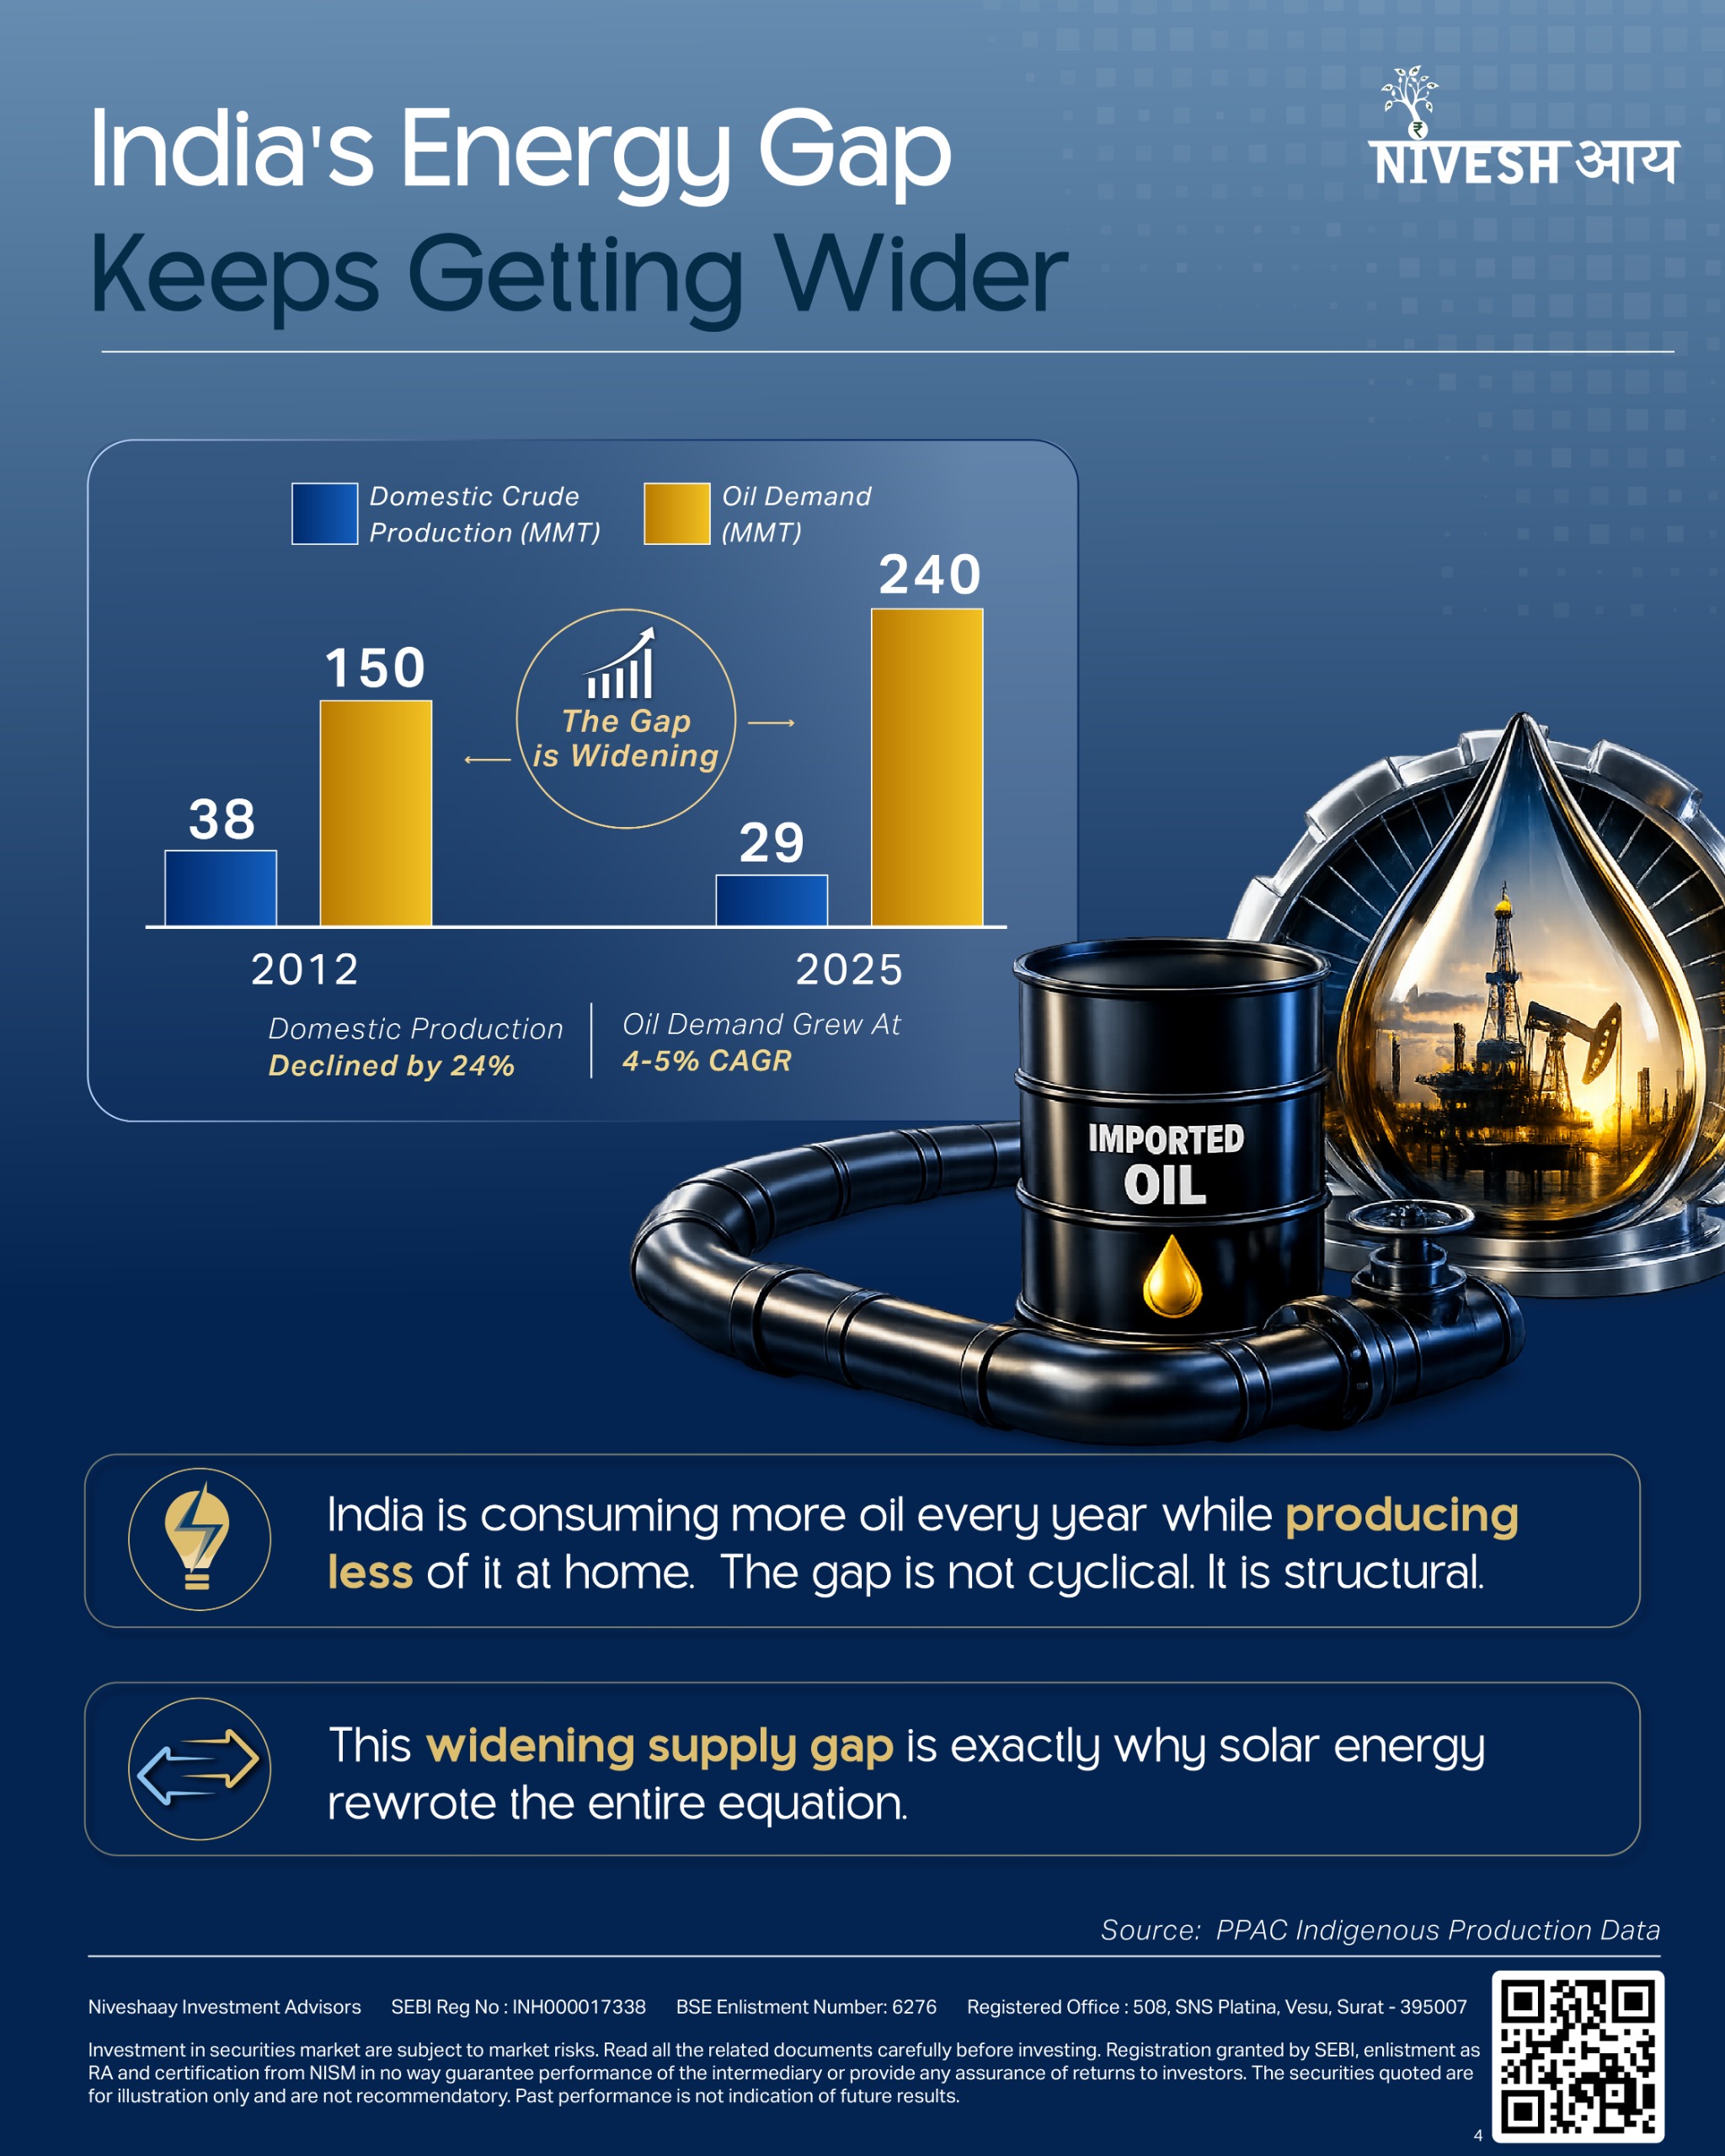
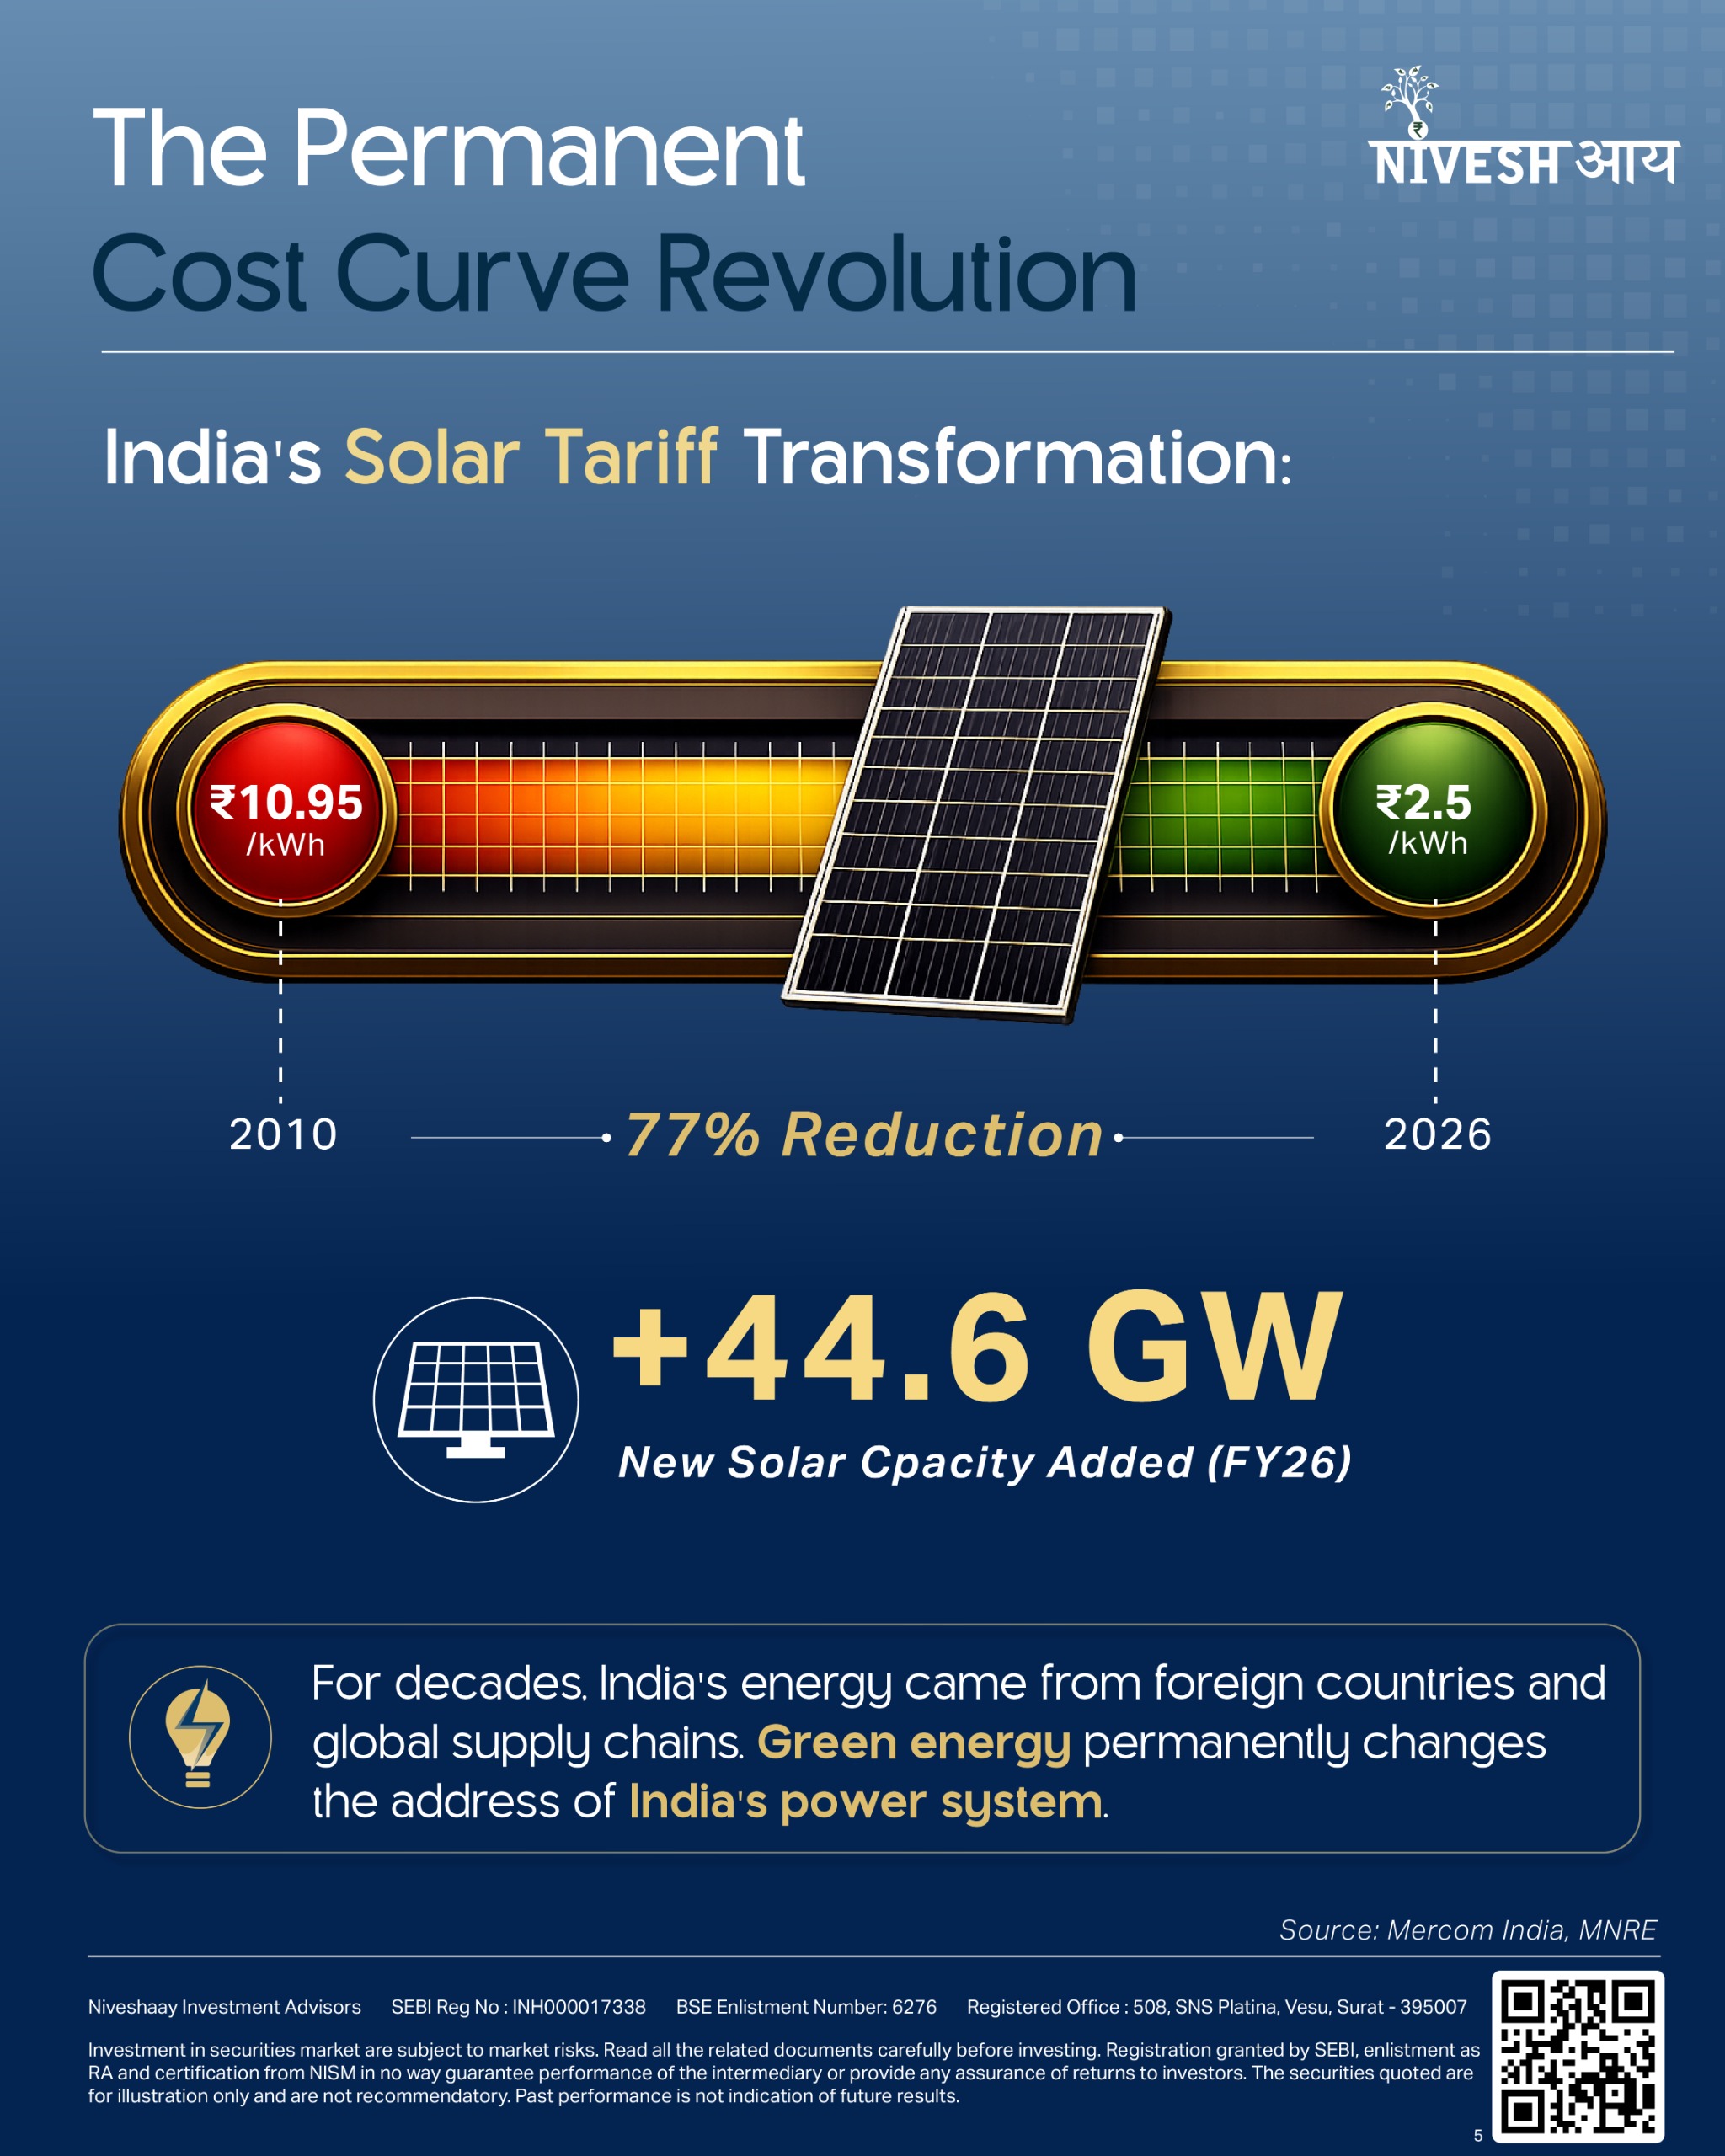
Every single second, India sends ₹4.10 lakh overseas just to keep its wheels turning.
Relying on foreign suppliers for ~88% of our crude oil drained a massive $134 billion in FY26 alone, importing global price shocks and currency volatility. But domestic green energy is stepping in as the ultimate homegrown hero, permanently moving our energy address from volatile foreign oceans back to Indian soil.
Trillions of rupees are actively pivoting toward domestic solar manufacturing, robust grid infrastructure, and EV ecosystems, representing a multi-decade wealth migration.
🔗 Swipe through to see the cold, hard data rewriting India’s economic destiny.
👇 Read Blog 1 of our Green Energy 2.0 series to understand how India is building its ultimate economic shield: https://niveshaay.com/blog/indias-energy-import-dependency/

Power & Renewable Energy
India’s Energy Risk: Why Green Energy Is the Structural Answer
India spends ₹4.10 lakh every second on imported oil. 88% of every barrel comes from abroad. India energy import dependency is too high.

Nearly 9 out of 10 barrels of oil India uses, are imported. That single fact costs ₹4.10 lakh every second. And it is the main reason green energy has become a national priority.
India has sunlight that most countries would build an entire energy policy around.
It has wind. It has engineers. It has land.
What India never had is an energy system that actually uses any of this, at home, at scale.
That is changing now.
Four risks come bundled with every barrel of imported oil.
India’s crude oil import bill, FY26: $134 billion, roughly ₹11 lakh crore.
A 5% shift in the exchange rate: Adds thousands of crores overnight, without anyone raising the price of oil.
A single conflict thousands of kilometres away can reprice every litre of petrol in India overnight, as we are witnessing right now.
The ~88% import dependency number understates the real problem.
India’s import bill fell recently partly because it shifted heavily to discounted Russian crude. Russia’s share of India’s imports went from just 2% in FY20 to 35.8% in FY24–25.
That looked like smart procurement. What it actually did was concentrate a new geopolitical risk in one direction.
India traded Middle East price risk for Russia political risk.
Both are import dependent.
The only structural exit is a domestic energy system that reduces how much oil India needs from anyone.
When oil prices rise, India’s import bill increases → the current account deficit widens → the rupee weakens → oil costs even more in rupee terms → the RBI must defend the currency by selling dollars → reserves fall.
RBI dollar sales in FY26: over $100 billion in spot and forward markets to defend the rupee
Forex reserve drawdown (Feb–May 2026): $728 billion → $690 billion, a $38 billion fall in three months
The ₹11 lakh crore import bill is the visible cost. The ₹9.58 lakh crore in RBI intervention is not reported alongside it.
Together, they are what oil dependency actually costs, not just in foreign exchange, but in rate cuts postponed and monetary policy flexibility surrendered.
Every unit of domestic renewable electricity produced removes one unit of this loop from the system.
Domestic oil production FY12: ~38 MMT
Domestic oil production FY25: ~28.7 MMT, a 25% drop over 13 years
Demand kept growing at 4–5% every year. The gap gets filled by imports, and it widens every year.
Importing more is not a solution. It is the problem. The only fix is a new domestic energy system built on what India already has.
In 2022, Russia cut gas to Europe. Industrial electricity spiked to €0.20–0.30/kWh, two to three times normal.
Manufacturing follows the lower-cost electricity. Always. Europe 2022 proved it in real time.
Europe’s response was REPowerEU, an emergency domestic renewable buildout.
Gulf states put sovereign wealth into solar.
China built 80%+ of global solar manufacturing.
India is now building the same system, with one advantage none of them had at the time:
solar already costs ₹2.5/kWh.
An electron from a solar panel in Rajasthan has no Hormuz risk. Its supply cannot be disrupted overseas. Its price cannot be set by another country.
Solar tariff in 2010: ₹10.95/kWh
Solar tariff in 2026: ~₹2.5/kWh
Decline: 77% in 15 years, driven entirely by technology, not policy
That is not a subsidy outcome. It is a cost curve. And cost curves only go one direction.
New solar capacity FY26: 44.6 GW, an 87% year-on-year increase, highest ever in a single year
Cumulative installed (March 2026): 150.26 GW, world’s third-largest solar-base.
PM Surya Ghar scheme: 2.6 million homes covered; rooftop solar up 69% YoY.
2030 non-fossil target: 50% achieved, five years early. Target now raised to 60% non-fossil by 2035
The cost curve did this. Not mandates. Not subsidies. Technology economics.
India spends ₹12–14 lakh crore per year on energy imports. But that number becomes real when you see where most of it goes.
Transport consumes 60–70% of all petroleum India uses. Every petrol pump, every highway truck, every auto-rickshaw- that is where the import bill lives.
That makes transport the single highest-leverage point for substitution. And the substitute is already cheaper.
Replacing even 20% of transport fuel with domestic renewable electricity saves ₹2.4–2.8 lakh crore annually, money that stays inside India instead of leaving as foreign exchange.
The numbers at the vehicle level make it concrete.
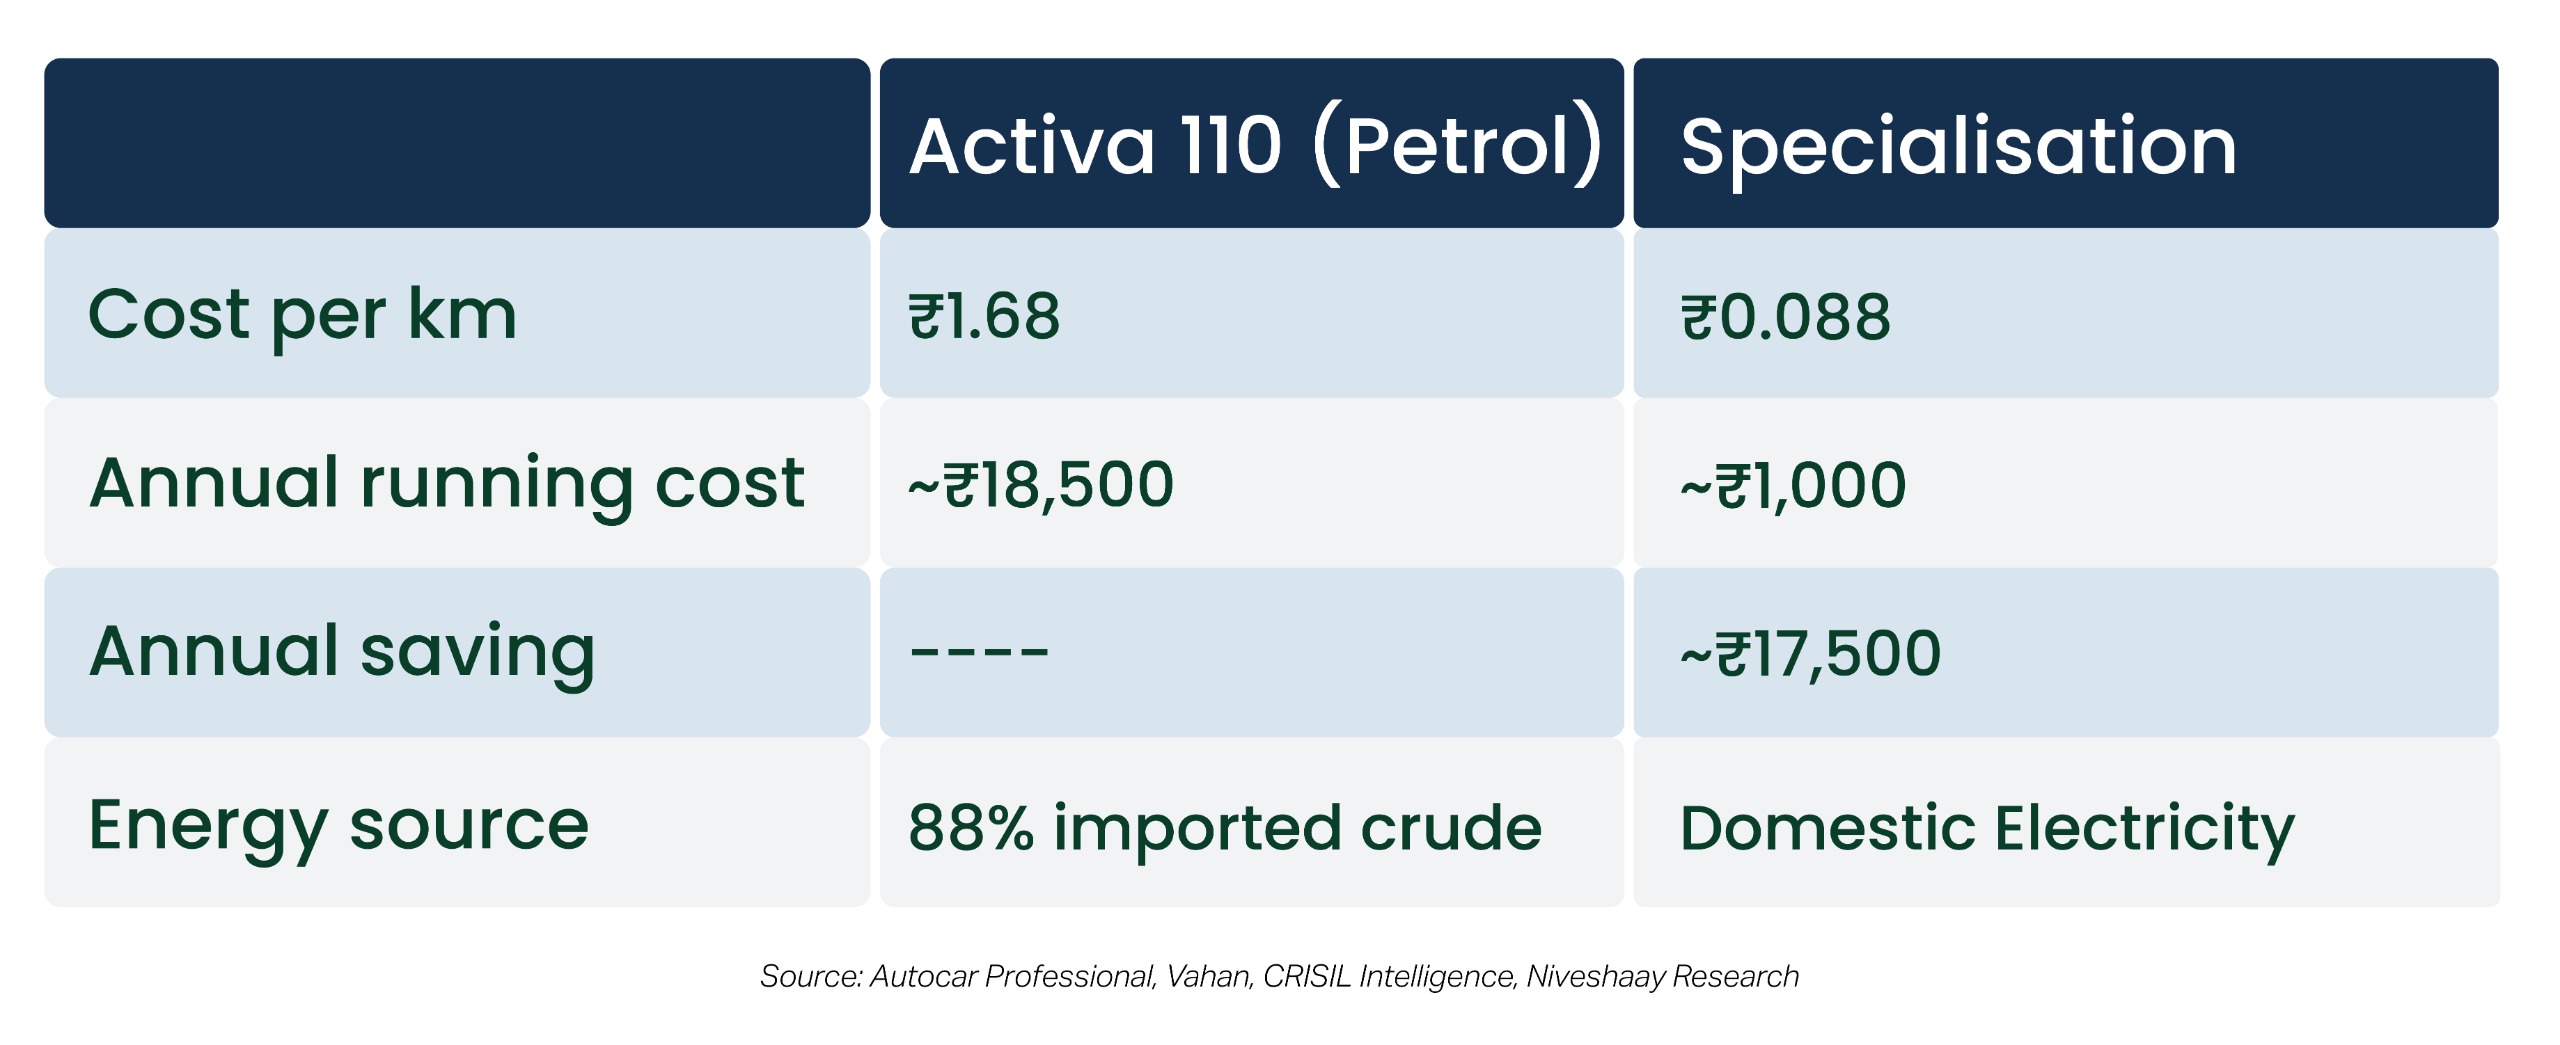
₹17,500 saved per vehicle, without any subsidy. India has 300 million two-wheelers.
At national scale, that is not a transport story. It is a balance-of-payments story.
· The energy address shift is a multi-decade investment theme.
· Every rupee of import substitution flows through domestic IPPs, grid infrastructure, EV manufacturing, and battery storage.
· India’s T&D market alone represents ₹9.15 lakh crore of committed capex through 2032, not projected, tendered and executing.
· The solar manufacturing base at 210 GW module capacity is an export platform, not just a domestic supply story.
· The question for an investor is not whether this transition happens. It is which part of the value chain captures the value as it does.
Green energy moves India’s energy address from abroad to at home. This argument is not about climate. It is about who controls the price, the supply, and the route. Right now, that is not India.
Green energy changes that, structurally, permanently, and faster than most analysis has priced.
→ The energy address is changing. But the second layer of this story arrived faster than anyone expected, because AI suddenly needs electricity in amounts no grid was designed for.

AI & Data Center
GREEN ENERGY 2.0 – THE GROWTH INFRASTRUCTURE
India's green energy transition is not a climate story. It is an infrastructure, supply chain, and manufacturing story. Here is the full argument.
The World Needs More Electricity Than It Can Build. India Might Be the Answer.
Something quietly historic happened in India last year.
India added more solar power in one year than it had built in the previous decade combined.
It crossed 150 GW of installed solar. It became the world’s third-largest solar base.
And it did all of this while spending ₹4.10 lakh every second on imported energy, because solar alone is not the story.
After the panel is installed, nobody talks about what happens next.
Who makes the wire that carries the power. Who builds the battery that stores it. Who manufactures the transformer that connects it to the grid, and why that transformer now takes three years to arrive.
That is where this story lives.
Green energy is not an environmental story anymore.
It is an infrastructure story. A supply chain story. A manufacturing story. A competitiveness story.
And sitting at the centre of all of it, simultaneously, is India.
The world is rebuilding its electricity system at a speed the supply chain was never designed for. Most investors have only seen one piece of it.
Six blogs. One argument nobody is making in full.
Blog 01:
India pays ₹12–14 lakh crore every year for energy it could make at home. 88.2% of every barrel is imported. ₹4.10 lakh leaves the country every second.
That dependence is the starting point. What arrived next turned it into a global emergency.
Blog 02:
By 2030, AI electricity demand grows 24×. One query already uses 10× the power of a Google search. One campus need as much electricity as a small city.
AI exposed how fragile the grid already was. Solar was the only answer fast enough. But moving that fast created a different problem.
Blog 03:
In August 2025, 51.5% of Rajasthan’s peak solar was wasted. ₹700 crore lost in six months to power India made but could not move. Transformer lead times tripled.
India’s bottleneck turned out to be global bottleneck. Just at a different scale.
Blog 04:
$2.3 trillion invested in clean energy in 2025. Four economies. One supply chain. No second tier anywhere.
That crunch is reshaping who can manufacture competitively. And one country is building into it from the inside.
Blog 05:
At the 2022 crisis peak, European industrial electricity cost 3–5× more than India’s. From 2026, the EU will tax carbon at the border. India’s green buildout reduces both costs at the same time.
The cost advantage is structural. What India is building on top of it closes the story.
Blog 06:
₹9.15 lakh crore committed. Tendered. Executing. Now. Six systems scaling simultaneously, each one making the others faster.
Read all six. The investment map looks very different by the end.

Electronic Manufacturing Services
India Defence Technology: Sovereignty in the Making
Wars your grandparents knew were won by mass. Today, India is winning by technology, drones, stealth, quantum networks, hypersonics.

Think about the wars your grandparents knew. Two sides, drawn up on opposing lines. Victory belonged to whoever sent more men, held more territory, and absorbed more punishment. Then came the Second World War, tanks rolled across borders, aircraft controlled the skies, and industrial output became as decisive as troop strength.
By the time your parents were young, the equation had shifted again. Missiles could travel thousands of kilometres before a soldier ever left the barracks. Nuclear arsenals rewrote the rules of deterrence entirely.
And now? The generation growing up today is watching the rules rewritten once more, only faster, and far more fundamentally.
$20,000 drone forces adversaries to exhaust $4 million interceptors in response, draining defender resources and making the cost of protection far greater than the cost of attack. What was once a niche capability is now reshaping the economics, geography, and outcome of modern conflict. Indigenous long-range missile systems like Project Kusha are redefining how nations defend their skies.
Nationwide multi-tiered shields like Mission Sudarshan Chakra are drawing a protective arc across entire countries. Quantum-secured networks are making communications interception-proof. And these are among the more prominent expressions of a transformation that runs far deeper and wider across India’s entire defence ecosystem.
Dominance is no longer decided solely by troop strength or firepower, but by the speed of decision-making, the precision of targeting, and the depth of technological integration across every domain: air, land, sea, space, and cyberspace.
India, long categorised as a mass-based military with heavy dependence on foreign procurement, is making a move most retail investors haven’t fully priced in yet, quietly but purposefully building a defence architecture that mirrors, and in select domains challenges, the ambitions of far larger military economies.
This blog unpacks some of those capabilities, the numbers behind them, and why this structural shift matters for investors with a long-term view.
Three structural shifts emerged from these conflicts that every defence-focused investor must understand:
This is how modern drone warfare looks today, asymmetric, economically disruptive, and geographically unbounded. But India is not limiting its strength in this domain to low-cost strike drones alone.
Across loitering munitions, tactical surveillance UAVs, and counter-drone systems, India is building a broad, indigenous drone ecosystem, with a growing number of private and public sector companies committing serious industrial capability to every layer of it.
What is taking shape is not a response to a single threat but a deliberate, multi-layered build-out of sovereign drone capability that spans the full spectrum of modern unmanned warfare.
A) The Loitering Munitions Layer
Loitering munitions drones that hover over a target area and strike with precision on command represent the broadest and most diverse industrial participation in India’s drone ecosystem.
Unlike conventional strike drones that follow a pre-set path, loitering munitions give commanders the ability to observe, decide, and strike in real time, making them one of the most tactically flexible weapons in modern warfare.
B) The Surveillance Layer
Modern drone warfare is not won by strike platforms alone. Knowing where the threat is, tracking how it moves, and delivering that intelligence to decision-makers faster than the adversary can act, that is equally decisive. India’s tactical surveillance UAV ecosystem is being built with precisely this urgency in mind.
Some of the most prominent names in India’s defence industry are actively building and deploying surveillance drone capabilities, each bringing a distinct edge to this critical segment and representing only a fraction of the growing number of Indian companies converging on this space:
IdeaForge Technology Ltd, India’s leading UAV manufacturer, has built its position here through two battle-tested platforms that have already earned the Indian Army’s confidence in the most demanding conditions:
Tata Advanced Systems Ltd is adding depth to India’s indigenous surveillance capability through the IVTOL 20, which is currently in its pre-induction stage.
IVOTL 20 is a vertical take-off and landing surveillance drone designed specifically for India’s high-altitude border frontiers, engineered to operate where conventional surveillance assets struggle to function.
C) The Counter-Drone Layer
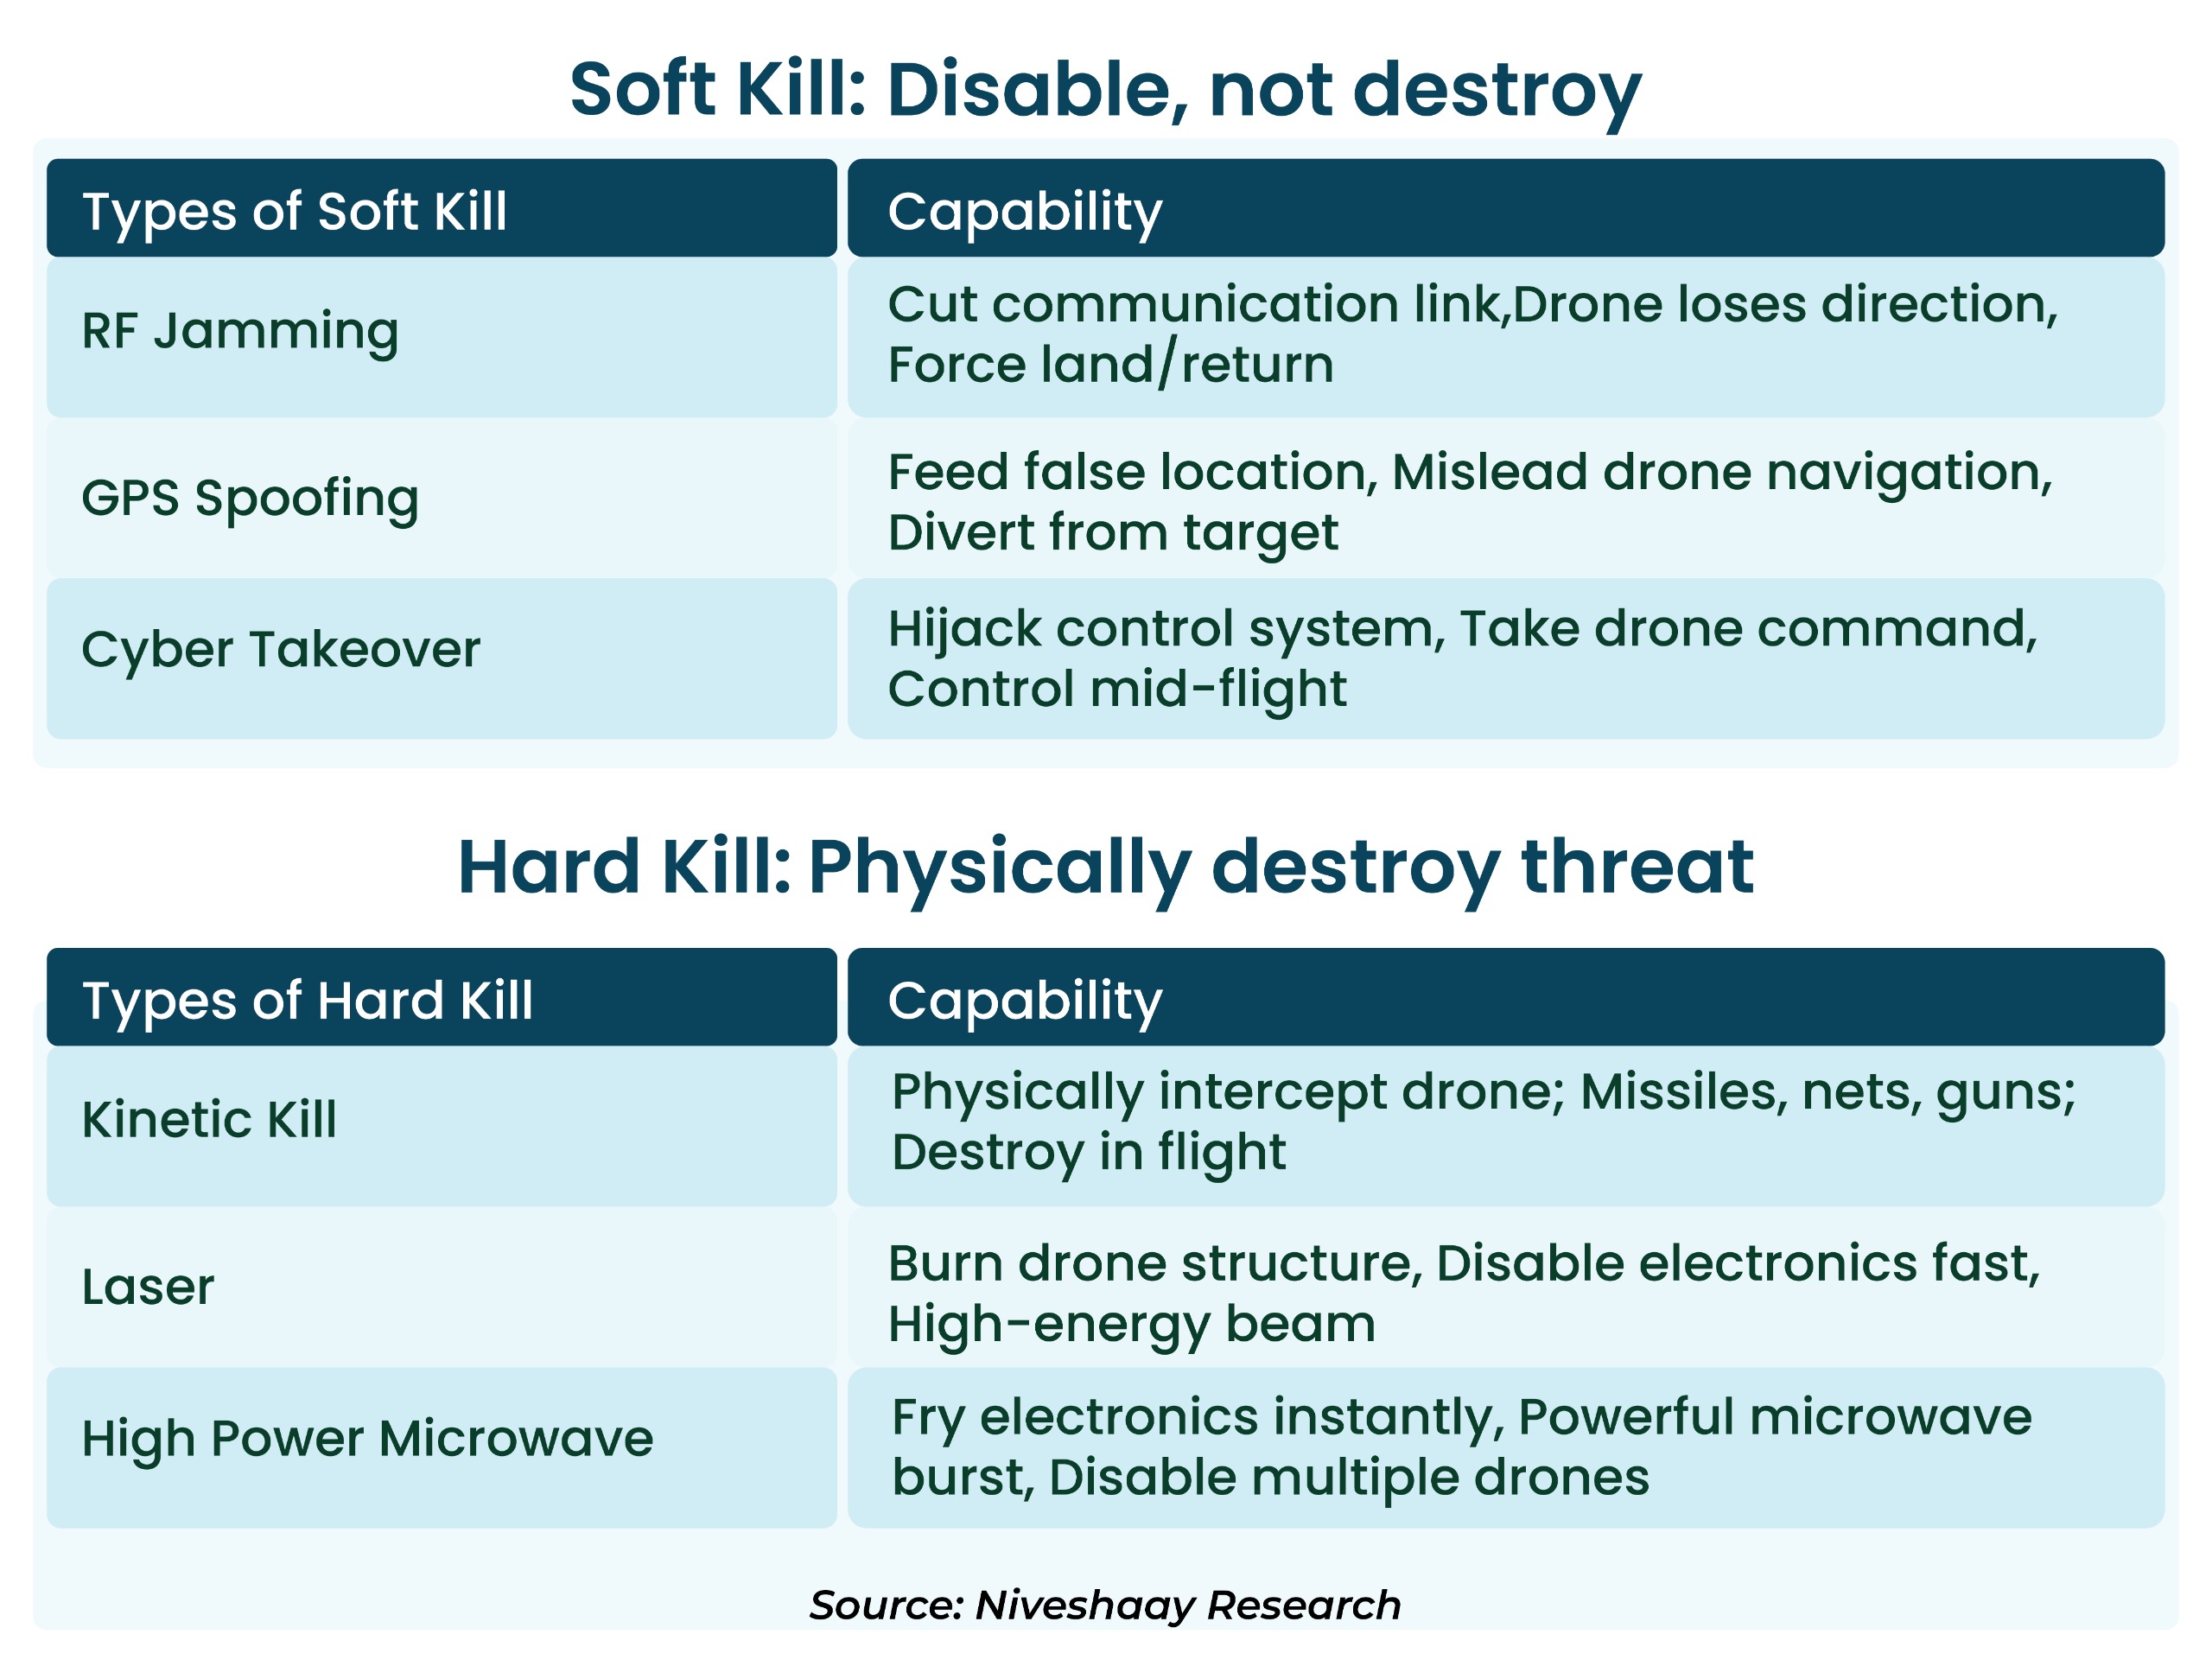
The following are some of the recent developments by Indian companies across both Soft Kill and Hard Kill segments, reflecting a deliberate and accelerating push to build credible, indigenous counter-drone solutions from the ground up:
1 ) Zen Technologies Ltd:
2) Paras Defence & Space Technologies Ltd:
Every layer of offensive capability being constructed is matched by an equally deliberate effort to build the defensive architecture that protects India from the same threats it is learning to deploy.
Across strike platforms, loitering munitions, surveillance UAVs, and counter-drone systems India is building a sovereign, full-spectrum drone industry with indigenous conviction at its core.
The Government of India has now institutionalised this momentum through Mission Drone Shakti — a ₹1,600 to ₹1,800 crore scheme over five years with one clear goal: to eliminate dependence on Chinese drone components and build every part that goes inside a drone, right here in India.
In a battlefield increasingly shaped by stealth, autonomy and long-range precision, India needs platforms that can strike deep without exposing pilots to hostile air defences.
The Ghatak UCAV is being developed for exactly that role a 13-ton flying-wing unmanned combat aircraft built for contested airspace, backed by a government-cleared programme budget of ₹39,000 crore.
With its low-observable design, internal weapons bay and AI-driven mission capability, Ghatak marks India’s move from conventional airpower to next-generation autonomous strike warfare.
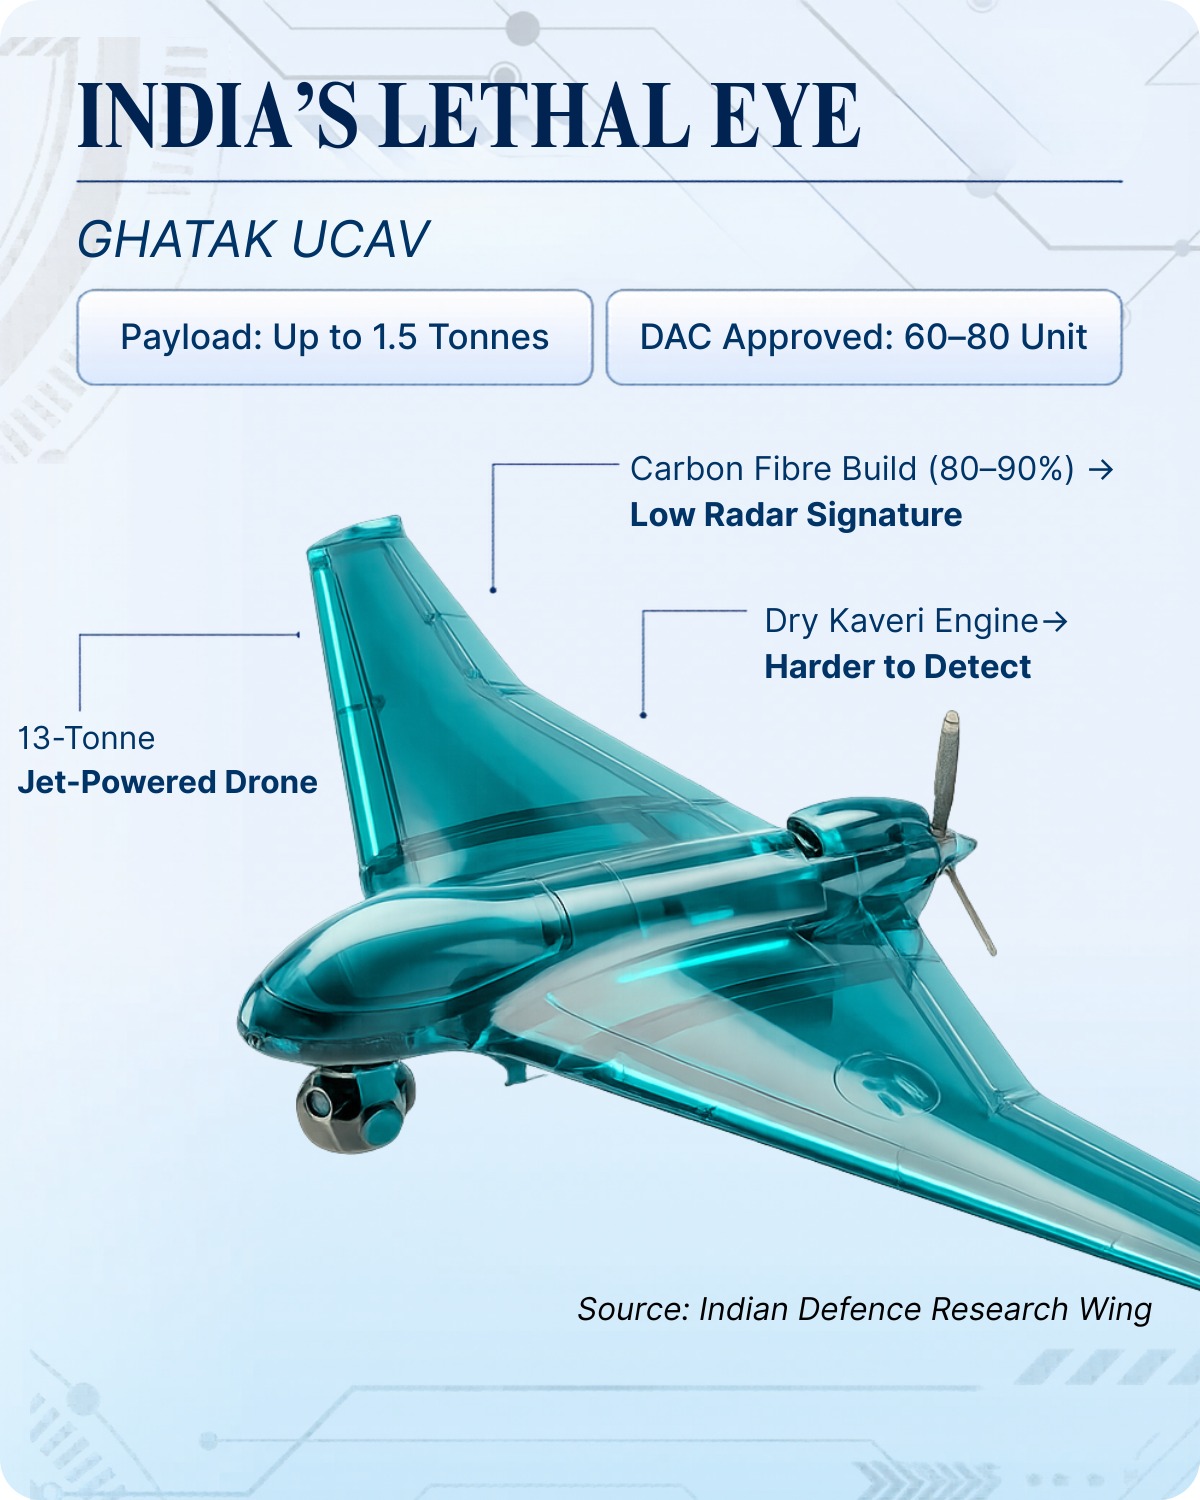
Three things set it apart:
Ghatak is proof that India’s defence ambition has finally caught up with its technological capability.
Every drone and missile capability India builds on the offensive side raises an equally urgent question on the defensive side: who is protecting Indian airspace from the same threat? That is precisely the gap that Project Kusha is designed to close.
For context, India’s most advanced long-range air defence asset today is the S-400 Triumf System, procured from Russia under a $5.43 billion deal signed in 2018. It is a capable system but it is also a foreign one. That means logistical dependencies, geopolitical strings, and zero control over software, integration pathways, or future upgrades.
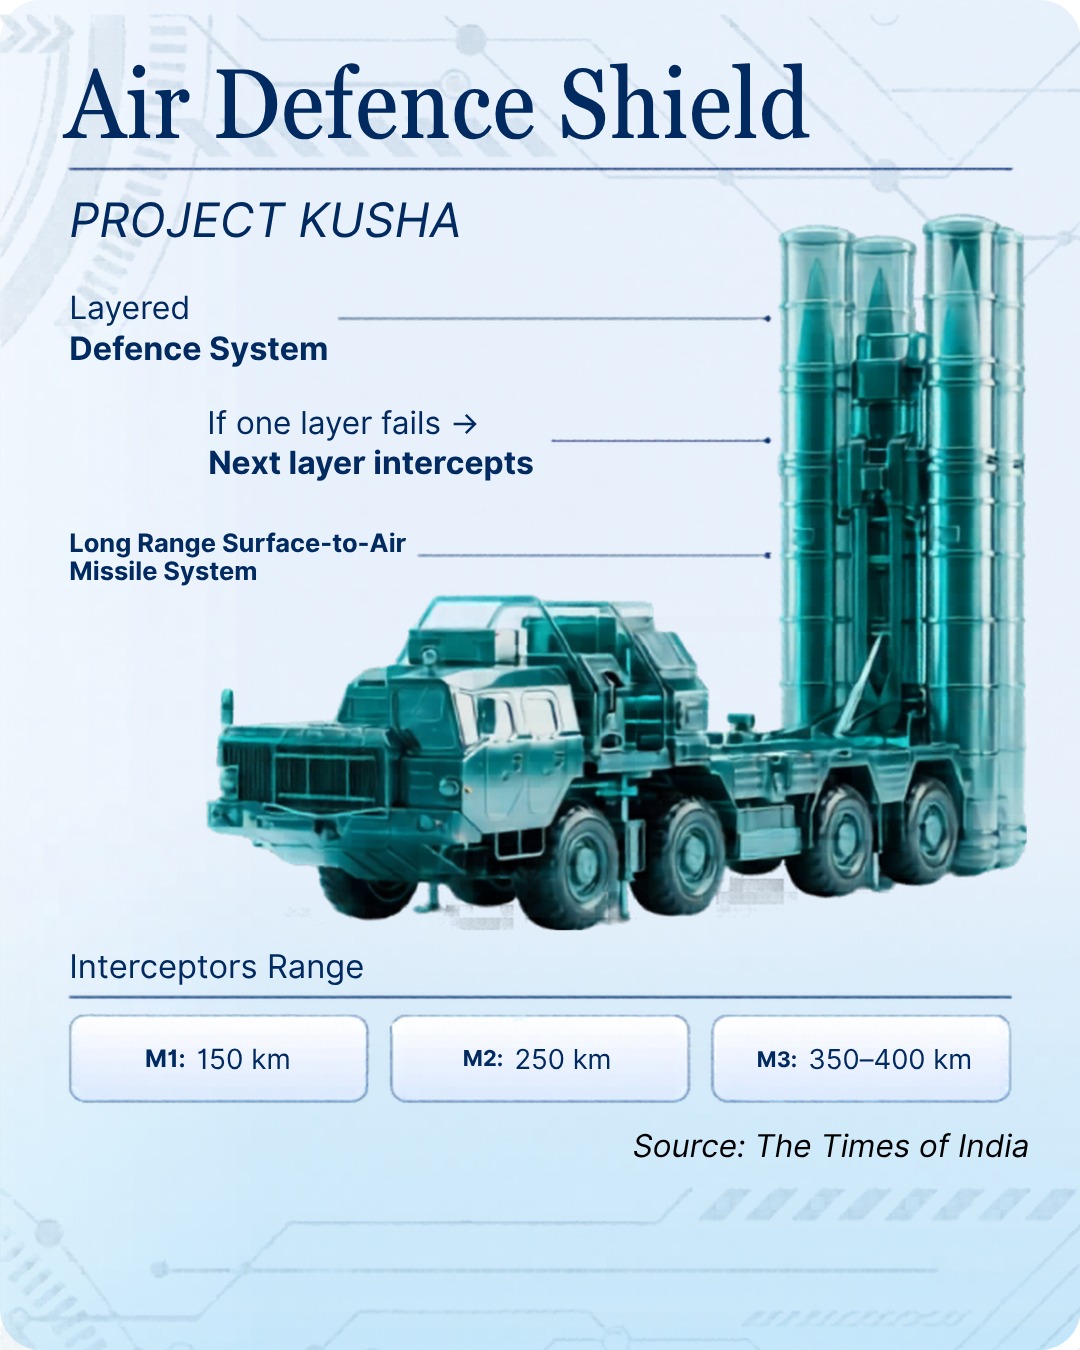
Project Kusha is India’s indigenous alternative, a layered, long-range surface-to-air missile system built around three interceptor variants, each calibrated to a different threat range:
The logic of this tiered design is both elegant and critical. The layered structure ensures that even if one layer is saturated or breached, subsequent layers can engage the target, thereby increasing overall kill probability.
No single point of failure.
No single point of foreign dependence.
And because it is built entirely within India’s own ecosystem, Project Kusha provides full control over software, integration, and future upgrades and integrates seamlessly into India’s Integrated Air Command and Control System.
For investors, this translates into a programme that generates sustained demand across radar systems, propulsion technology, command software, and electronics manufacturing, all increasingly served by domestic players.
Project Kusha addresses the threat in the sky. But modern warfare rarely arrives from a single direction- missiles, drone swarms, cyber-attacks, and strikes on critical infrastructure can arrive simultaneously across multiple fronts. Mission Sudarshan Chakra is built for precisely that reality, a unified, nationwide shield that integrates every layer of India’s defence into one coordinated system.

Announced in August 2025 and drawing its name from the weapon of Lord Krishna, the Sudarshan Chakra Program is India’s most ambitious defence initiative to date, a nationwide defence shield targeting full operational capability by 2035. Its scope goes far beyond what any single system can accomplish.
Providing layered protection for strategic assets and civilian infrastructure while ensuring strategic autonomy through full indigenisation of R&D and manufacturing.
Beyond interception, it will also offer precision counterstrike capacities and anti-cyber warfare measures to neutralise digital threats including hacking and phishing at a national scale.
To appreciate the scale of this ambition, consider the two global benchmarks India is measured against:
1) Israel’s Iron Dome : The 90% Standard
2)The United States’ Golden Dome : The Next Frontier
A) Imagine an Indian Navy submarine, deep underwater, in the middle of a critical wartime operation. It intercepts vital intelligence — but the communication channel back to the control room is compromised, delayed, or worse, decoded by the enemy. In that moment, the advantage doesn’t belong to the side with the bigger fleet.
It belongs to the side with the faster, more secure line of communication. “What makes quantum communication a game-changer is precisely this — if an enemy ever attempts to intercept or decode that communication, the data itself changes and the breach is immediately detected, making undetected eavesdropping physically impossible”.
In modern warfare, that margin — of speed and security — is often the difference between a mission succeeded and a mission lost. That is precisely the problem quantum communication is built to solve.
B) China currently leads in real-world quantum communication deployment, giving it an edge in narrow but sensitive regions where early warning and unbreakable secure links define operational advantage. India is closing that gap faster than most anticipated.
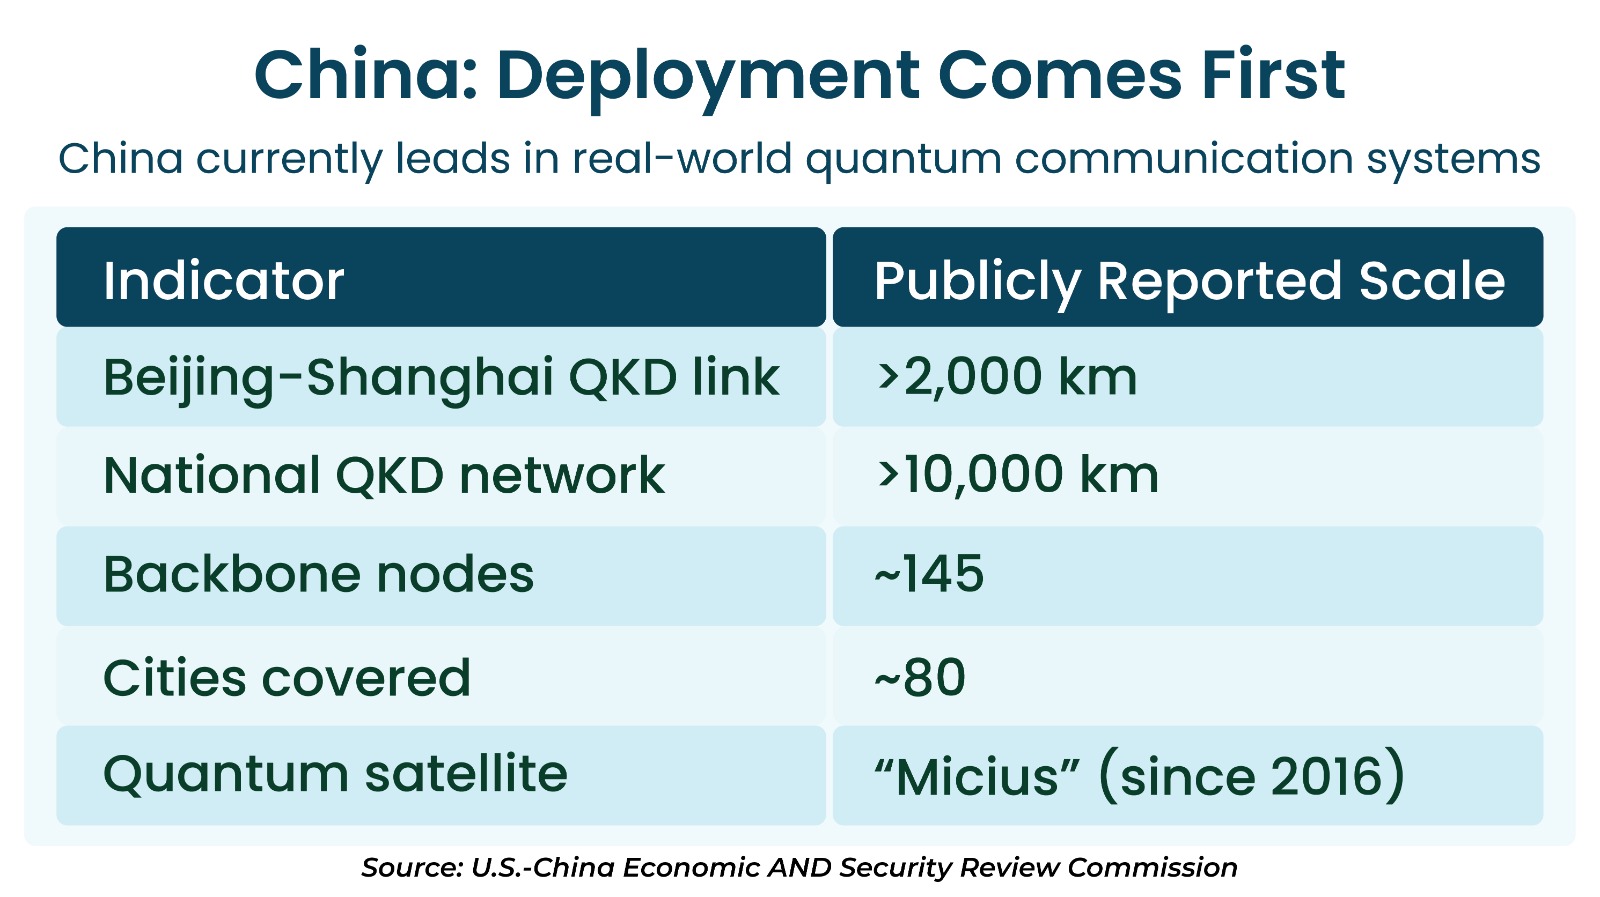
C) India’s National Quantum Mission (NQM) has an ambitious mandate: satellite-based secure quantum communications between ground stations spanning 2,000 kilometres domestically, long-distance quantum-secured channels with partner nations, and inter-city Quantum Key Distribution (QKD) networks.
In January 2026, the mission gained further strategic weight when India unveiled its Military Quantum Mission Policy Framework, embedding four critical pillars of quantum technology across its armed services:
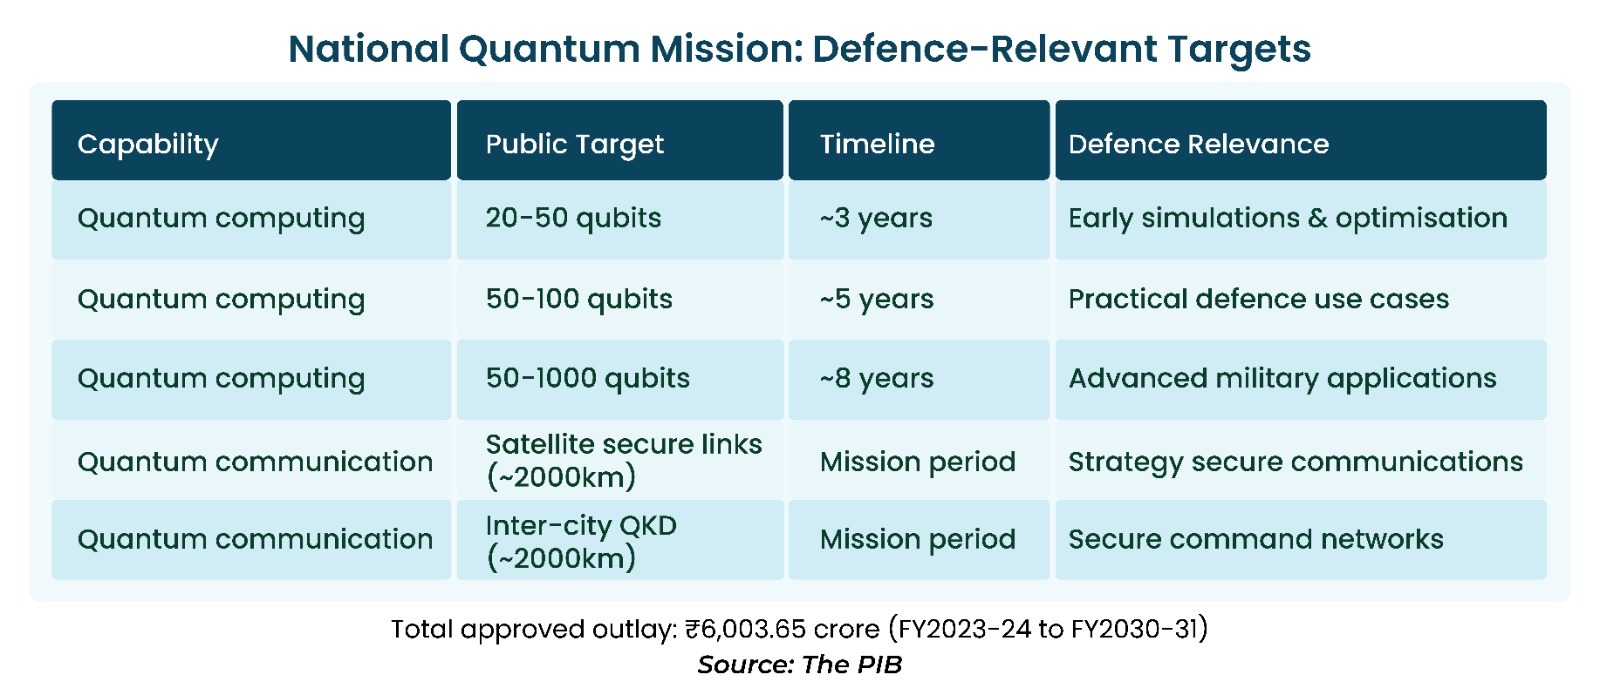
What has made headlines is not merely the ambition but the pace of execution. India achieved a 1,000-kilometre quantum communication network in under two years — a feat originally projected to take eight years. This milestone puts India firmly on course to realise its full 2,000-km vision well ahead of schedule.
D) The implications reach far beyond a laboratory record. This technology delivers interception-proof communication for defence operations, financial systems, and critical national infrastructure — domains where a security breach is not a compliance issue but a national emergency. What makes it even more powerful is its versatility — engineered to function across underwater and underground environments, extending India’s strategic reach into some of the most operationally challenging terrains.
What it watches and how:
In modern warfare, the side that sees first, decides first. SBS-3 ensures India builds those eyes itself.
The capabilities discussed above represent India’s headline programmes, but the pipeline runs deeper. Two additional systems deserve attention from any investor building a view on India’s long-term defence trajectory:
QRSAM — Intercepting Every Threat, From Every Direction
BRAHMOS-II: INDIA’S LEAP INTO HYPERSONIC WARFARE
BrahMos-II is the next leap, a hypersonic weapon being developed jointly by BrahMos Aerospace and DRDO, designed to operate in a domain where very few nations have ever ventured.
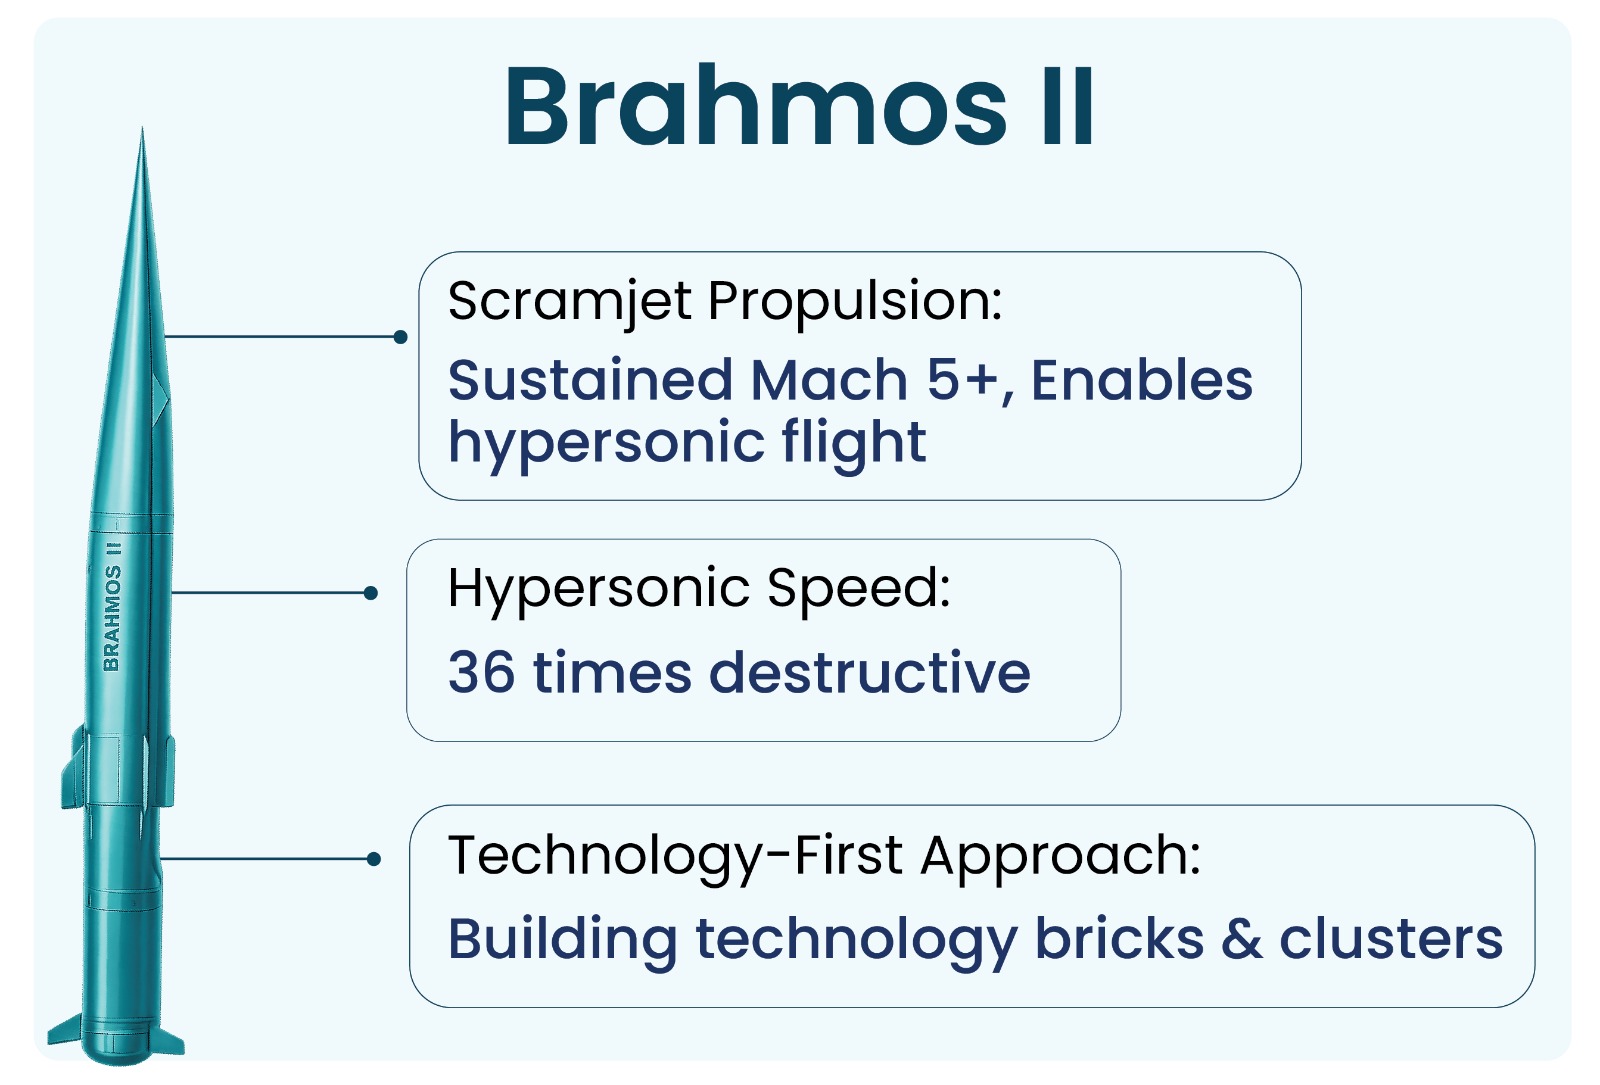
What makes BrahMos-II fundamentally different:
Once developed, BrahMos-II would place India in an elite and exclusive club, where only Russia and China currently hold operational hypersonic cruise missile capability, while the United States, France, Japan, and Australia remain in active development.
For a nation that has historically been a consumer of frontier defence technology, crossing into this league would mark a defining moment in India’s strategic journey.
Step back and look at what India is assembling:
• A sovereign drone industry : spanning offensive strike platforms, loitering munitions, surveillance UAVs, and counter-drone systems
• Project Kusha : layered interceptor shields built entirely within India’s own ecosystem
• Mission Sudarshan Chakra : a nationwide, multi-domain defence umbrella covering air, missile, cyber, and civil defence
• SBS-3 : space-based surveillance watching every border, in real time, through any weather
• Quantum-secured communications : interception-proof links that no adversary can crack
• BrahMos-II : a hypersonic missile programme that would place India in an elite global league
A pattern becomes unmistakable: technology is no longer a supplementary element of India’s defence posture. It is the foundation of it.
Each programme discussed in this blog reflects a deliberate pivot, away from foreign procurement and imported platforms, toward sovereign capabilities engineered for India’s specific threat environment and strategic priorities. That is not a policy trend.
It is a structural economic shift, one that creates a multi-decade procurement pipeline flowing directly into domestic manufacturers, system integrators, electronics companies, and deep-tech startups.
For retail investors, the context is worth holding global uncertainty, geopolitical tensions, supply chain disruptions, and escalating conflicts are making defence self-reliance not just a strategic goal but a commercial imperative.
The Defence Forces Vision 2047 institutionalises this momentum, creating a future-ready military through dedicated Space, Cyber, and Drone Forces and anchoring it to a clear policy roadmap and sustained capital allocation.
As the trajectory of indigenisation accelerates, India is not merely closing the technological gap. It is building a sovereign, technology-driven arsenal one that is purposeful, indigenous, and built for the battles of tomorrow. For the patient investor, that is a story worth tracking from the very beginning.

Aerospace & Defense
India Defence Technology: Sovereignty In The Making
From Sheshnaag drones to Project Kusha and quantum networks — how India defence technology is reshaping the investment case
What does it take to win a war today?Not just soldiers or missiles, but the speed of decision-making, the precision of targeting, and the depth of technological integration across air, land, sea, space, and cyberspace.
The battlefield of the 21st century is a software-defined, data-driven arena and the nations that master this terrain are quietly redrawing the global power map.
India, long categorised as a mass-based military with heavy dependence on foreign procurement, is making a move that most retail investors haven’t fully priced in yet. Quietly but purposefully, it is building a defence architecture that mirrors and – select domains – challenges the technological ambitions of far larger military economies.
This blog unpacks each of those capabilities, the numbers behind them, and why this structural shift matters for investors with a long-term view on India’s defence sector.
Here is a number that reframes how modern conflict works: “Iran’s Missile Math: $20,000 Drones takes on $4 Million Patriots.” In this kind of fight, the attacker doesn’t need to win the sky. It just needs to make the sky unaffordable.
That is the strategic playbook Iran introduced with its Shahed-136 and it is a playbook the world’s major military powers have since adopted.
The United States and Russia followed with their own equivalents: LUCAS and Geran-2 respectively. These are not exotic, high-budget weapons. They are engineered to be cheap, numerous, and relentless.
Broadly, all these low-cost drones operate within comparable performance envelopes:
Why does this matter so deeply for defence strategy and by extension, for investors thinking about where defence budgets will flow? Three structural reasons stand out:
India’s answer to this category and this is where the domestic opportunity begins, the Sheshnaag-150. An indigenous loitering munition with:
It matches the core performance parameters of its global peers.
But matching specs is not what makes the Sheshnaag-150 strategically interesting. The true innovation lies not in its airframe, but in its sophisticated software architecture, often referred to as the “mother-code”, which enables autonomous swarm coordination, mid-mission recalibration, and continued strike effectiveness even when individual units are intercepted or communications are jammed.
That is not an incremental upgrade. That is a doctrinal capability.
If the Sheshnaag-150 is India’s answer to the economics of drone warfare, the Ghatak UCAV is its answer to the physics of it. A jet-powered stealth drone designed to operate where no human pilot can safely go, the Ghatak represents the sharpest edge of India’s indigenous defence technology push.

Three things set Ghatak UCAV apart:
At an estimated $63 million per unit versus $80 million-plus for a conventional fighter jet, the Ghatak delivers equivalent striking power at a meaningful strategic discount.
Ghatak is proof that India’s defence ambition has finally caught up with its technological capability.
Every drone and missile capability India builds on the offensive side raises an equally urgent question on the defensive side: who is protecting Indian airspace from the same threat? That is precisely the gap that Project Kusha is designed to close.
For context, India’s most advanced long-range air defence asset today is the S-400 Triumf System, procured from Russia under a $5.43 billion deal signed in 2018. It is a capable system but it is also a foreign one. That means logistical dependencies, geopolitical strings, and zero control over software, integration pathways, or future upgrades.

Project Kusha is India’s indigenous alternative; a layered, long-range surface-to-air missile system built around three interceptor variants, each calibrated to a different threat range:
The layered structure ensures that even if one layer is saturated or breached, subsequent layers can engage the target, thereby increasing overall kill probability. No single point of failure. No single point of foreign dependence.
And because it is built entirely within India’s own ecosystem, Project Kusha provides full control over software, integration, and future upgrades and integrates seamlessly into India’s Integrated Air Command and Control System.
For investors, this translates into a programme that generates sustained demand across radar systems, propulsion technology, command software, and electronics manufacturing, all increasingly served by domestic players.
Project Kusha protects airspace. But what if the threat is not just from the air, but from missiles, drones, cyber intrusions, and physical attacks arriving simultaneously across multiple vectors? That is the scenario that Mission Sudarshan Chakra is built for.

Announced in August 2025 and drawing its name from the weapon of Lord Krishna, the Sudarshan Chakra Program is India’s most ambitious defence initiative to date, a nationwide defence shield targeting full operational capability by 2035.
Its scope goes far beyond what any single system can accomplish. It is a multi-tiered air defence system that integrates: Air defence, Missile defence, Counter-drone technologies, Cyber protection and Civil defence measures
Providing layered protection for strategic assets and civilian infrastructure while ensuring strategic autonomy through full indigenisation of R&D and manufacturing. Beyond interception, it will also offer precision counterstrike capacities and anti-cyber warfare measures to neutralise digital threats including hacking and phishing at a national scale.
To appreciate the scale of this ambition, consider the two global benchmarks India is measured against:
India’s Sudarshan Chakra sits in this company — not as an imitation of either system, but as a sovereign, full-spectrum architecture designed around India’s own strategic reality.
In defence, as in investing, excellence often comes from the barest of margins. The ability to intercept a threat five seconds faster, to receive intelligence that the adversary cannot decode, these micro-advantages compound into decisive strategic superiority.That is the domain of quantum communication.
China currently leads in real-world quantum communication deployment, giving it an edge in narrow but sensitive regions where early warning and unbreakable secure links define operational advantage. India is closing that gap faster than most anticipated.
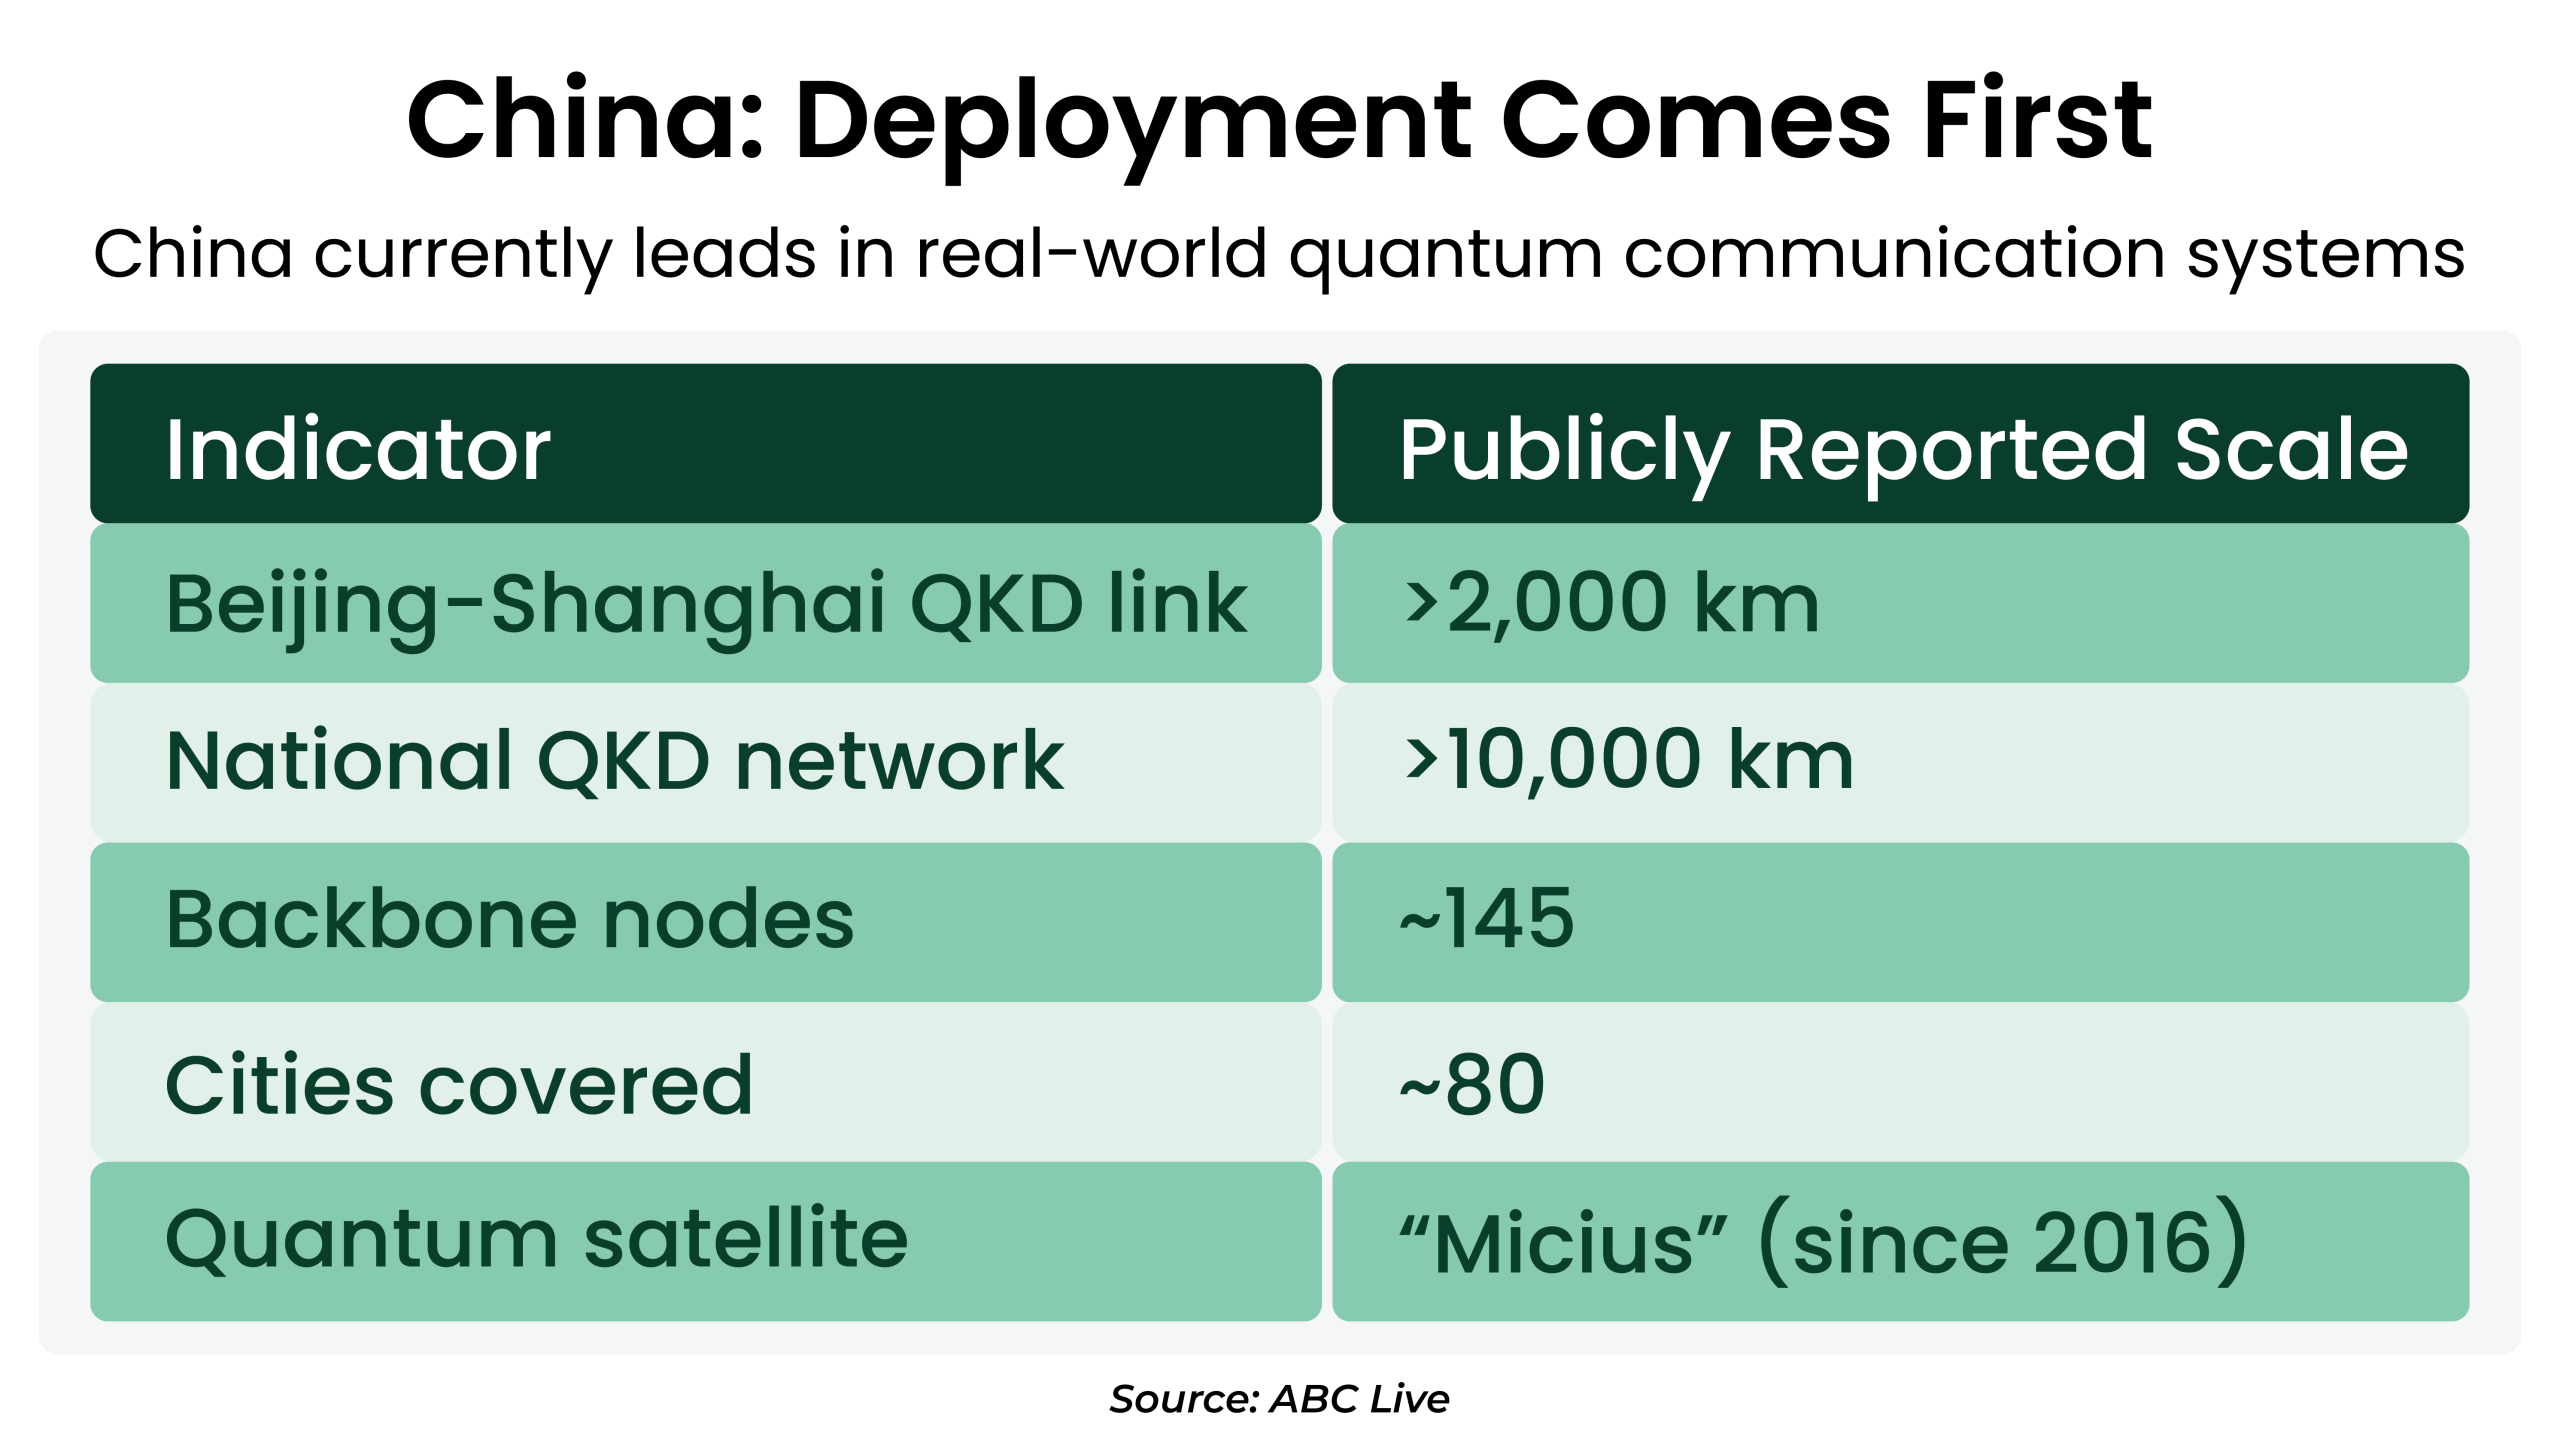
India’s National Quantum Mission (NQM) has an ambitious mandate: satellite-based secure quantum communications between ground stations spanning 2,000 kilometres domestically, long-distance quantum-secured channels with partner nations, and inter-city Quantum Key Distribution (QKD) networks.
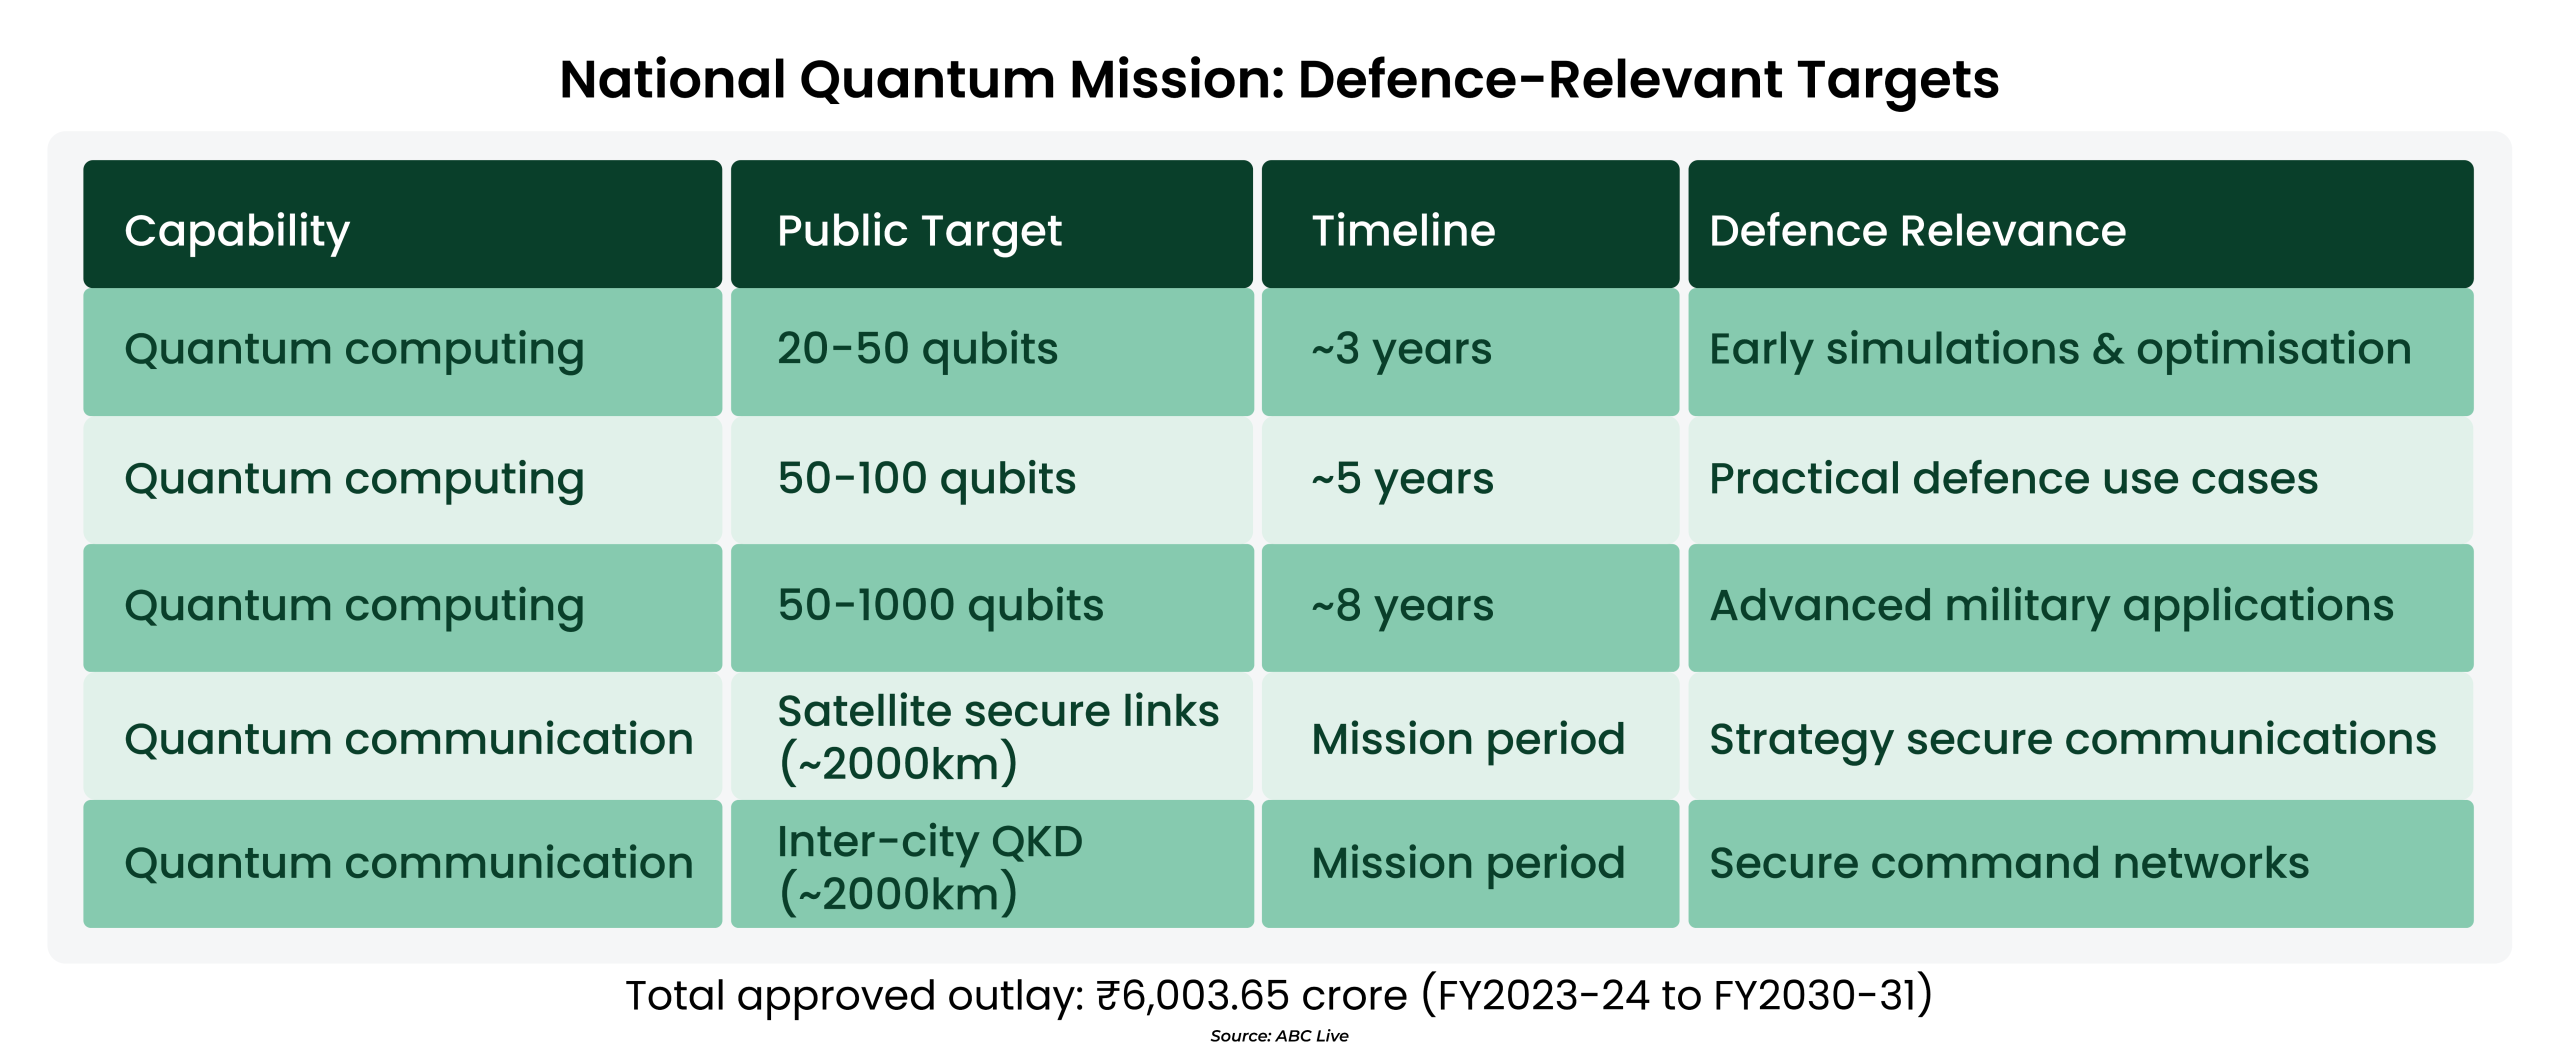
In January 2026, the mission gained further strategic weight when India unveiled its Military Quantum Mission Policy Framework — embedding four critical pillars of quantum technology across its armed services:
What has made headlines is not merely the ambition but the pace of execution. India achieved a 1,000-kilometre quantum communication network in under two years, a feat originally projected to take eight years. This milestone puts India firmly on course to realise its full 2,000-km vision well ahead of schedule.
The implications reach far beyond a laboratory record. This technology delivers interception-proof communication for defence operations, financial systems, and critical national infrastructure, domains where a security breach is not a compliance issue but a national emergency. What makes it even more powerful is its versatility, engineered to function across underwater and underground environments, extending India’s strategic reach into some of the most operationally challenging terrains.
The capabilities discussed above represent India’s headline programmes — but the pipeline runs deeper. Three additional systems deserve attention from any investor building a view on India’s long-term defence trajectory:
SBS-III : India’s 52-Satellite Surveillance Network
QRSAM : Intercepting Every Threat, From Every Direction
BrahMos : From Deterrence to Export Revenue
BrahMos marks an inflection point that is easy to understate: India is no longer just a buyer in the global arms market. It is becoming a seller — and that changes the economic calculus of defence investment entirely.
Step back and look at what India is assembling — drone swarms with autonomous software brains, layered interceptor shields, a nationwide multi-domain defence umbrella, space-based surveillance, and quantum-secured communications. A pattern becomes unmistakable: technology is no longer a supplementary element of India’s defence posture. It is the foundation of it.
Each programme in this blog reflects a deliberate pivot: away from foreign procurement and imported platforms, toward sovereign capabilities engineered for India’s specific threat environment and strategic priorities. That is not a policy trend. It is a structural economic shift — one that creates a multi-decade procurement pipeline flowing directly into domestic manufacturers, system integrators, electronics companies, and deep-tech startups.
For retail investors, the context is worth holding: global uncertainty, geopolitical tensions, supply chain disruptions, and escalating conflicts are making defence self-reliance not just a strategic goal but a commercial imperative. The “Defence Forces Vision 2047” institutionalises this momentum — creating a future-ready military through dedicated Space, Cyber, and Drone Forces — and anchoring it to a clear policy roadmap and sustained capital allocation.
As the trajectory of indigenisation accelerates, India is not merely closing the technological gap. It is building a sovereign, data-driven arsenal that redefines its strategic standing on the world stage. For the patient investor, that is a story worth tracking from the very beginning.
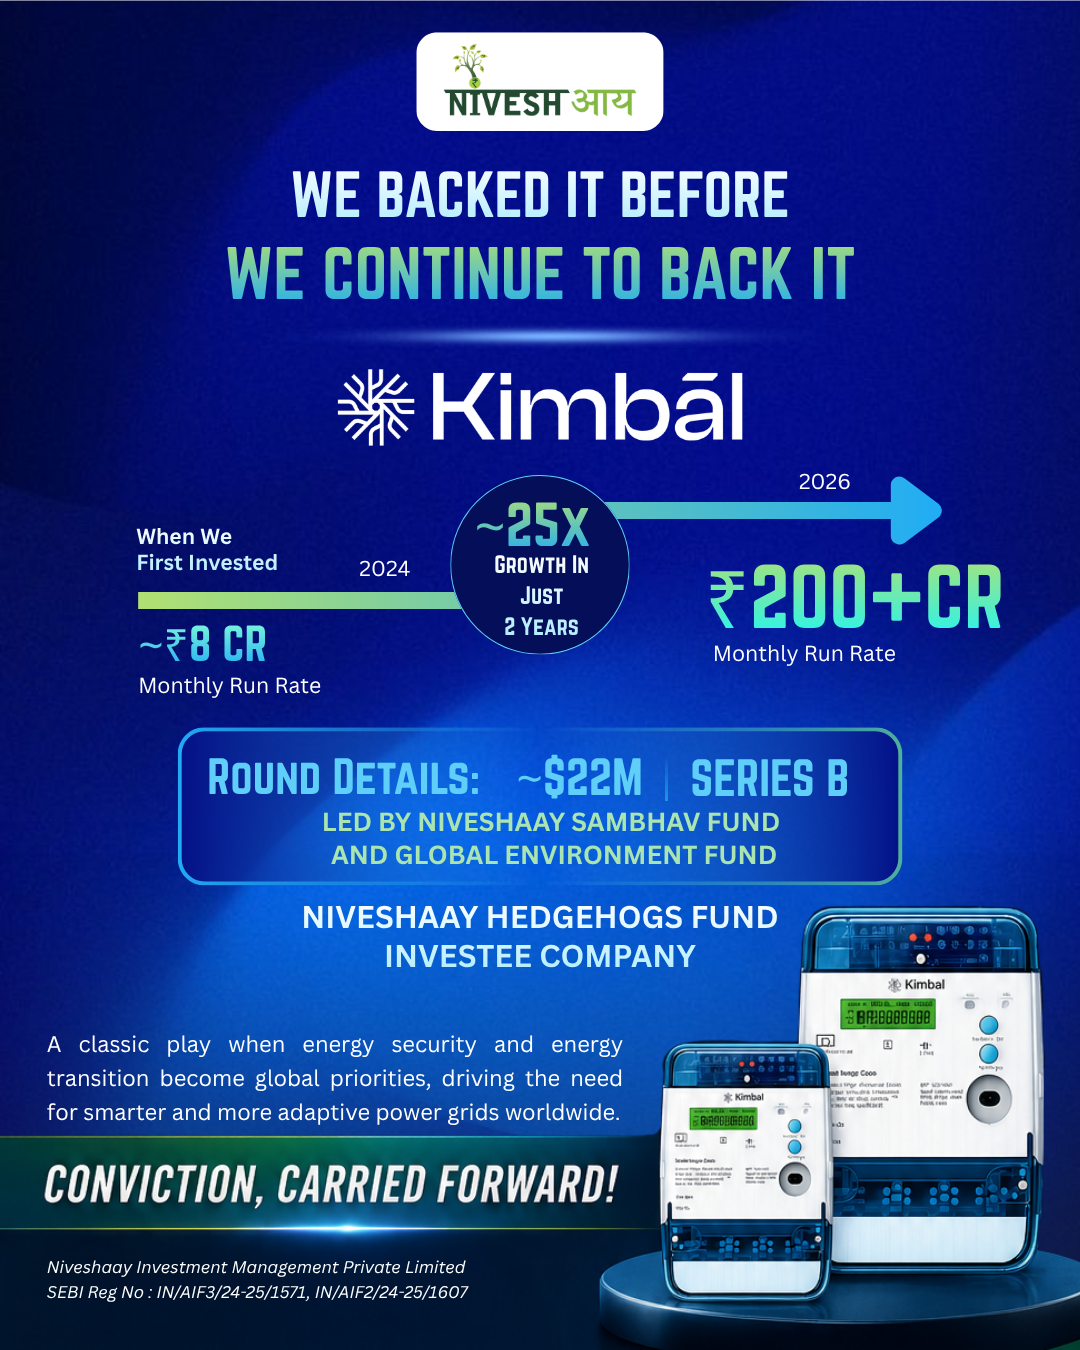
Power & Renewable Energy
Backing conviction. Scaling with intent – Kimbal
Kimbal raises USD 22 million in Series B led by GEF Capital, with Niveshaay backing the company for the third consecutive round
We at Niveshaay, through Hedgehogs Fund are proud to have been an early backer and now participate through the Niveshaay Sambhav Fund, alongside GEF, and remain excited about Kimbal’s journey ahead. This also marks our third consecutive investment in the company, reflecting our continued conviction and long-term partnership as Kimbal scales.
It has been an incredible journey to witness Kimbal grow from a monthly run rate of ₹7–8 crore at the time of our first investment to crossing ₹200+ crore within just two years.
From our very first meeting with Ayush, it was clear that he had a deep understanding of the Energy Transition opportunity and a long-term vision for the sector. Even then, smart meters appeared to be only the starting point—the foundation for building something much larger.
In one of the most important themes of this decade, Kimbal has built scalable products for India and is now expanding into international markets. The company’s agility, along with Ayush’s ability to attract top global talent, continues to keep it ahead of the curve.
We are really excited to have GEF Capital partnering with us for the journey ahead. Their proven track record of identifying and backing established leaders—such as Syrma SGS Technology, Premier Energies, Prince Pipes and Fittings, and ESDS Software Solution reflects their strong capability in identifying market winners.
This is a highly exciting phase as energy security and energy transition become global priorities, driving the need for smarter and more adaptive power grids worldwide.
This milestone has also been recognised across leading publications:
https://inc42.com/buzz/kimbal-bags-22-mn-to-scale-smart-grid-solutions-globally/
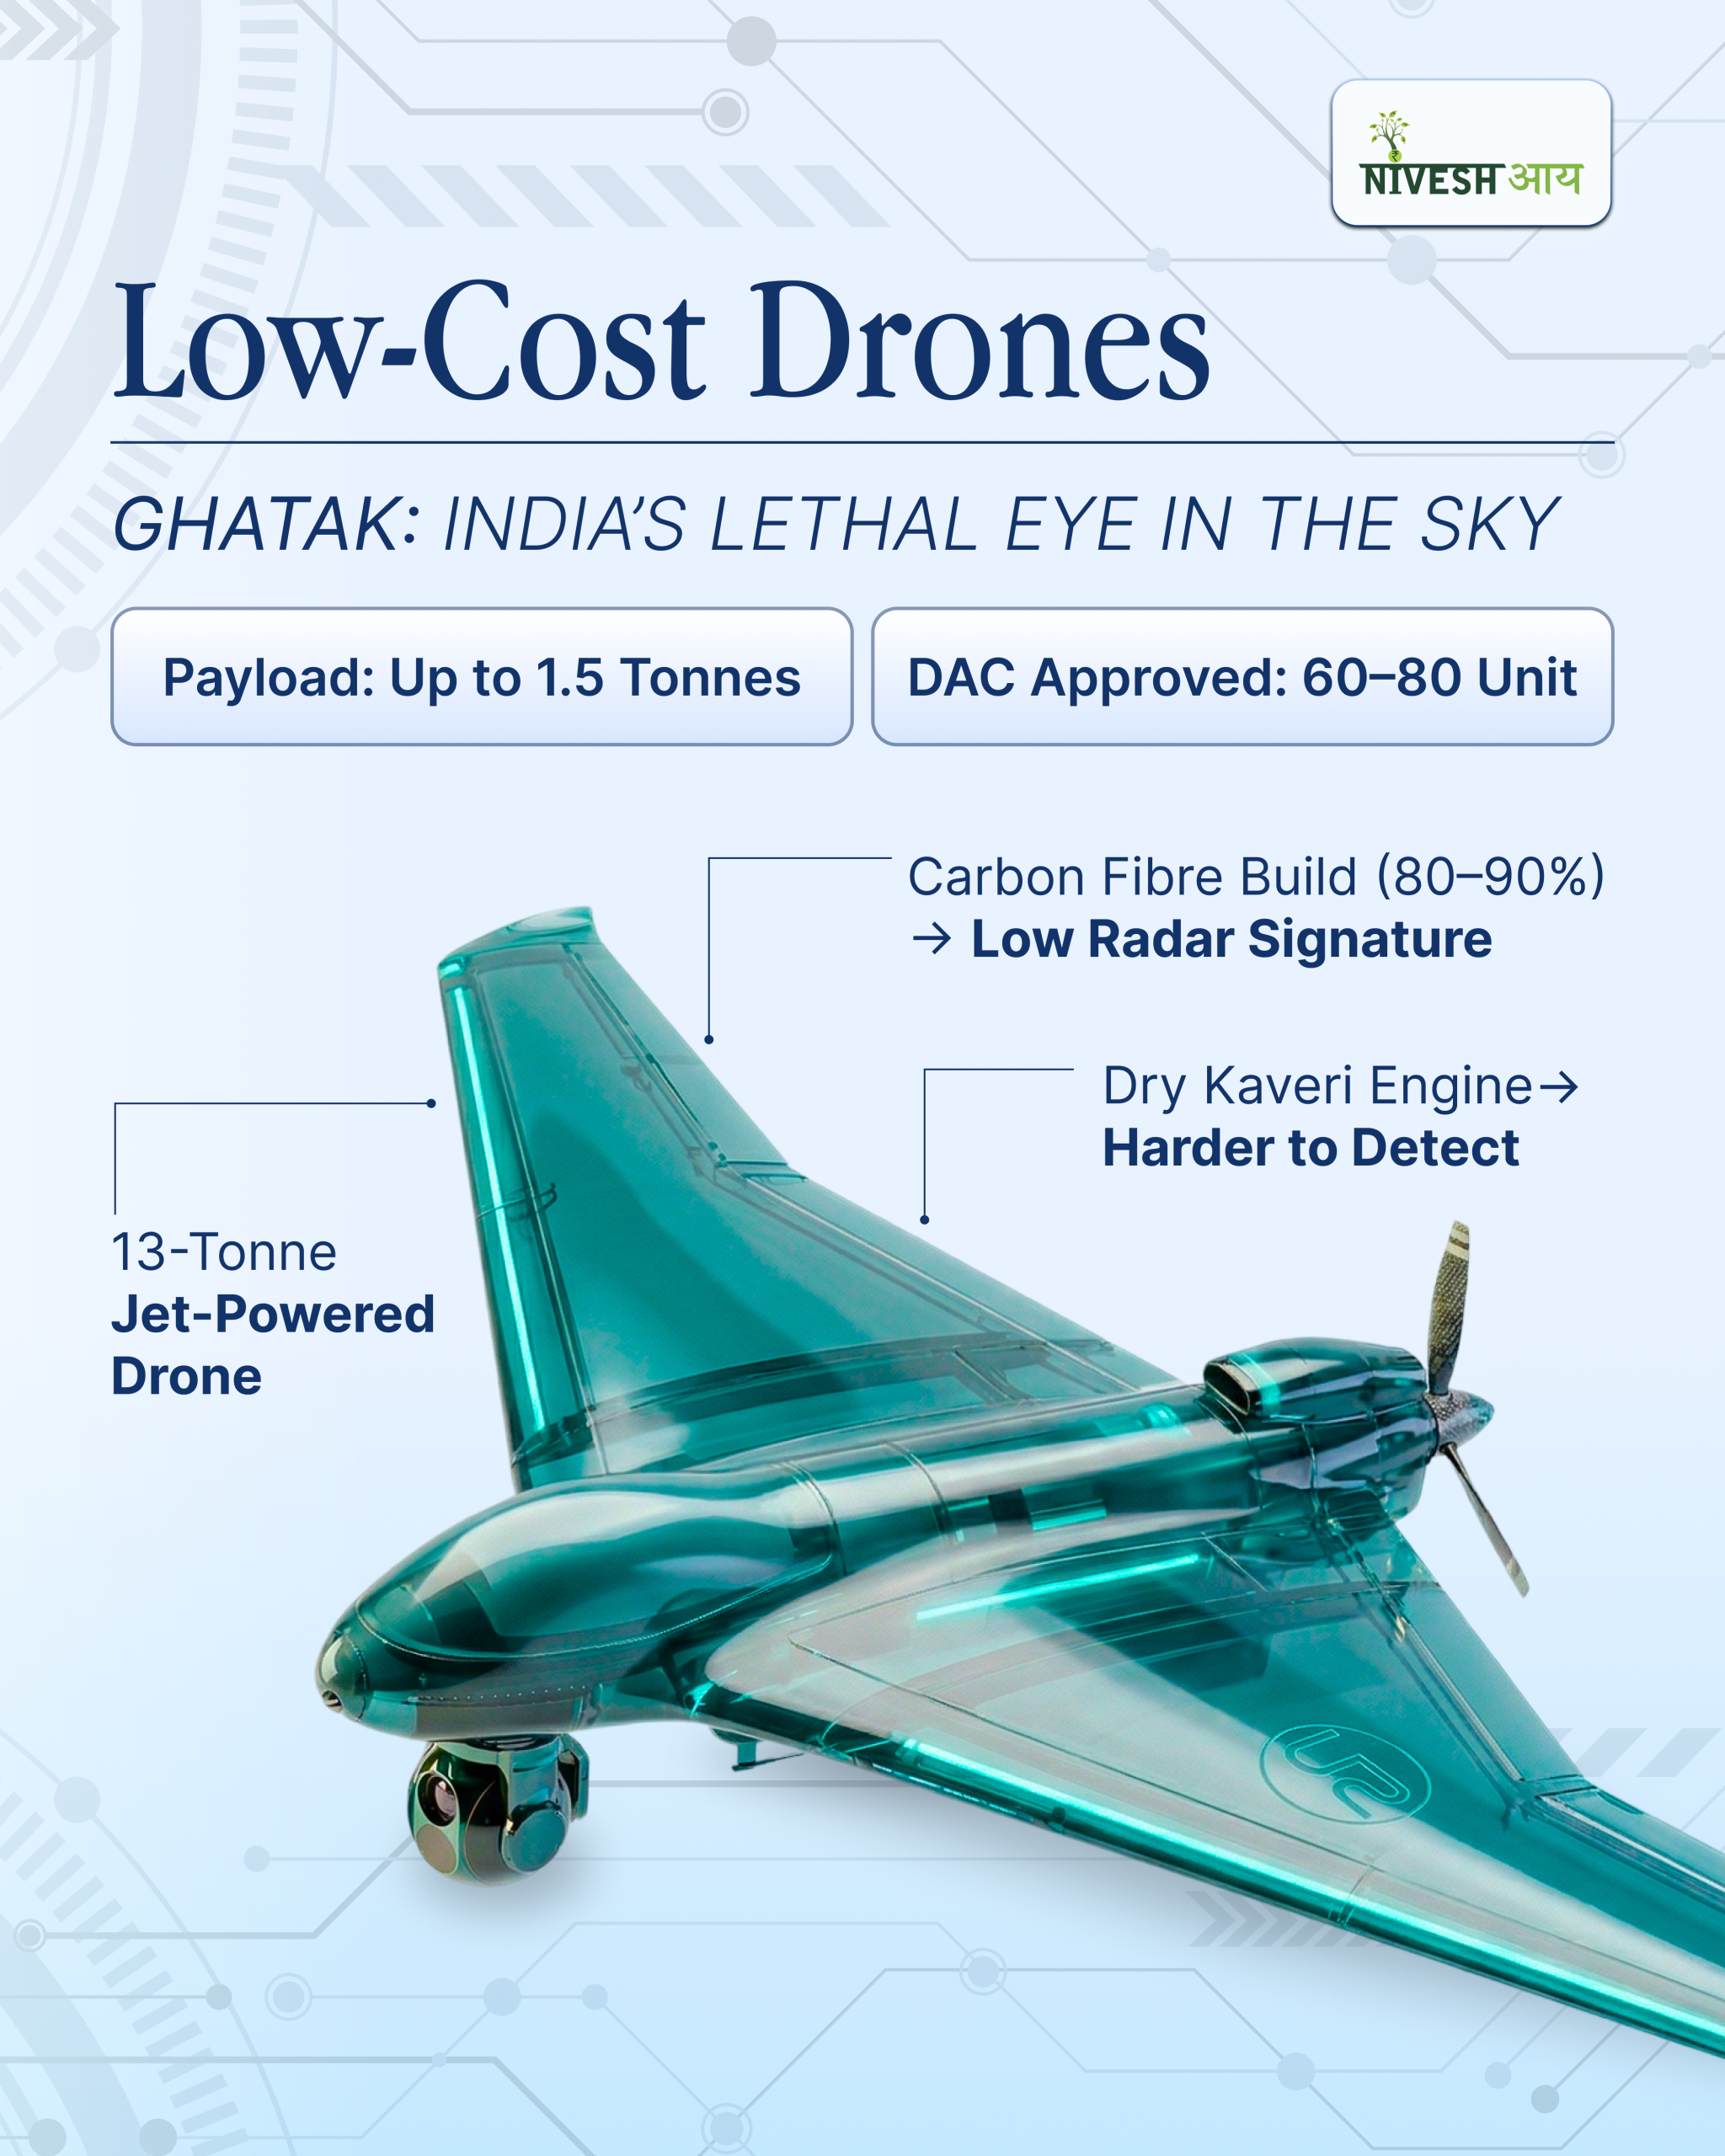
Space Ecosystem
Technology in Indian Defence & its Innovation
Explore Technology in Indian Defence : Quantum communications, AI surveillance, low-cost drones, and C4ISR frameworks reshaping modern military strategy.

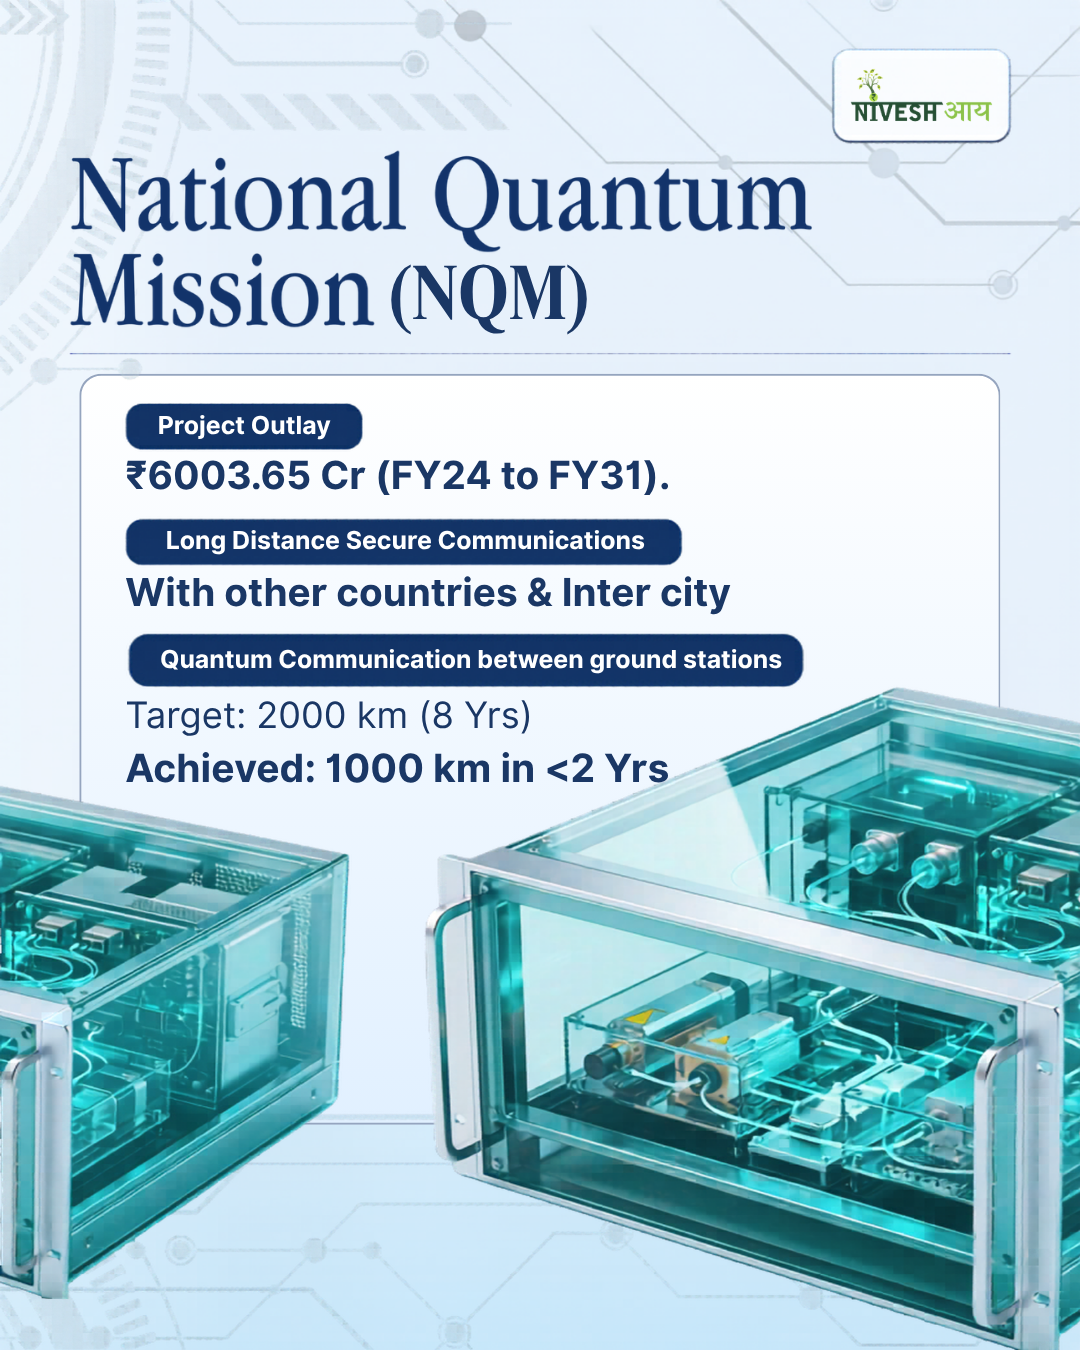


Modern warfare is being redefined by technology in Indian defence, not strength. Speed, precision, and intelligence now dominate military superiority globally.
Low-cost alternatives are challenging expensive defence systems economically today. $20,000 drones are effectively pitting against $4million-dollar defence system.
Technology in Indian defence is being strengthened through five critical initiatives simultaneously.
1) Project Kusha:For indigenous air defence
2) Ghatak: India’s low cost drone
3) National Quantum Mission (NQM): Achieving 1000 km QCN in under 2 years against an 8-year target.
4) SBS-III: 52-satellite surveillance network.
5) Akashteer: A warfare built on C4ISR framework
Quantum communications in technology in Indian defence have achieved 1000 km range. Targets were surpassed, originally planned for 8 years, accomplished in under 2 years.
India’s defence ecosystem is being anchored on indigenous technology development firmly. Self-reliance is being prioritized across all major defence sector initiatives currently.
Long-duration structural investment opportunities are being created through technology in Indian defence. Strategic transformation across all defence sectors is witnessed simultaneously now.
For details you can visit our website here:
📌https://niveshaay.smallcase.com/
Explore our Blog section here:
📌https://niveshaay.com/blog-type/deep-dives/

AI & Data Center
AI Chip Shortage 2026: How DRAM Crisis Is Driving Refurbished Electronics Growth in India
AI Chip Shortage 2026 is crushing global DRAM supply. New PC prices are up 17% and refurbished electronics are emerging as India's boldest opportunity now.
Every gold rush has its miners and its merchants. The AI boom has minted fortunes for chip manufacturers and data center giants, but beneath the surface of this trillion-dollar wave, a far humbler industry is riding the tide to unexpected prosperity.
Refurbished laptops, once dismissed as the budget buyer’s consolation prize, are now having their moment. The question worth asking is why.
The Memory Chip Crisis: AI’s Insatiable Hunger is Draining Global Supply
A quiet crisis is spreading through the global technology supply chain and this time, the usual suspects aren’t entirely to blame.
Voices as prominent as Elon Musk and Tim Cook are sounding the same alarm: a memory chip shortage is quietly hammering profits, derailing product roadmaps, and inflating the price of everything from laptops and smartphones to cars and data centers. And the worst, they warn, is still ahead.
The cause isn’t a natural disaster or a geopolitical skirmish. It’s ambition. The memory industry has pivoted decisively, almost entirely toward, serving AI.
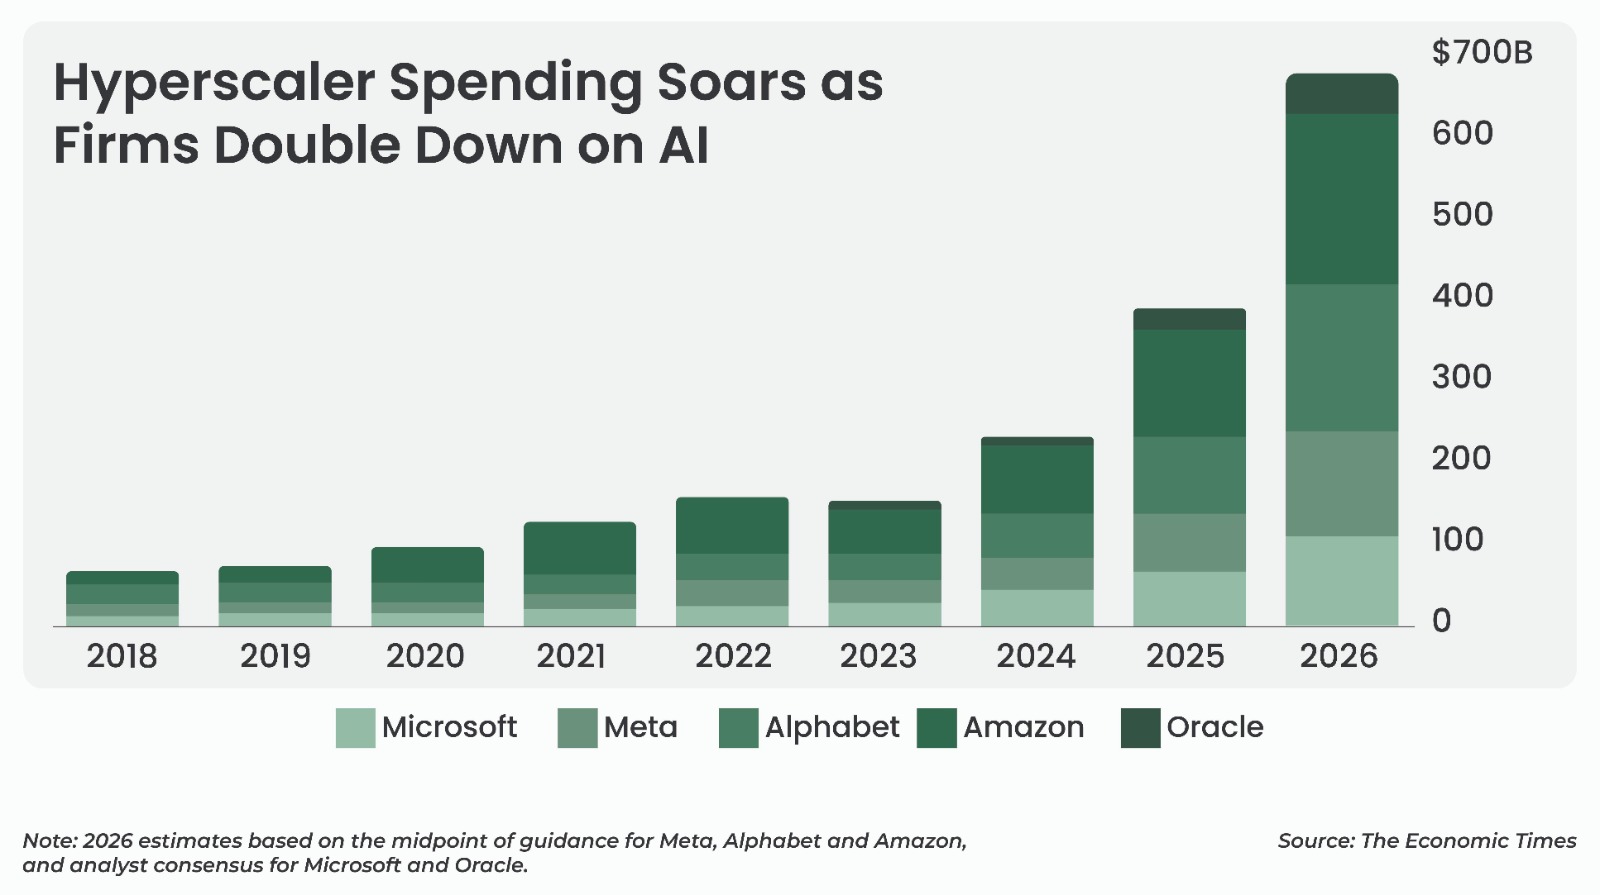
To understand why, follow the money. Hyperscaler spending on AI data centers has compounded at a staggering pace:
The big four tech firms are outbidding each other and everyone else, for the components, infrastructure, and talent that make AI possible. Every dollar spent by a hyperscaler on AI infrastructure is a dollar pulling memory supply away from the devices sitting in your shopping cart.
Why AI is consuming memory chips at an unprecedented rate?
That’s left consumer electronics producers fighting over a dwindling supply of chips from the likes of Samsung Electronics Co, SK Hynix and Micron.
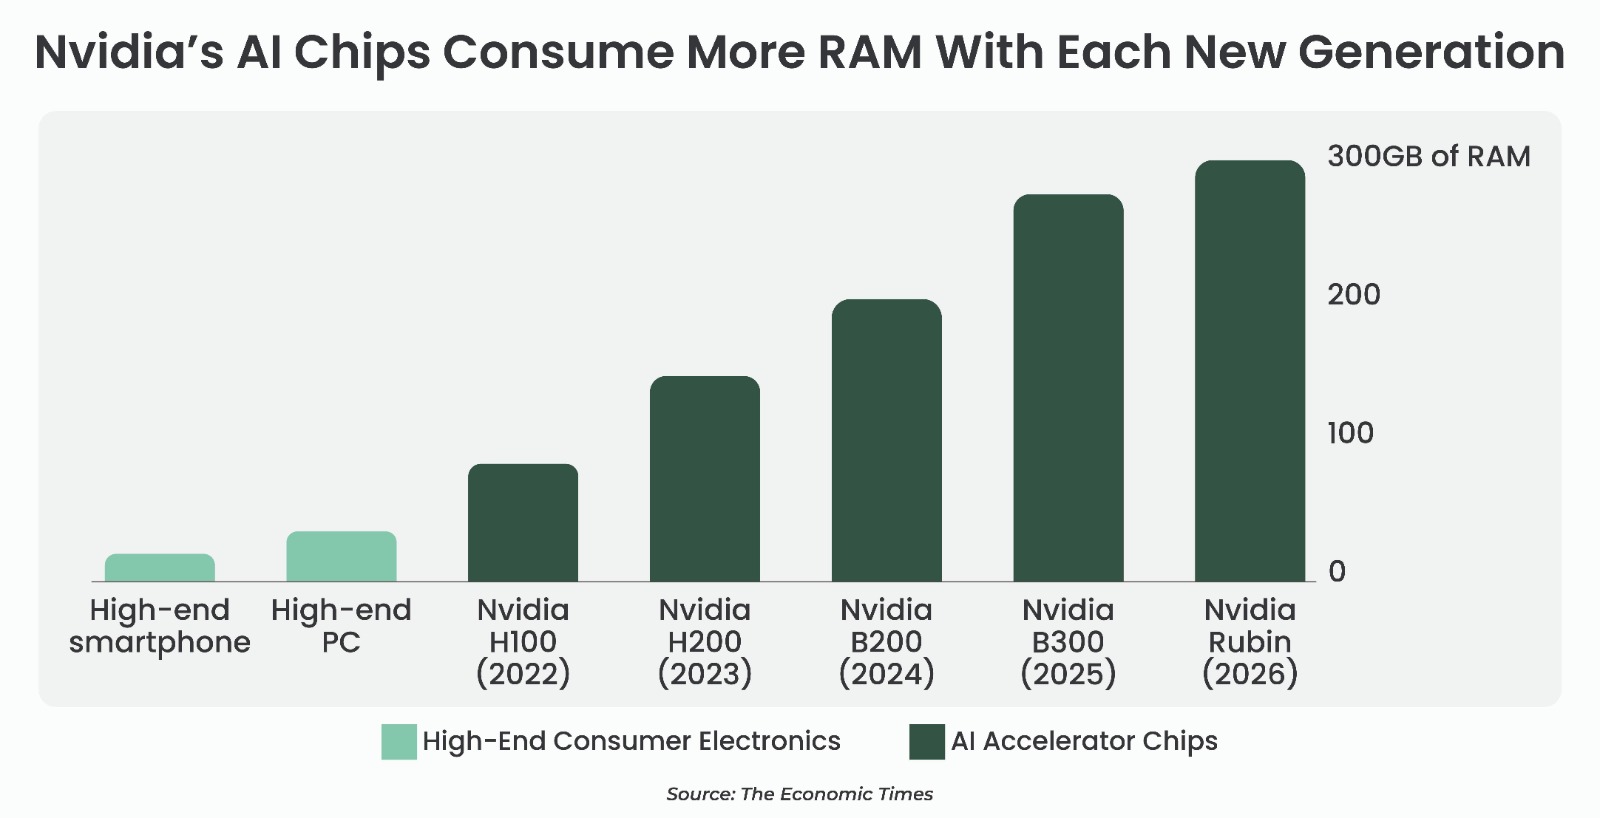
What’s worrying about the trend is that prices are soaring and supplies are running dry even before the AI giants really get going with their data center construction plans.
Alphabet & Amazon’s unprecedented capital expenditure plans for 2026: Alphabet plans to spend $185 billion and Amazon $200 billion – more money than any company in history has poured into capital expenditures in a single year.
Memory chip supply is dangerously concentrated
More importantly, Samsung is no longer chasing volumes it is chasing margins. The strategic pivot toward high-margin AI memory over commoditized DRAM highlights a clear industry shift:
AI demand isn’t just boosting volumes; it’s structurally improving profitability.
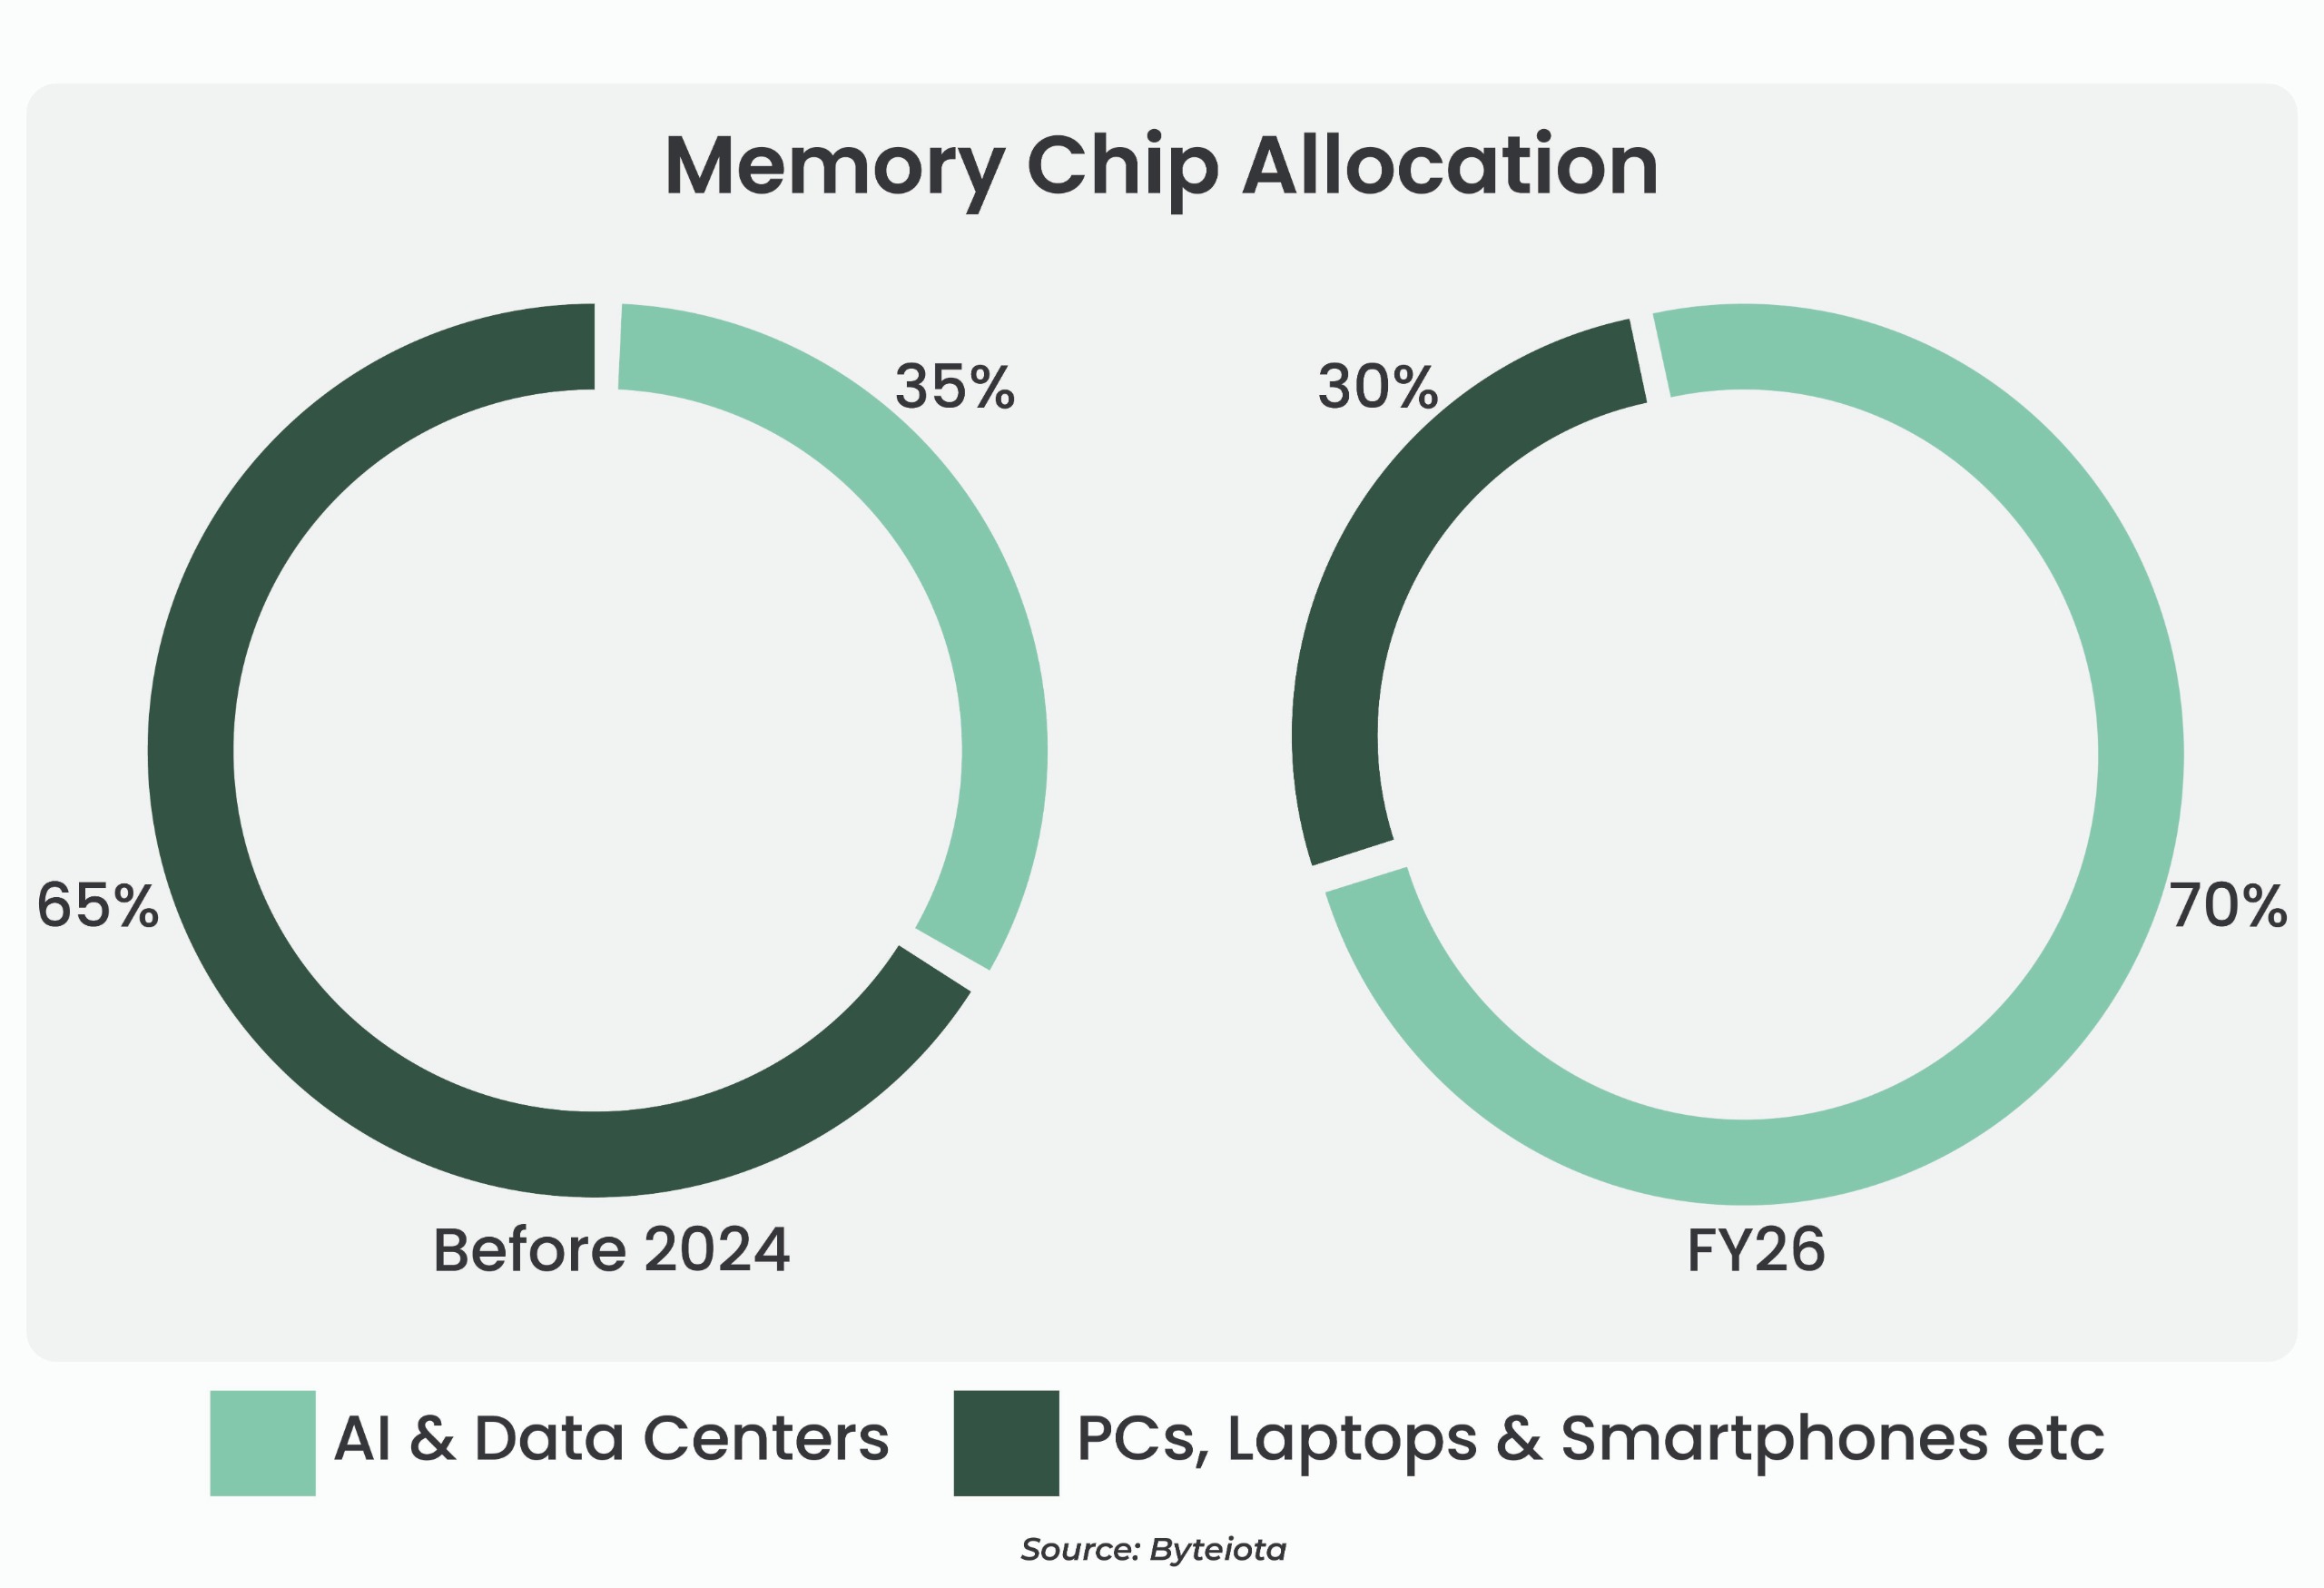
The demand for HBM’s will increase 70% year over year in 2026 alone, Taipei based consultancy TrendForce estimates.
The CEO of the Lenovo Group Yang Yuanqing stated “This structural imbalance between supply and demand is not simply a short-term fluctuation”, as he explained that the crunch will last at least through the rest of the year.
HP’s CEO Bruce Broussard highlighted that the company is witnessing rising input costs, largely driven by increases in DRAM and NAND prices.
He also expects this volatility to persist through FY2026 and likely extend into FY2027. HP stated that Memory now accounts for 35% of PC bill of materials, up from 15-18% last quarter
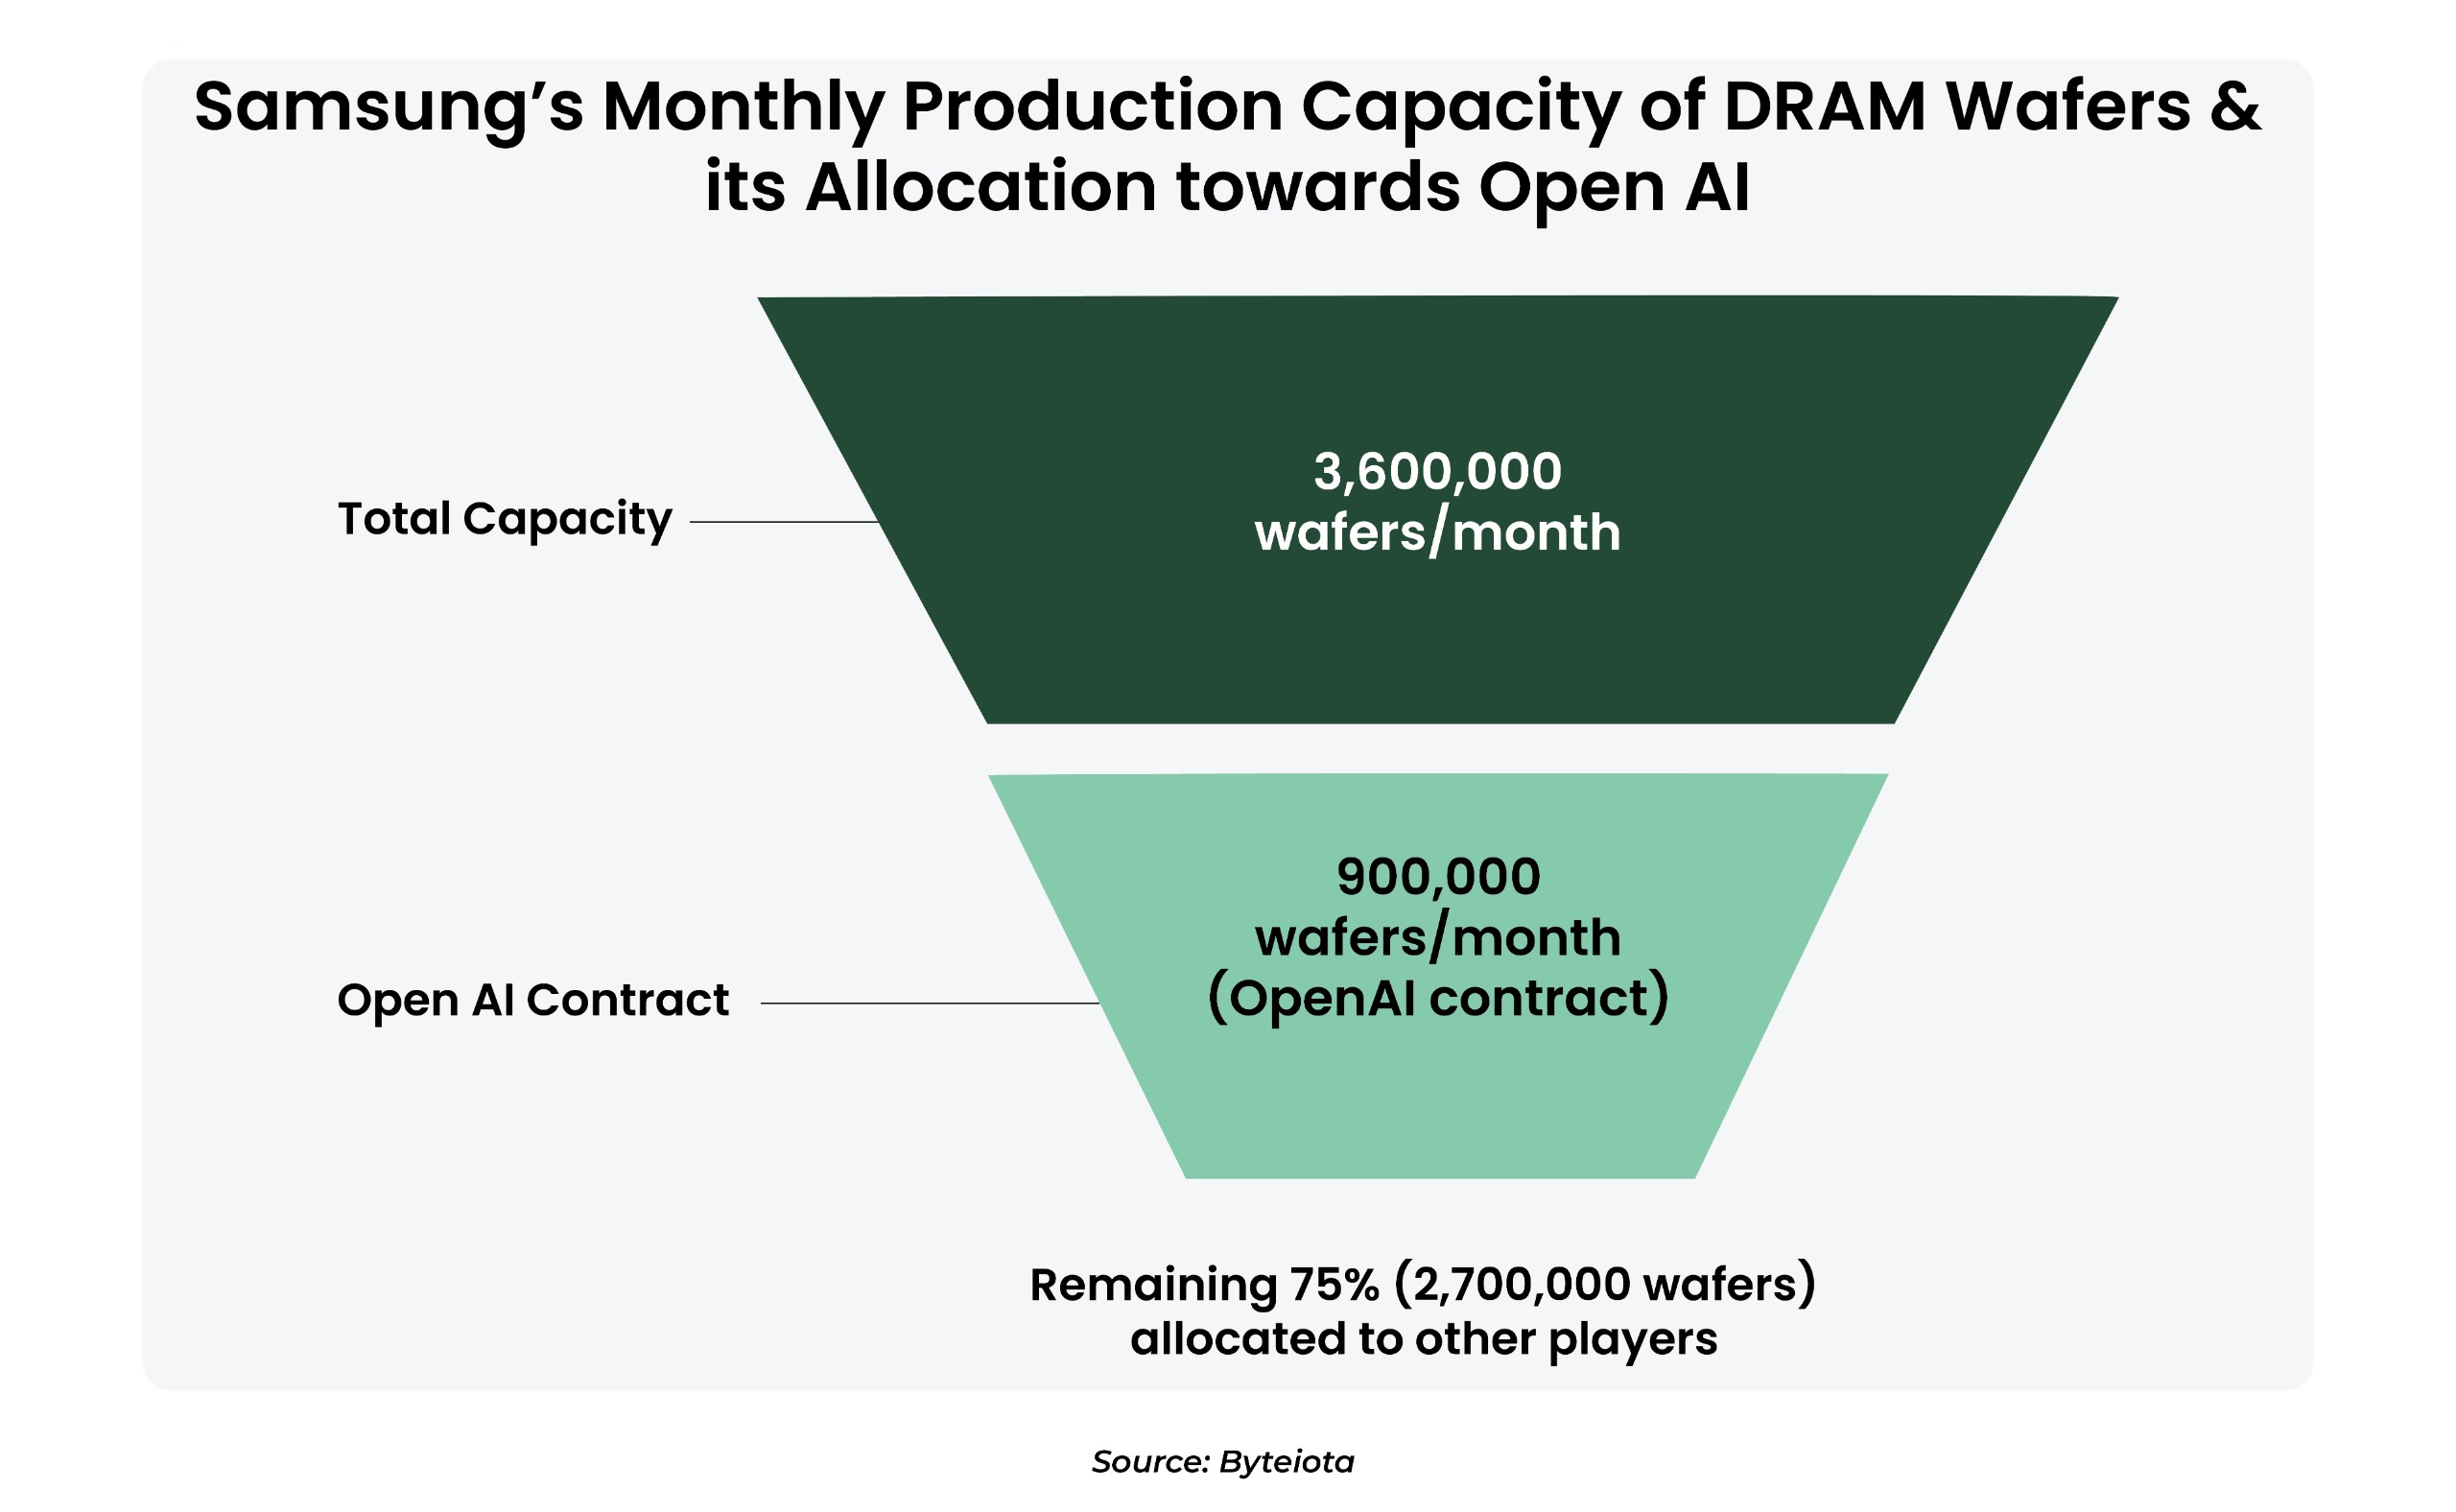
As per a report from Gartner, the domino effect will be observed directly in the prices of PCs & Smartphones:
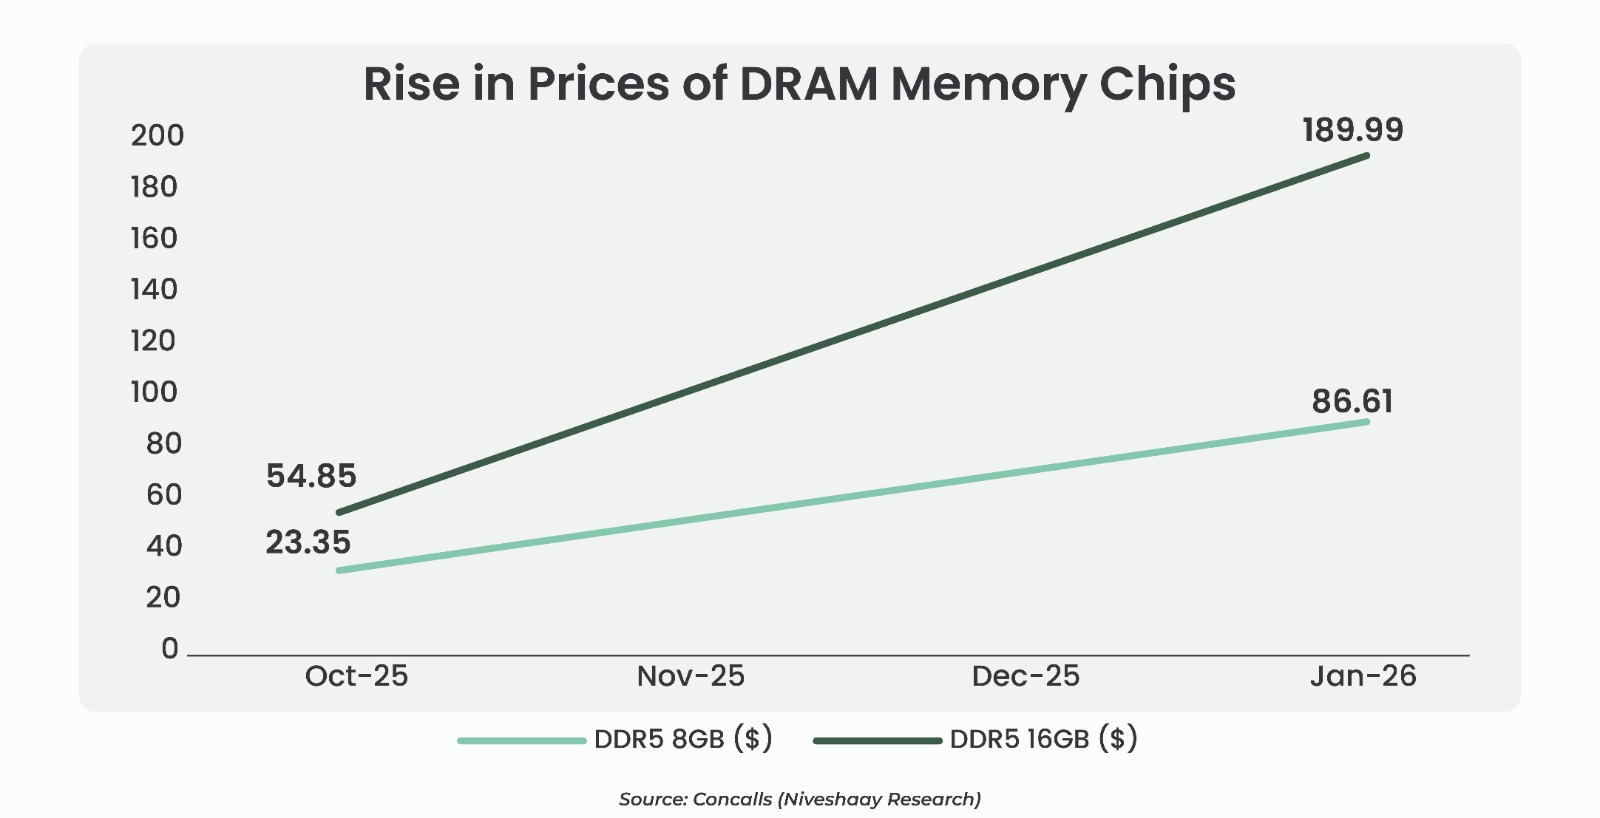
Major corporations including Apple, Lenovo, Dell, HP, Acer & ASUS have all signaled production constraints or warned of 15-20% price hike. The strategic shift has caused a “zero-sum game” where every chip produced for an AI server is a chip denied to a laptop or PC.
When AI Eats DRAM: The Refurbished Surge
The AI infrastructure boom has a hidden casualty: the affordable laptop. With DRAM and NAND flash prices surging 3–4x as chipmakers redirect premium memory toward hyperscaler GPU clusters and high-bandwidth AI accelerators, the sub-₹40,000 laptop, once the backbone of India’s mass-market PC segment, is quietly vanishing from shelves.
But as Churchill once observed, “A pessimist sees the difficulty in every opportunity; an optimist sees the opportunity in every difficulty.” For refurbished electronics players with the right operational infrastructure, this macro dislocation is not a headwind. It is a structural tailwind.
The proof is already in the numbers. Europe’s leading electronics retailer Ceconomy reported refurbished unit sales growth of nearly 400%, a signal too loud to ignore. And recognising where the market is heading, Ceconomy didn’t just watch, it launched its own private label, “Media Markt Refurbished,” in November 2025, moving from a passive marketplace host to an active participant in the refurbished economy.
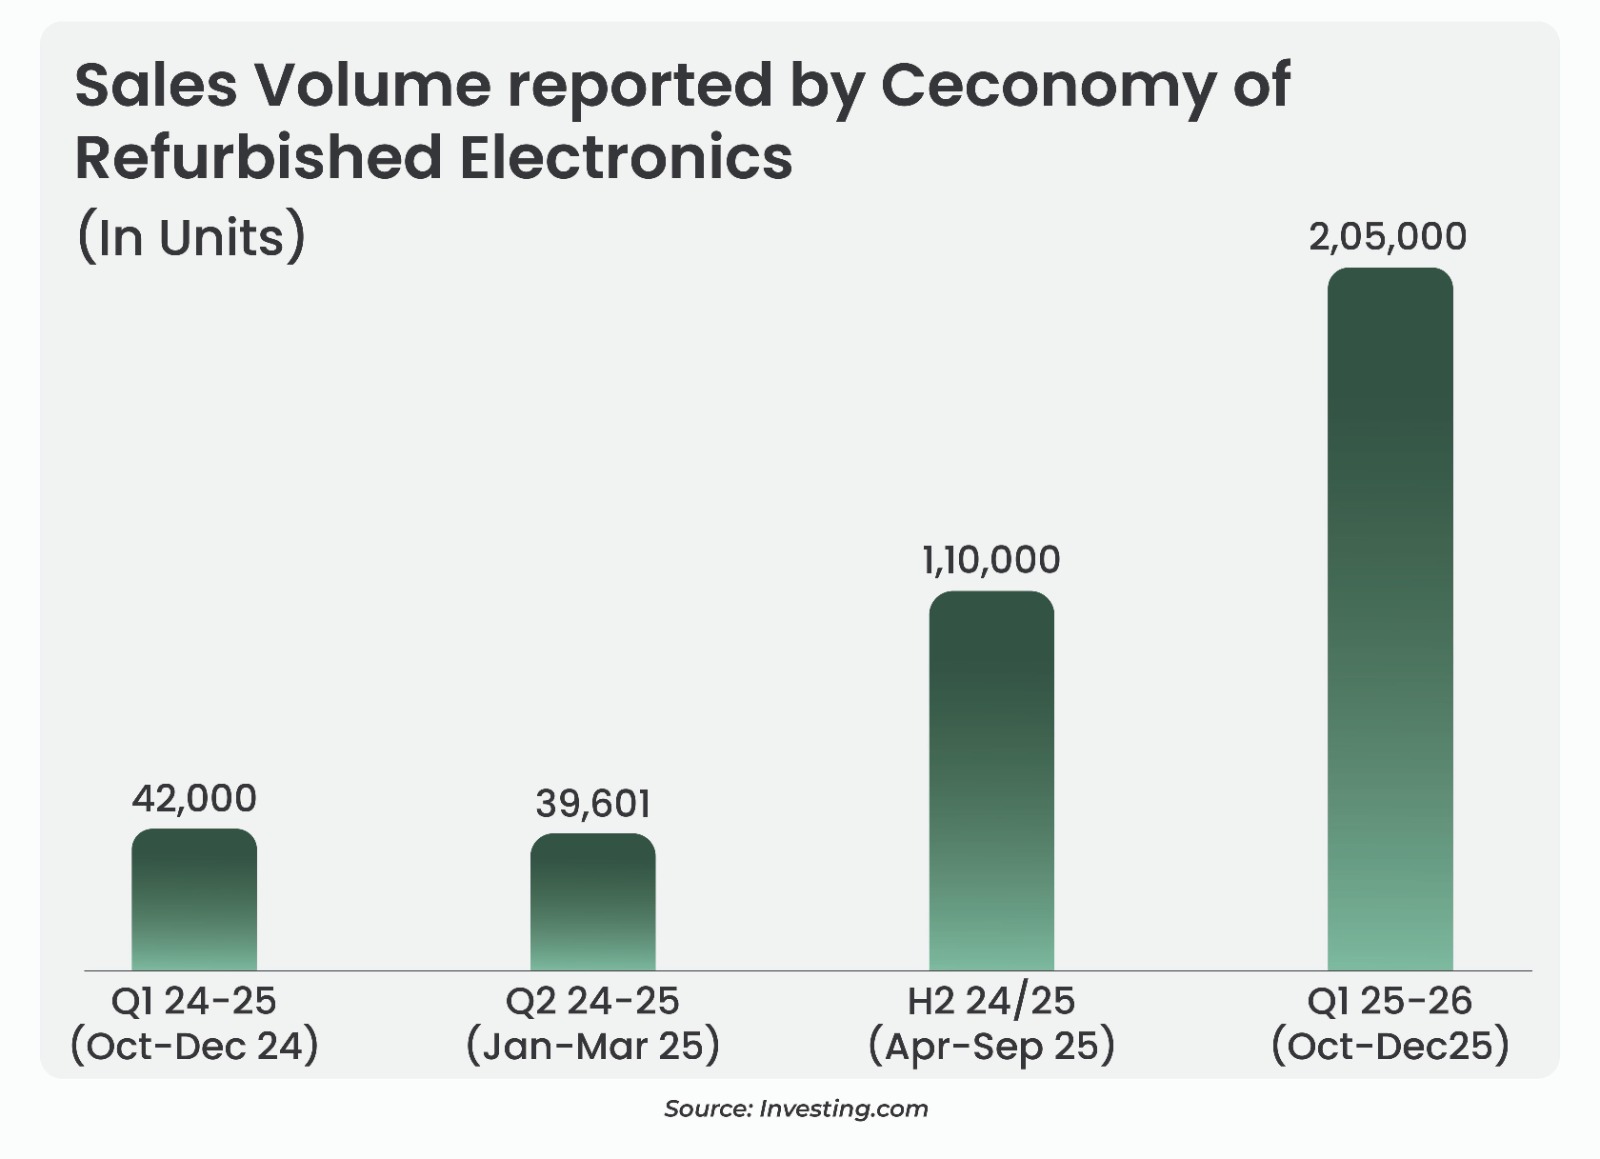
India: Where the Refurbished Opportunity is Uniquely Compelling
The country’s vast middle class operates on constrained discretionary budgets — and the PC pricing shock hits harder here than anywhere else. An entry-level laptop that cost ₹35,000 – ₹40,000 in 2024 now commands ₹55,000 – ₹60,000+ in 2026.
Faced with that gap, the Indian buyer doesn’t stretch their budget – they either delay the purchase entirely, or they pivot to the refurbished market, which delivers comparable specifications at one third price of the new laptops.
The math is simple. The opportunity is enormous. The Indian refurbished electronics market – the numbers:
GNG Electronics Ltd sits precisely at this intersection, having built a suite of value-added services that transform corporate hardware offloads into a scalable supply chain one that becomes more defensible when the new devices get more expensive to get.
GNG’s focus has been very clear: secure supplies well in advance, execute refurbishment efficiently, and ensure continuity for customers across geographies. Beyond affordability, GNG has significantly enhanced customer confidence by offering a 3-year warranty in India and a 1-year warranty in international markets, a level of assurance virtually unheard of in the electronic refurbishment industry.
“As a result, refurbished PCs are playing an increasingly important role in meeting global computing demand, especially for enterprises and institutions that value faster deployment, reliable performance and cost efficiency. Customers are increasingly recognizing that refurbished systems can meet their needs without compromise.
We’ve seen similar transitions in other industries as well. In mature automotive markets, used car sales are more than twice the volume of new car sales. In smartphones, refurbished devices have grown from a niche segment to a meaningful share of global shipments. The PC market is now following a similar trajectory as devices become more expensive, technologically stable, and longer lasting.”
Like the second-hand automotives market, this extract reflects how the electronics market is transitioning towards the refurbished market.
The pricing shift that is structurally expanding GNG’s addressable market:
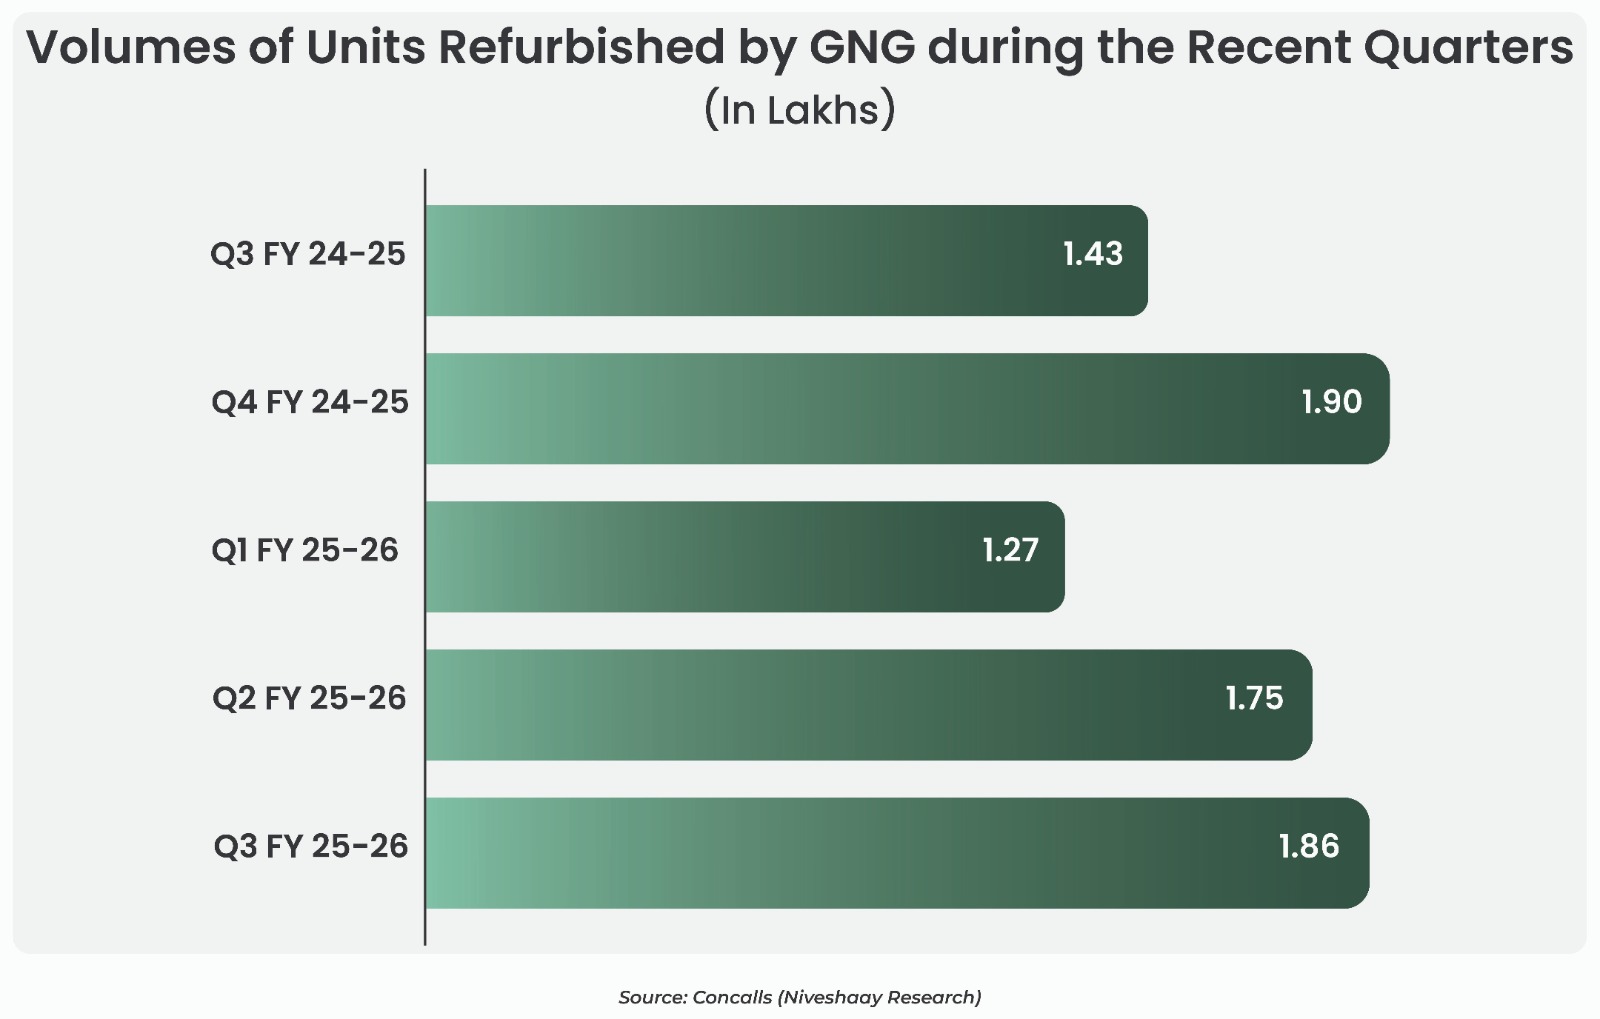
The current tailwind for the refurbished laptops & PC’s market is clearly visible in the results of GNG Electronics Ltd as the sales volume units & the average selling price are on a rise.
“Riding on strong industry tailwinds, the management has revised its guidance on the annual revenue growth rate to 28-30%, up from the previously stated guidance of 25% along with an improvement in profitability of around 150 to 200 basis points compared to the earlier guidance of approximately 75 basis points for the whole year.
Why TurboQuant Won’t Derail the AI Memory Chip Cycle?
A new efficiency oriented innovation has entered the AI hardware conversation: Google’s TurboQuant, a compression algorithm that reduces the working memory (KV cache) requirements of AI systems by up to around 6x.
However, this optimization applies only to the dynamic component of memory usage; the static requirement for high bandwidth memory (HBM) per GPU in an AI system remains structurally unchanged chips still need to store model weights and support baselevel throughput, preserving the core HBM chip demand function.
The macro dynamic, therefore, remains firmly intact.
Conclusion:
As memory supply continues to be absorbed by hyperscalers pursuing everlarger AI infrastructure buildouts, the resulting price inflation in consumer PCs and laptops is unlikely to reverse anytime soon. This is not a cyclical spike that will correct itself over a quarter or two. It is a structural shift in the global hardware value chain, one where memory chips have become a constrained, highvalue input, and where the economics of new devices are being fundamentally repriced upward.
And in every structural shift, value migrates.
Refurbished electronics are emerging as the natural beneficiary of this dislocation, delivering comparable functionality at a fraction of the cost of new devices, precisely when the price gap between new and refurbished has never been wider. For players like GNG Electronics, this is not merely a demand uptick riding a temporary wave. It is a multiyear structural tailwind, underpinned by established sourcing networks, scalable refurbishment capabilities, and customer trust built through industry leading warranty commitments.
In essence, the same technological force that is making new hardware progressively more expensive is simultaneously making refurbished hardware indispensable. AI is not just reshaping the frontier of computing, it is quietly, and permanently, rewriting the economics of access to it.
For details you can visit our website here:
📌https://niveshaay.smallcase.com/
Disclaimer: This is for educational purposes only, and not investment advice. The author may or may not hold positions in the companies discussed. Do your own research before making investment decisions.

AI & Data Center
Decoding the Indian Aerospace & Defence Supercycle – Part 1
How global supply-chain fractures, geopolitical realignment, and India's policy pivot are creating a multi-decade opportunity in Aerospace, Defence & Space.
We’ve seen this pattern before — and the next wave is aerospace, defence & space.
India has a proven playbook for capturing global manufacturing share. It happened with auto components (2005–2015), then pharma CDMO (2010–2020), then electronics EMS (2015–present). The next wave – Aerospace, Defence & Space, is just beginning, and it carries the longest compounding runway of them all.
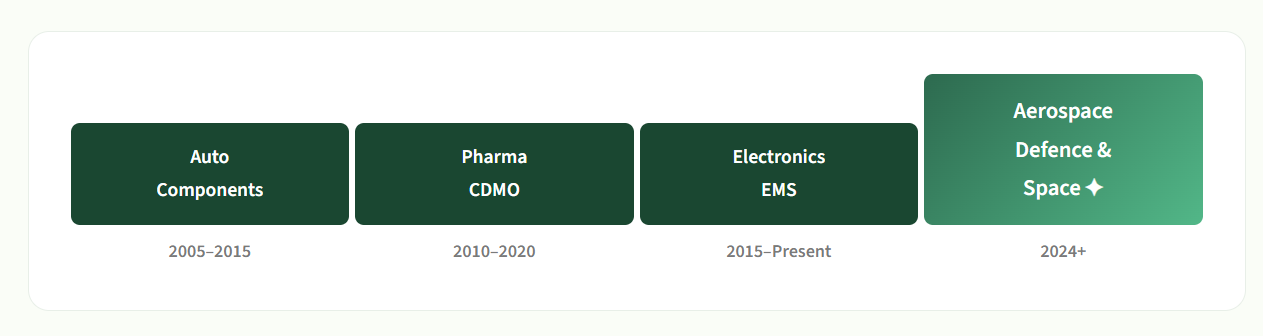
The key players riding this wave include companies like Sansera Engineering, Azad Engineering, Rossell Techsys, Dynamatic Technologies, Aequs, Sasmos, Unimech, Avalon, Avantel, JSR Dynamics, and many more. We’re in the early innings of a secular trend with long-duration compounding.
Europe has lost significant market share in aerospace exports while Asia has nearly tripled its share.
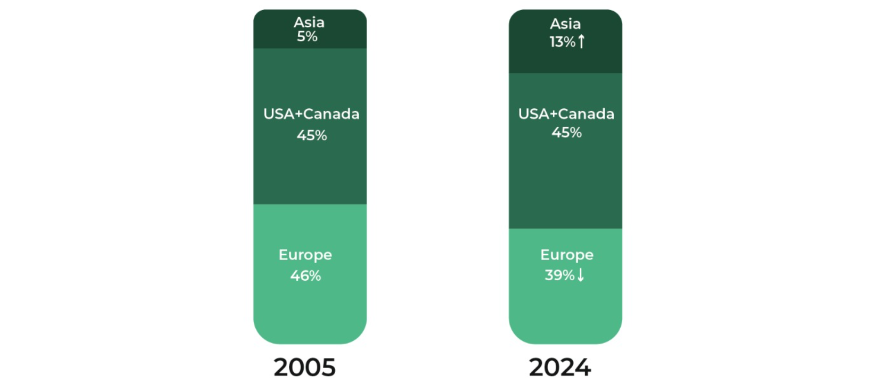
Geopolitical Mandate: OEMs are building parallel supply chains to reduce China dependence – ‘Europe+1’ and ‘China+1’ strategies are now standard.
Capex Divergence: Asian manufacturers are investing fresh capital in capacity, while European players are trapped by leveraged balance sheets and fixed-price contracts.
Operational Integration: Asia is moving up from simple assembly to faster certification learning curves and full sub-system integration.
This shift is happening across 7+ sectors simultaneously: Space, Commercial Aerospace, Defence (UFVs), Energy, Semiconductors, Industrial Panels, and Aero-Engine derivatives.
The aerospace supply chain is a pyramid, a tight duopoly at the top, with thousands of fragmented suppliers at the base.
The global aerospace industry has an unusual structure: Airbus and Boeing control ~80–85% of the commercial aircraft market at the final assembly level – a near-duopoly. But as you move down the pyramid, the supply chain fragments dramatically. This matters because it is at the lower tiers – Tier-2/3 (components, sub-assemblies) and Tier-4 (raw materials), where India’s opportunity is most immediate and most actionable.
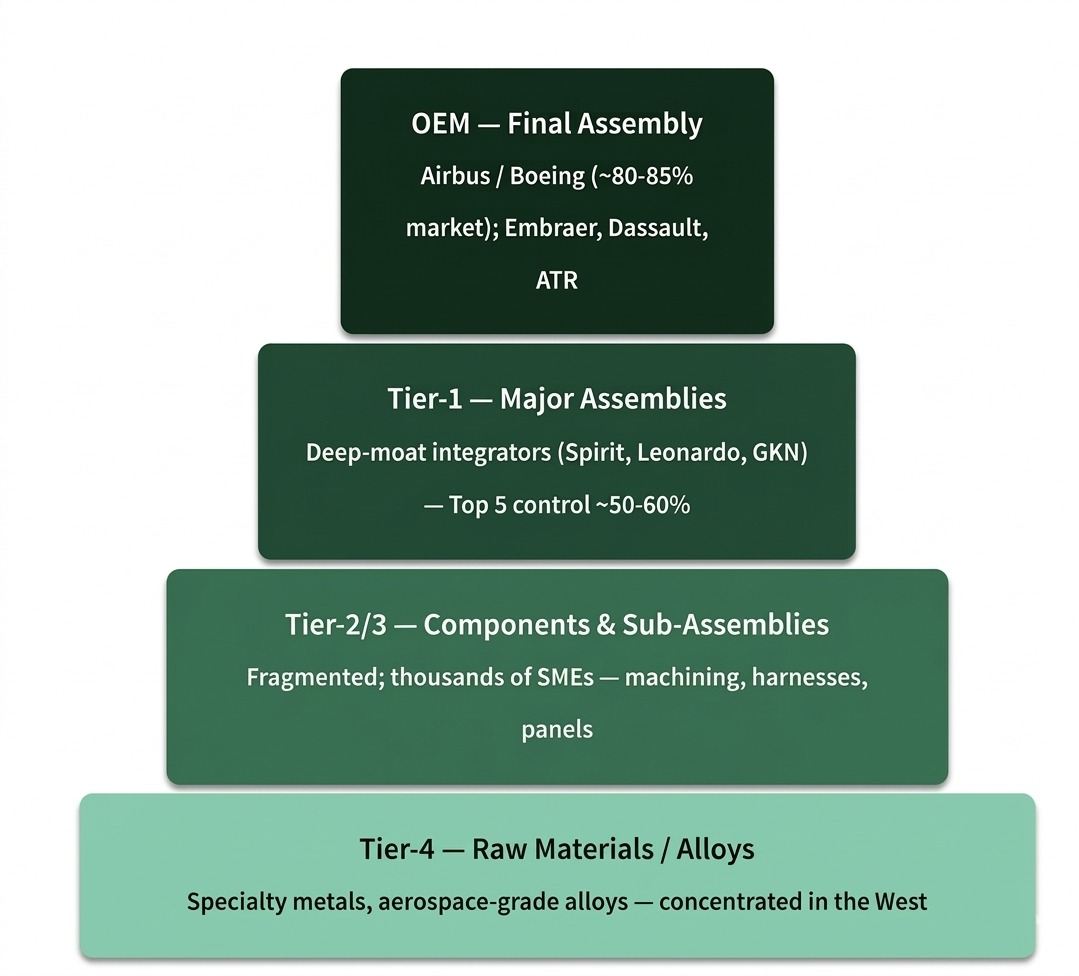
OEMs – The Duopoly: Airbus and Boeing dominate. Aircraft programs include A320, A350, 737 MAX, 787, E190, Falcon 7X, and ATR 72.
Engines – Tight Oligopoly: CFM International, Pratt & Whitney, and Rolls-Royce, the top 3–4 engine makers control ~90%+ of the market.
Structures – India’s Entry Point: Spirit AeroSystems, Leonardo, and GKN lead, but the top 5 control only ~50–60%. This is where Indian Tier-2/3 players can win.
🔑 Key insight: The duopoly controls final assembly, and Tier-1 integrators hold deep moats. But at Tier-2/3 and below, where the supply base is fragmented, financially stressed, and facing labour shortages, the door is wide open for qualified Indian manufacturers to step in.
Recovery collides with structural constraints, shifting gravity to the East.
Western aerospace manufacturing is stuck in a self-reinforcing trap. New aircraft deliveries get delayed → airlines fly older planes longer → maintenance (MRO) consumes scarce resources → manufacturing capacity starves further → more delays. The result? Gravity shifts East.
⚠️ Western manufacturing is structurally constrained by three forces: labour shortages, cost inflation on fixed-price contracts, and limited physical capacity with slow certifications.
Airbus (June ’25): Aircraft assembled but sitting on tarmac awaiting engines and interiors, a symptom of supplier bottlenecks and workforce issues.
Boeing (CY24–25): Supplier labour shortages, wage inflation impacting production. A strike by 3,200 machinists highlighted acute manpower crisis.
RTX / Pratt & Whitney: Skilled labor remains the primary constraint on MRO capacity expansion, human capital is the bottleneck, not capital.
Post-COVID impact has caused insolvency across Tiers 1 through 4 of the Western aerospace supply chain:
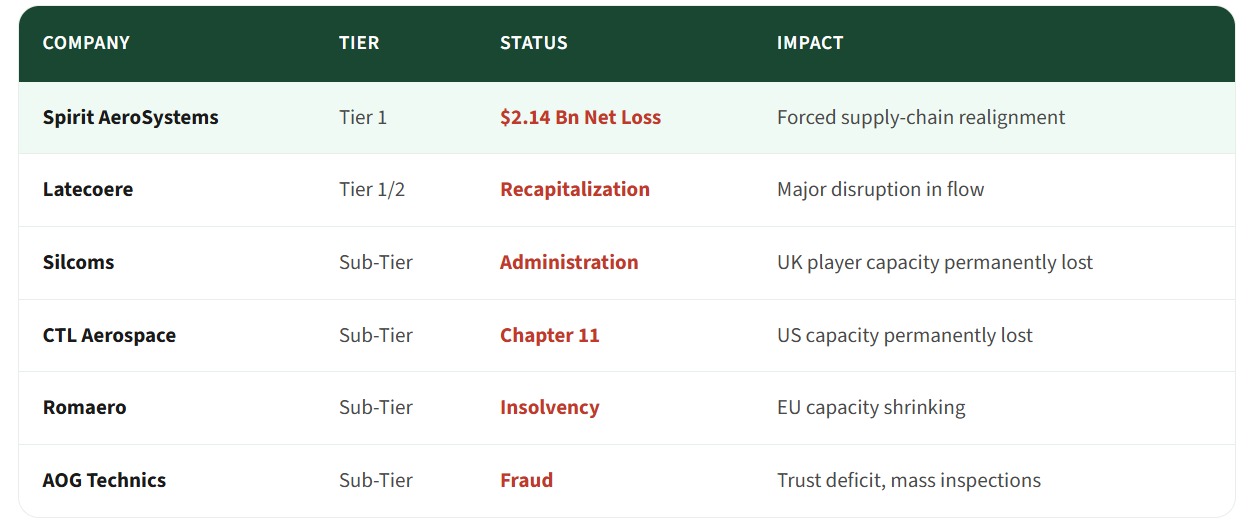
Backlogs up, deliveries down, lead times longer, the global aerospace pipeline is jammed.
The backlog keeps building while throughput remains well below peak. This creates a structural, not cyclical, need for new capacity and that capacity is increasingly coming from Asia, specifically India.

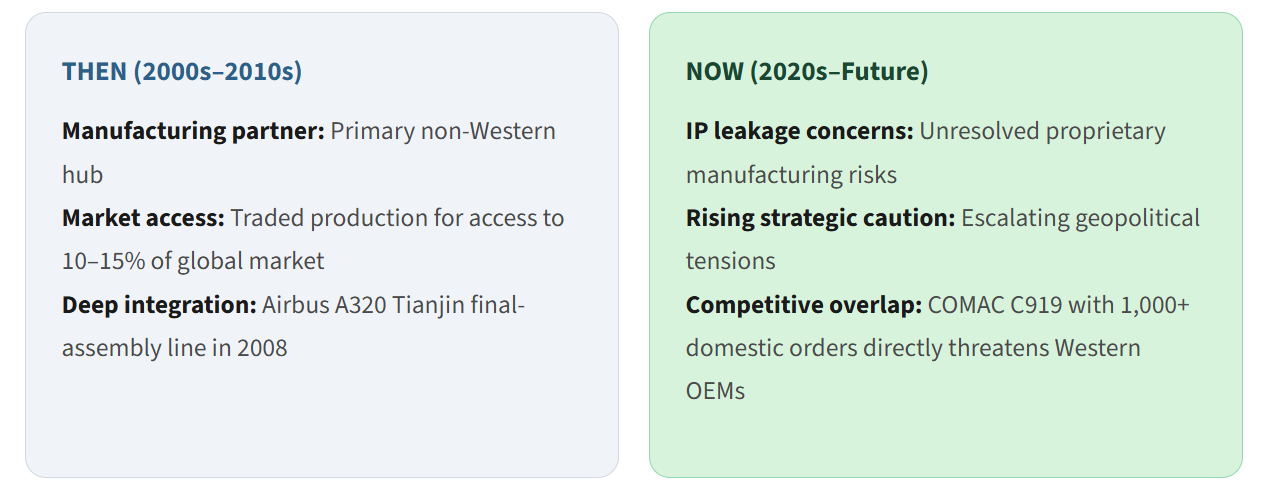
Demand is not the bottleneck. Certified supply is scarce. And geography is shifting.
The aerospace investment thesis is often misunderstood. It is not a demand story, demand is abundant and growing. It is a supply-side story playing out across four dimensions simultaneously.
Demand
Capacity
Qualification Friction
Geography Shift
🎯 The right framework: Don’t ask ‘will demand grow?’ it already has. Ask instead: ‘who has the certified capacity to deliver?’ That filter narrows the investable universe dramatically and India’s qualified suppliers sit at the centre of that answer.
A unique convergence of engineering depth, cost competitiveness, and policy support.
Order-Book Relevance: India represents 10–12% of the global aerospace backlog. It’s among the top 4 countries in Boeing’s order book at 7%.
Auto-Ancillary Capability: Transfer of high-precision skills from India’s massive auto components base, this is NOT greenfield capability building.
Cost-Competitive Scaling: India production wages (~$2,500/yr) are a fraction of US/EU ($30k+), delivering 30%+ savings on harness and component work.
🎯 The US median aerospace worker is >50 years old. Over 33% of skilled machinists are retiring in the next decade. Boeing recently gave a 40% wage hike. India’s young, deep engineering talent pool is the structural answer.
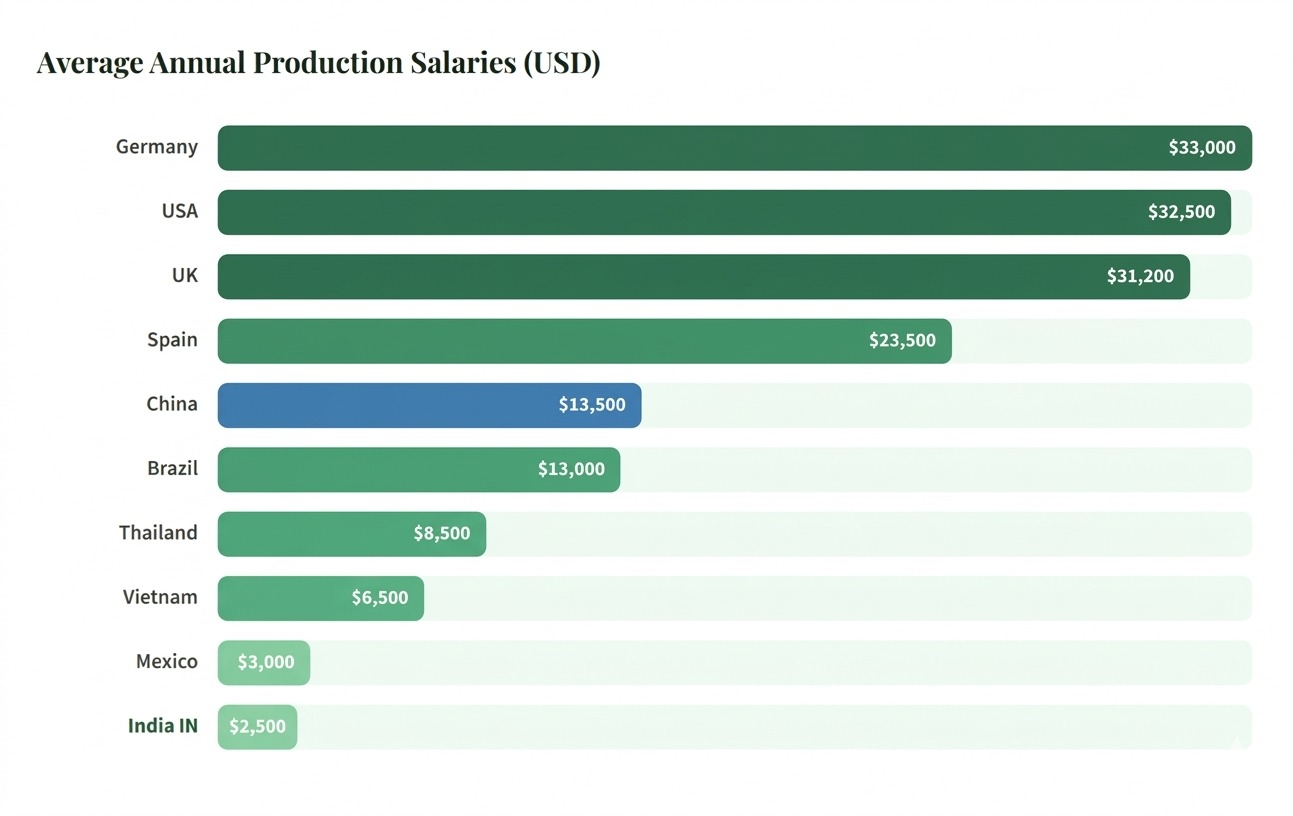
India is one of the fastest-growing aviation markets in the world, with domestic passenger traffic compounding at ~10% CAGR and fleet expansion expected at ~12% CAGR over the next 5 years. This makes India a critical demand anchor for both Airbus and Boeing.
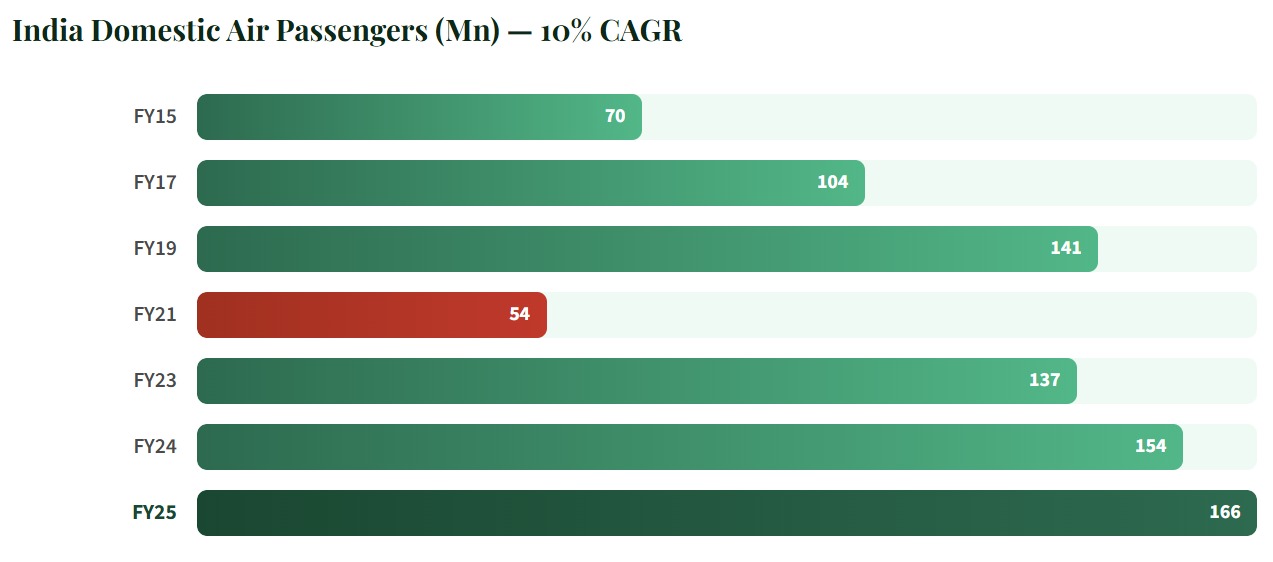
India is among the top 4 countries in Boeing’s CY25 orderbook, contributing 7% — behind only the USA (23%), UAE (8%), and Ireland (8%). Airbus gross orders from Indian carriers peaked at 750 aircraft in CY23.
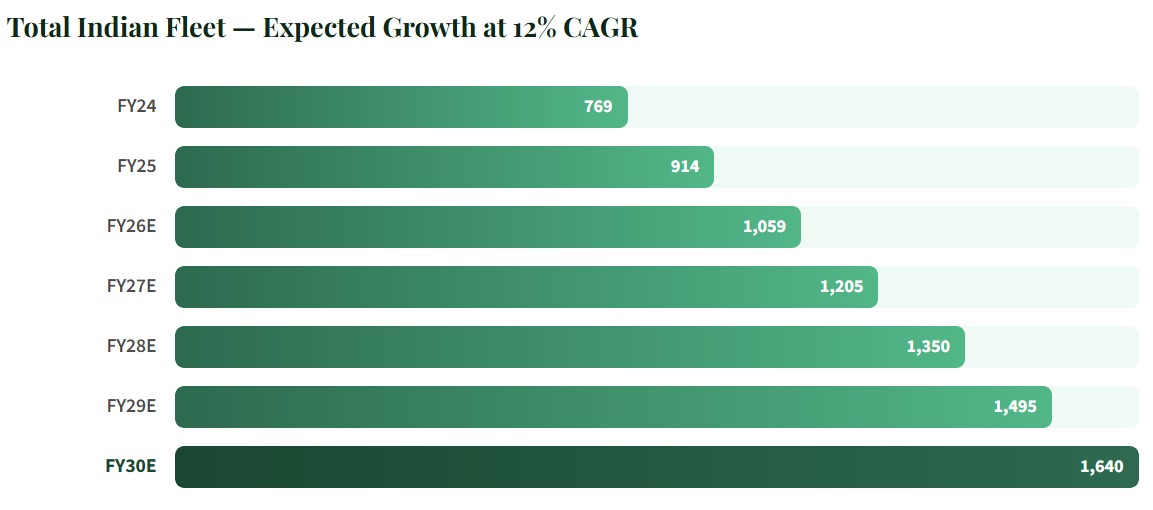

High-precision automotive manufacturers carry a structural advantage in the transition to aerospace-grade production.
Aerospace manufacturing is among the most demanding industrial disciplines globally — it requires micron-level tolerances, zero-defect traceability, and rigorous process certifications (AS9100, NADCAP) that take years to achieve. However, Indian automotive component manufacturers who already operate at high-precision machining levels hold a distinct structural advantage in making this transition. Companies running multi-axis CNC machining, precision forging, complex surface treatment, and advanced metallurgical processes for automotive OEMs already possess the foundational capability infrastructure that aerospace supply chains demand. The step from automotive-grade precision to aerospace-grade precision is an incremental tightening of tolerances — not a fundamental reinvention of capability.
This is precisely what makes India’s position different from a greenfield entrant. Automotive machining may operate at ±25 micron tolerances; aerospace demands ±5 microns. The gap is real, but it is a calibration upgrade, not a capability rebuild. For a company that has already invested in 5-axis CNC infrastructure, precision forging lines, and disciplined shop-floor processes, the path to aerospace certification (typically 30–48 months) becomes a natural, high-value progression up the manufacturing value chain.
💡 The core thesis: Aerospace does not require a fundamentally different manufacturing DNA , it requires a higher-fidelity expression of the same DNA. Indian companies already operating precision forging, tight-tolerance CNC machining, and complex harness/wiring assembly for automotive and industrial OEMs carry a built-in advantage. Their existing shop-floor processes, quality culture, and engineering talent provide the foundation. What follows NADCAP accreditation, first-article inspections, OEM qualification cycles, is a structured 30–48 month transition, not a decade-long capability build. This is why adjacency matters: it compresses the qualification timeline and reduces execution risk significantly.
The proof is already visible across multiple Indian companies that have successfully made this transition:
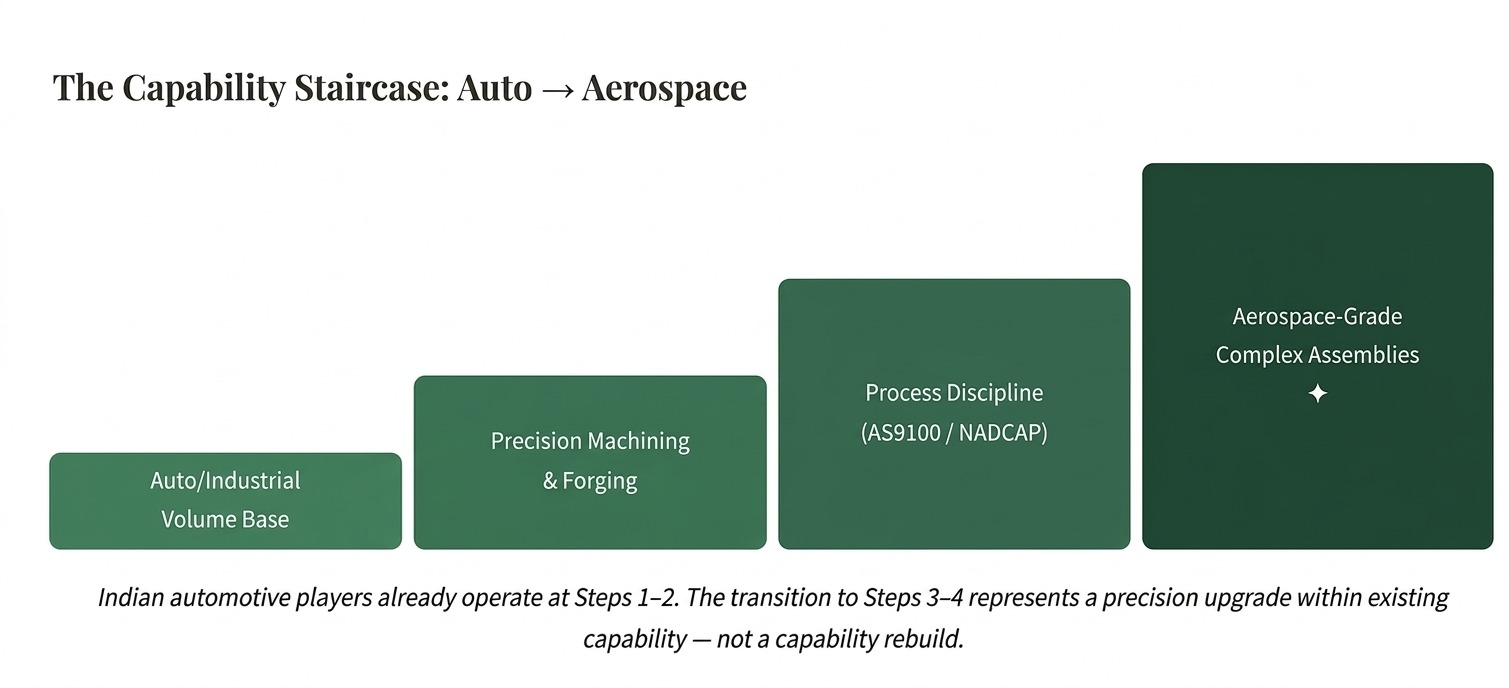
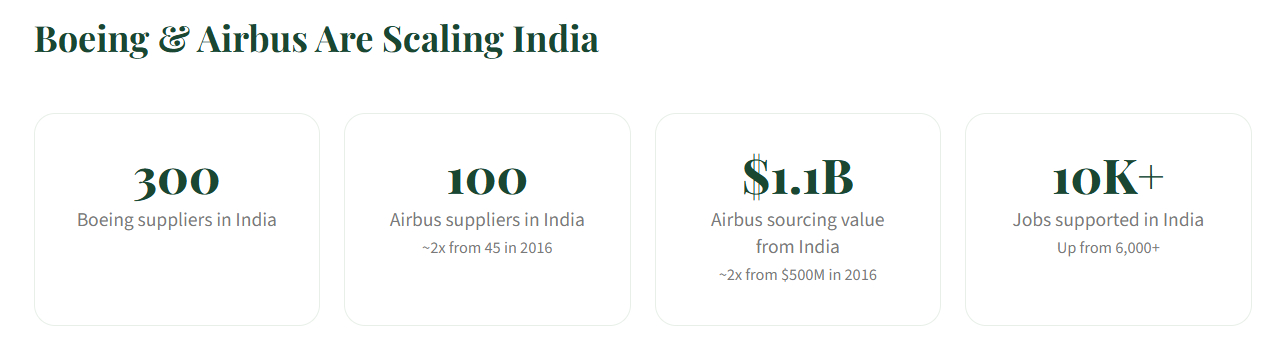
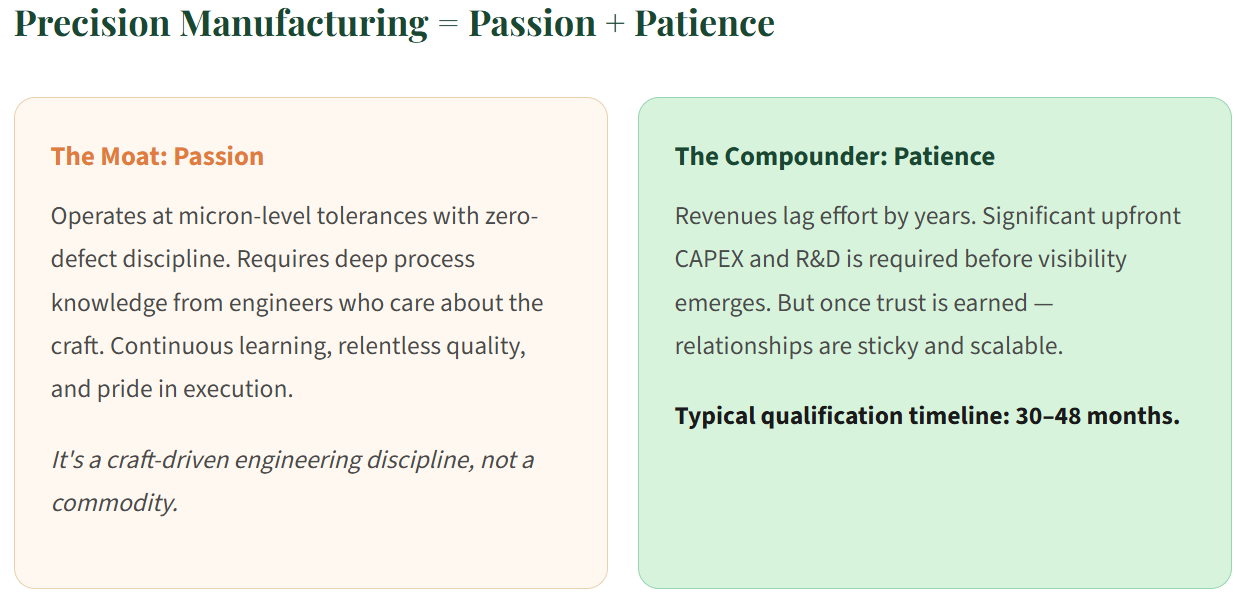
Watch procurement before headlines. Qualified suppliers benefit first. The capacity shift is gradual — not overnight.
Not all aerospace work packages shift at the same pace. Understanding what moves first versus what stays entrenched in the West is critical for identifying where value accrues earliest.
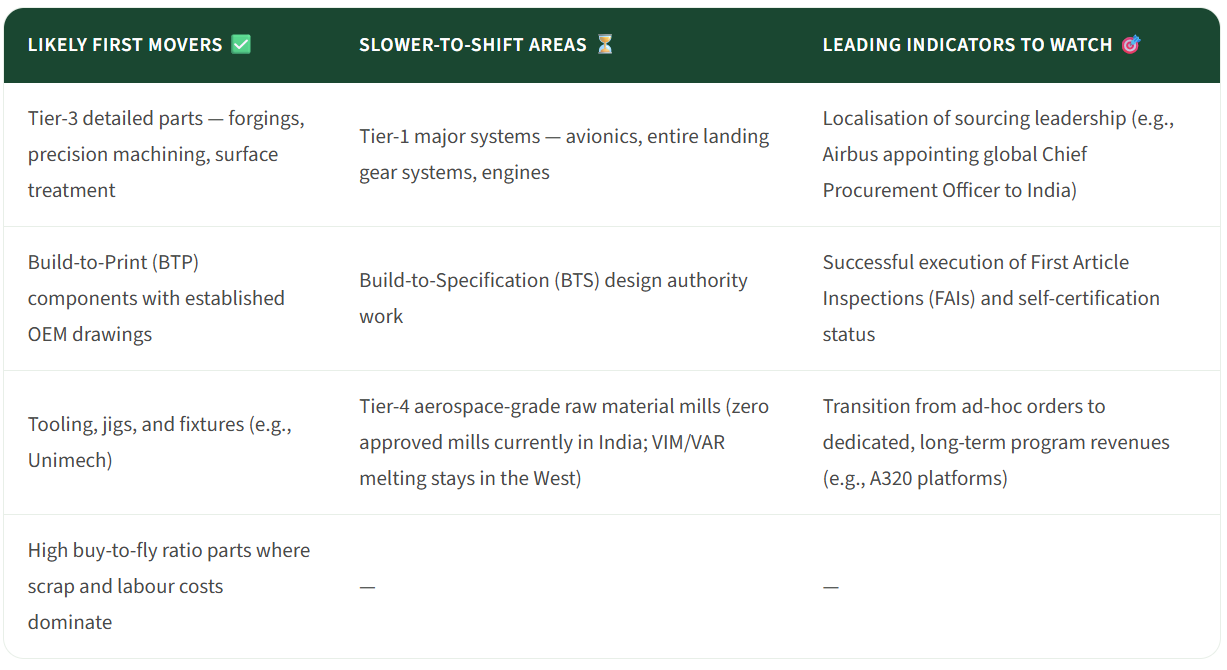
📌 Investor takeaway: The first revenue gains accrue to Indian companies that are already qualified on Tier-3 parts, BTP components, and tooling. These are the companies with existing OEM relationships and completed first-article inspections — not those still in the qualification pipeline.

Electronic Manufacturing Services
Decoding the Indian Aerospace & Defence Supercycle – Part 2
How global supply-chain fractures, geopolitical realignment, and India's policy pivot are creating a multi-decade opportunity in Aerospace, Defence & Space.
The character of war is shifting toward drones, electronic warfare, precision strikes, and massive ammunition consumption.
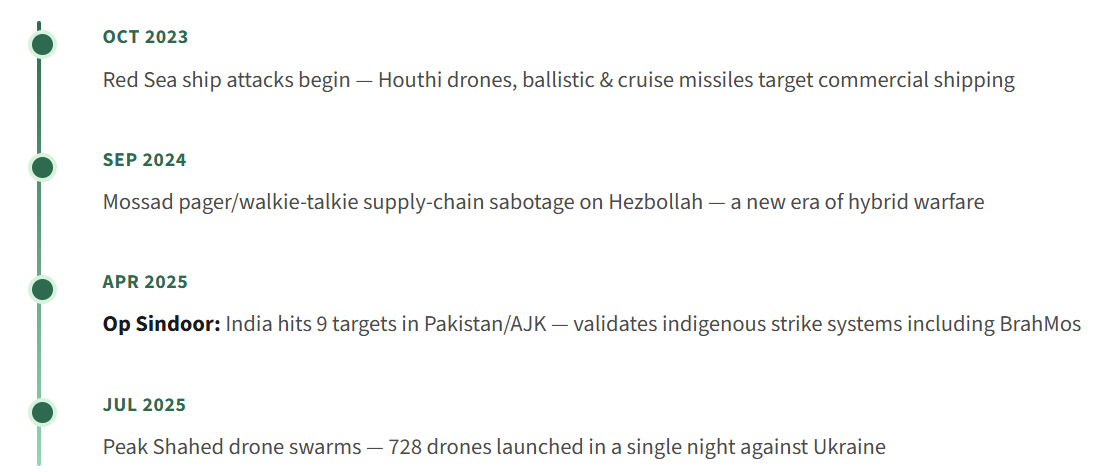
1) Attrition Warfare: 10,000–20,000 shells/day in Russia-Ukraine. Wars wildly exceed initial reserve estimates.
2) Drone Swarm Warfare: 143 Shahed drones/day avg. Ukraine FPV drones destroy tanks at just $400–800 per unit.
3) Saturation Missile Attacks: Iran-Israel exchanges. Red Sea Houthi attacks with ballistic & cruise missiles.
4) Hybrid Warfare: Baltic Sea cable cuts, GPS jamming, supply-chain infiltration, electronic warfare dominance.
5) Autonomous Warfare: AI-guided loitering munitions. Semi-autonomous drone swarms. Armenia-Azerbaijan as proof-of-concept.
6) Grey Zone Strikes: China-Taiwan drone incursions, naval harassment. Op Sindoor: India’s precision multi-target strikes.
The future battlefield is decided not by who has the strongest weapons, but who can defend and strike smarter, at sustainable cost. A $400 FPV drone destroying a multi-million dollar tank changes the math completely.
Modern defence is built on three pillars — and the balance between them defines a nation’s survivability.
Pillar 1: Asymmetric Cost Advantage
Deployment of low-cost drones against high-value, expensive targets. Counter-UAS (C-UAS) systems that are cheaper than standard interceptors. Utilisation of jammers, directed-energy weapons, decoys, spoofing, and electronic warfare. Building layered interception architectures that don’t bankrupt the defender.
Pillar 2: Defending Capabilities
Advanced air defence and counter-drone / C-UAS systems. Electronic warfare (EW) shielding against GPS jamming and communications disruption. Next-generation radar and early warning arrays. Hardened, disruption-proof communication networks that survive first-strike scenarios.
Pillar 3: Offensive Capabilities
Missiles and guided munitions with precision strike capability. Armed drones and loitering munitions for persistent surveillance-strike. Artillery and heavy rocket systems (Pinaka, MLRS). Long-range strike systems, anti-ship weapons, and stand-off platforms that keep the enemy at distance.
⚠️ The cost equation has permanently changed. Maintaining a sustainable cost structure — where defensive interceptors do not vastly outprice incoming threats — is now paramount to long-term survival. Israel’s Iron Dome fires $1–4M interceptors at $20K drones. That math doesn’t scale. Nations need layered, cost-efficient defence architectures — and this is exactly what India’s indigenous industry is building.
The world is transitioning from a decades-long peace dividend into a sustained rearmament super-cycle.
Growth is aggressively compounding — the 3-year trailing CAGR is more than double the 15-year average. And NATO’s Hague Summit (June 2025) mandated 5% of GDP on defence by 2035 — up from the old 2% target.

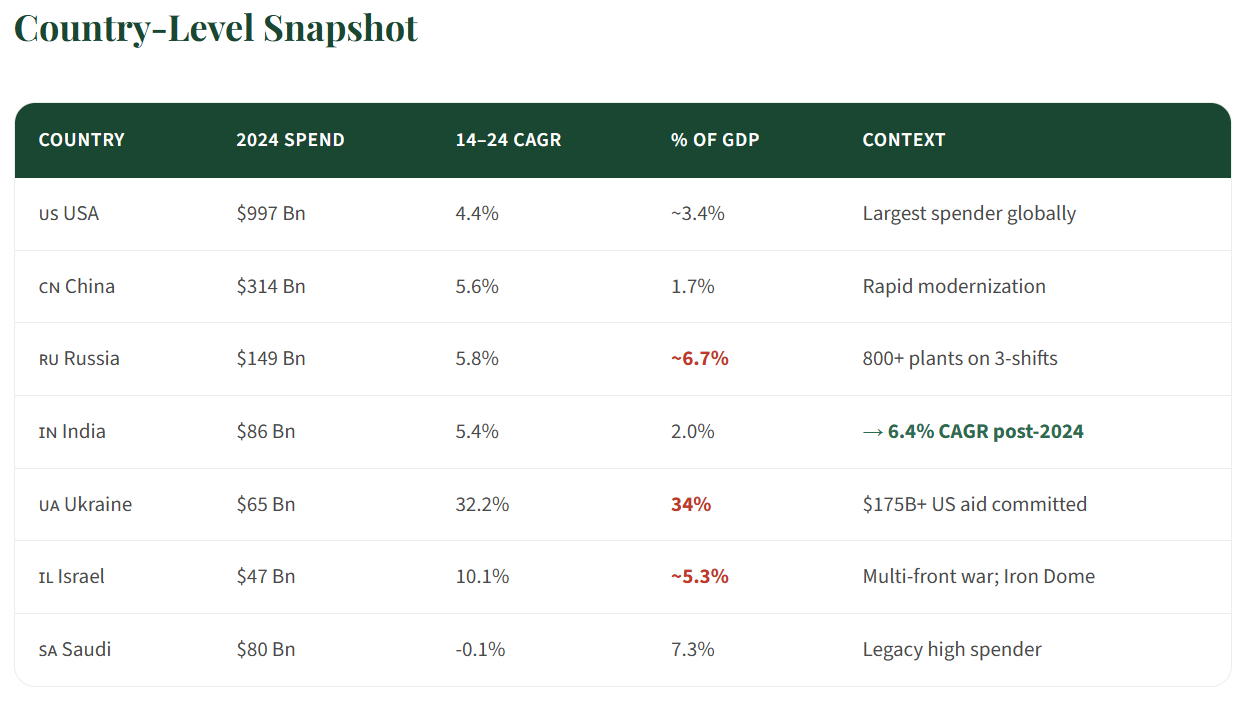
📌 The EU’s €800 Bn defence plan requires non-US suppliers (78% is currently procured outside the EU). This perfectly positions India’s ₹500 Bn export target for FY30.
India’s medium-term defence capex CAGR of 17–18% is secured by four distinct, non-overlapping growth engines.
1) Export Opportunity
2) War Wastage Reserve (WWR)
3) New Procurement
4) Existing Modernisation
FY27 Budget: ₹7.84T | Capital Procurement: ₹2.19T | FY30 Export Target: ₹500 Bn
Exports have grown 15x to ₹236 Bn since FY17, evolving from an afterthought to a core revenue pillar. A massive ₹3.3 Trn procurement pipeline is actively flowing to domestic suppliers.
Modern conflicts consume ammunition at rates that obliterate peacetime reserve assumptions.

NATO stockpiles are fully exhausted after three years of supplying Ukraine. Israel fired 1,000+ Iron Dome interceptors in a single barrage. Total shells fired in Ukraine over 3 years are estimated at 10+ million. Red Sea economics expose the cost asymmetry — USD $1–4M interceptors fired at USD $20K drones. Drone factories are now being built mid-war because pre-war production capacity was never designed for this burn rate.
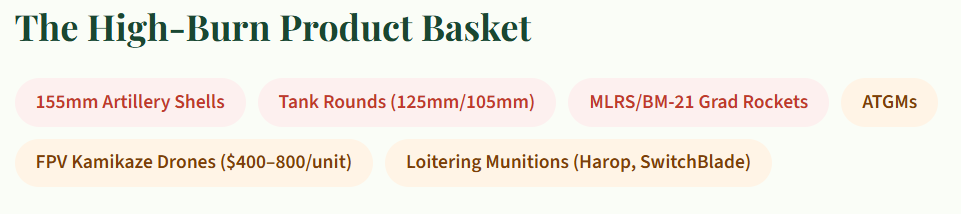
No Import During Wartime: WWR must be entirely domestic. You cannot rely on foreign supply chains during active conflict — sovereign production is a structural moat.
Scale of Capital Committed: ₹7.84T FY27 budget with ₹2.19T capital expenditure backing a ₹3.3 Trn procurement pipeline. The money is allocated and flowing.
Emergency Fast-Track (FTP): Post-Op Sindoor, India initiated emergency procurement of 5,000–10,000 FPV drones. This validates that the military establishment now treats high-burn items as urgent.
⚠️ Modern conflicts have turned episodic defence procurement into continuous, recurring inventory replenishment. Exhausted Western stockpiles prove that wartime imports are unviable — making domestic manufacturing a critical national security imperative, not just an industrial policy preference.
Addressing the two-front vulnerability against China and Pakistan is the primary driver for accelerating indigenous procurement.
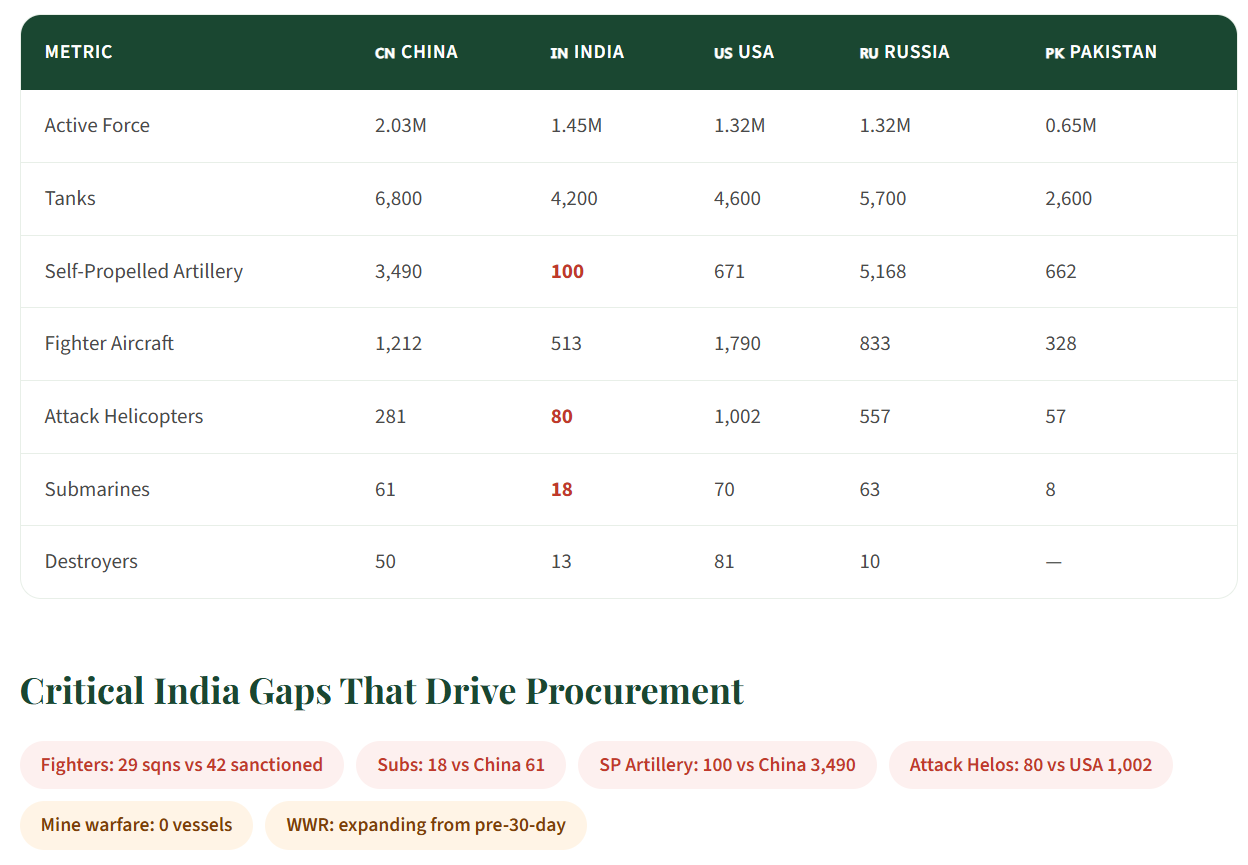
Extensive multi-theatre exercises directly expose operational gaps, triggering fast-tracked capital allocation.
India doesn’t just plan defence procurement in boardrooms — it stress-tests its military in large-scale exercises, discovers what’s missing, and then procures urgently. In FY24–25, a series of landmark exercises across all three services and multi-nation formats systematically mapped India’s capability shortfalls and accelerated procurement decisions.
Gagan Shakti 24: IAF multi-theatre air exercise — tested two-front readiness, identified squadron deficit severity
TROPEX 25: Navy tri-service maritime exercise — exposed submarine and mine warfare gaps
Tarang Shakti 24: Multi-nation air exercise — benchmarked India against allied capabilities, identified interoperability needs
Malabar 24: India-US-Japan-Australia (Quad) naval exercise — tested blue-water coordination and ASW capabilities
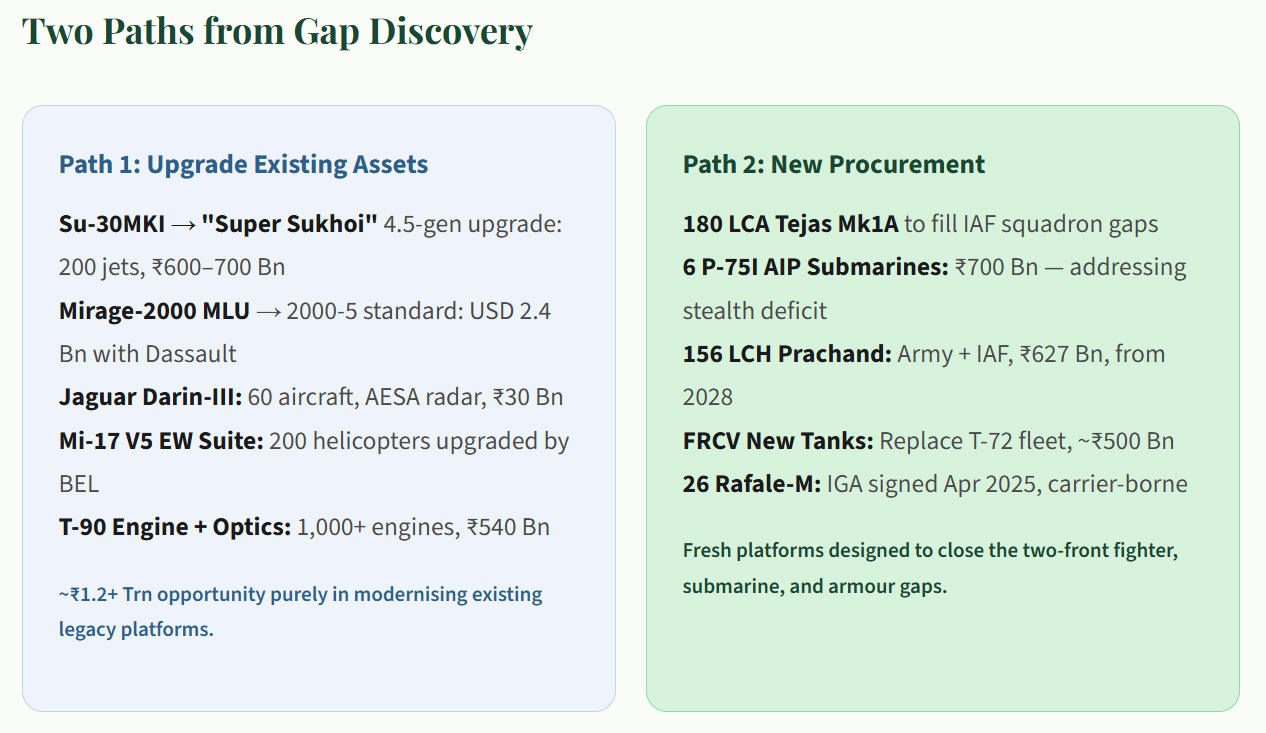
Underneath both paths, a growing base of startup-led innovation is feeding into heavy platforms through iDEX (300+ startups, ₹5 Bn funding), ADITI (deep-tech: AI, quantum, directed energy), and DRDO MAKE I/II/III categories. This decentralised innovation pipeline ensures that India isn’t just buying systems — it’s building the IP and talent base to sustain indigenous production over decades.
From the world’s #2 arms importer to an emerging exporter — driven by a once-in-a-generation realignment of global supplier dynamics.
For decades, India was the world’s largest or second-largest arms importer, with 65–70% of defence equipment sourced from abroad — predominantly Russia. That dependency is now inverting. India’s defence exports have surged 34x since FY14, from ₹7 Bn in FY14 to ₹236 Bn in FY25, with a stated government target of ₹500 Bn by FY30. What makes this achievable is not just India’s growing industrial capability — it is that every traditional arms supplier is simultaneously compromised.
Russia — Consumed by Its Own War
Russia historically supplied 55% of India’s defence imports. Today, it is spending ~6.7% of GDP on defence, running 800+ factories on 3-shift production just to meet domestic wartime demand. Russian defence plants cannot simultaneously feed the Ukraine frontline and fulfill multi-billion dollar export commitments. Delivery timelines have stretched, spare parts are delayed, and new order fulfilment has become unreliable. Russia’s share of Indian imports has already dropped from 55% to 36% — and this trend is structural, not temporary.
Israel — Stretched Across Multiple Fronts
Israel, a critical supplier of radars, missiles, and EW systems globally, is fighting a multi-front conflict — Gaza, Lebanon, Houthi threats from Yemen, and Iranian exchanges. At ~5.3% of GDP on defence, Israel’s industrial base is fully mobilised for its own survival needs. Iron Dome interceptors alone cost $1–4M each, and Israel has fired 1,000+ in single barrages. Export capacity for discretionary orders is materially constrained, and delivery schedules for international buyers have slipped.
USA — Effective but Conditional
American defence equipment is among the most advanced globally, but it comes with significant conditions. CAATSA sanctions risk (as seen with India’s S-400 deliberations), end-use monitoring requirements, technology denial on critical sub-systems, political conditionality on human rights and foreign policy alignment, and high acquisition costs make US procurement a complex proposition. For many nations in the Gulf, ASEAN, and Africa, these strings make American equipment a difficult choice — even when they can afford it.
🎯 The structural insight: Russia cannot deliver, Israel is stretched, and the USA comes with conditions. This creates a widening gap in global arms supply precisely when demand is surging (NATO 5% GDP mandate, 40+ nations raised budgets >10%). India — geopolitically non-aligned, cost-competitive at 30–50% lower than Western peers, and now combat-validated through Op Sindoor — sits at the centre of this gap.
Geopolitical Neutrality
India is trusted by Gulf states, ASEAN nations, African countries, and even some European buyers — precisely because it does not impose political conditionality on arms sales. This is a rare and valuable positioning.
Cost-Competitive
Indian defence products are 30–50% cheaper than Western equivalents. BrahMos, Akash SAM, 155mm ammunition, and Dornier-228 aircraft offer compelling value-for-money for developing nation defence budgets.
Combat-Validated
Op Sindoor (April 2025) proved Indian systems under real combat conditions. BrahMos performed exactly as designed. 8+ nations are now actively evaluating Indian platforms — this is the most powerful sales credential in the defence industry.
EU Needs Non-US Suppliers
The EU’s €800 Bn defence plan is critical — 78% of European procurement currently comes from outside the EU. With the NATO 5% GDP mandate by 2035, Europe needs affordable, scalable supply. India fits.
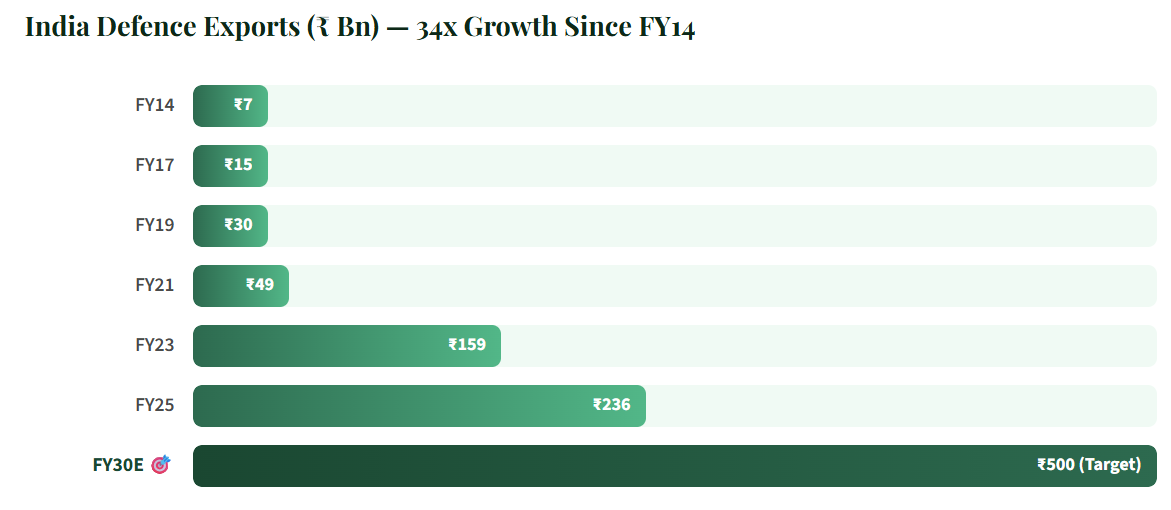
India’s import dependency has fundamentally realigned. Russia’s share has dropped from 55% to 36%, while France has risen from ~12% to 33% and the USA from ~8% to ~15%. Critically, the domestic industry now supplies ~75% of Indian military needs under DAP-2020 mandates. India remains the #2 global importer (8.3% global share), but the trajectory is clear — import substitution is accelerating, and exports are becoming a core revenue pillar.
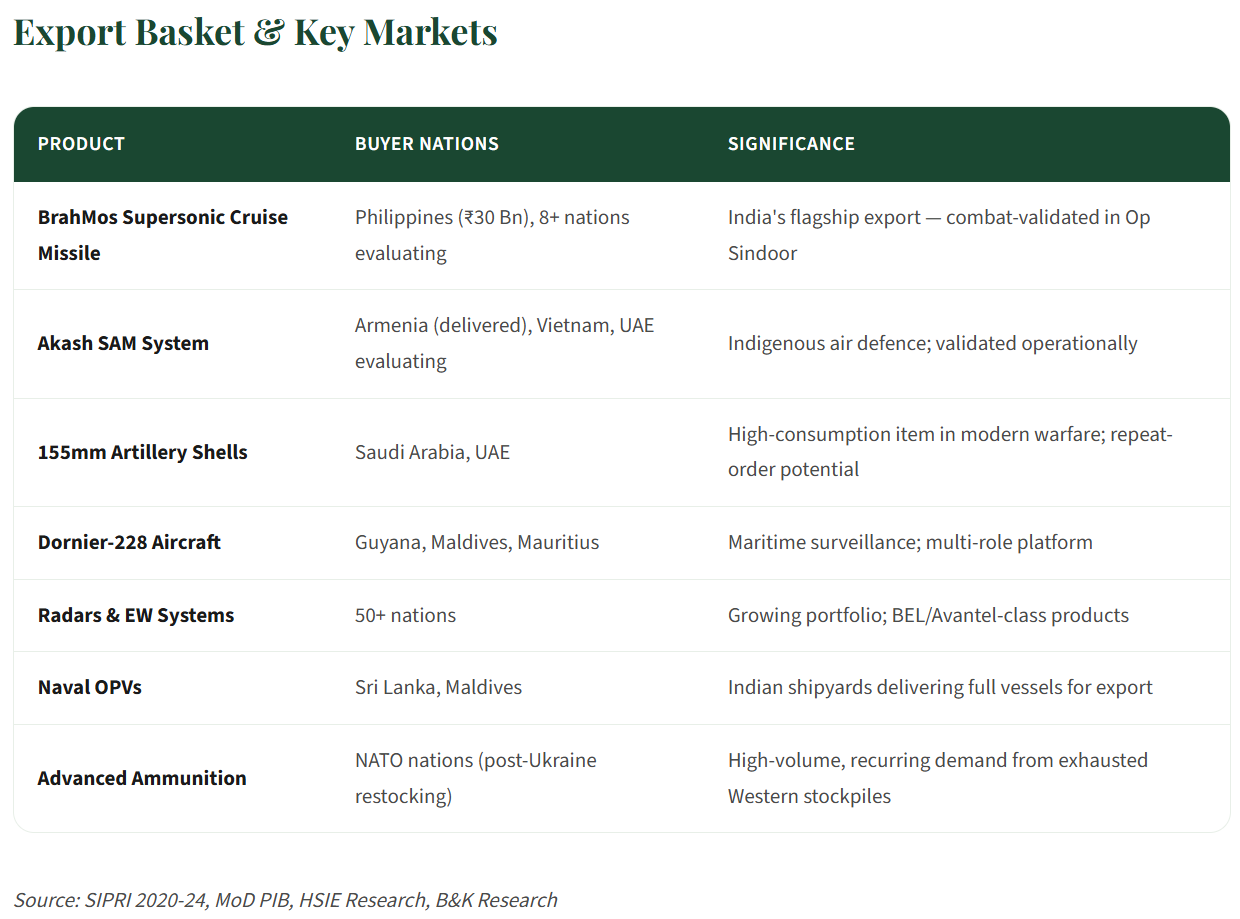
₹7.84 Trn total (+15% YoY) — 14.7% of Union Budget, ~2.0% of GDP
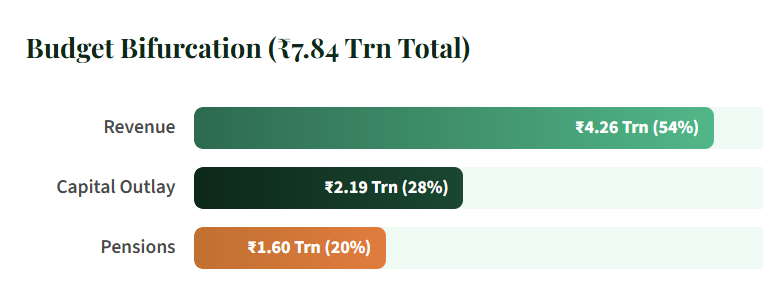
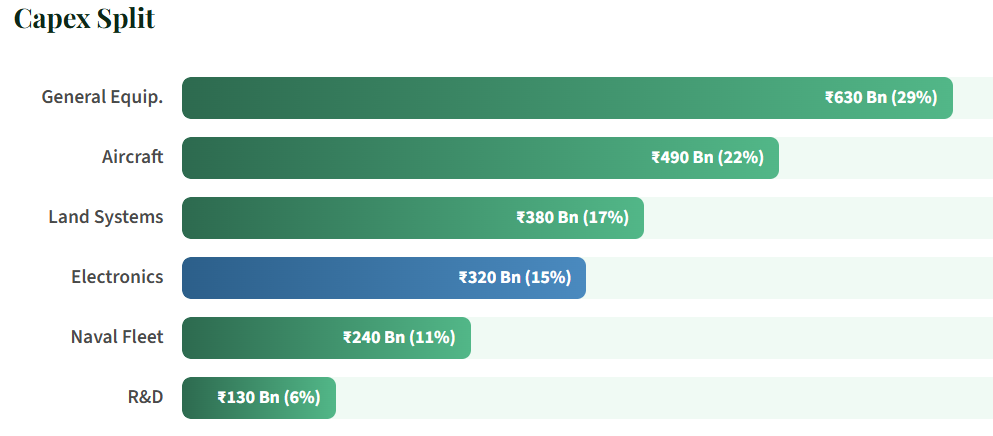
🎯 The Air Force dominates capital allocation at 39–44%, followed by Navy (22–33%) and Army (18–31%). A strict mandate requires 75% of this capital to be sourced from domestic vendors.
From 65–70% import dependency in 2000 to 75% domestic mandate today.
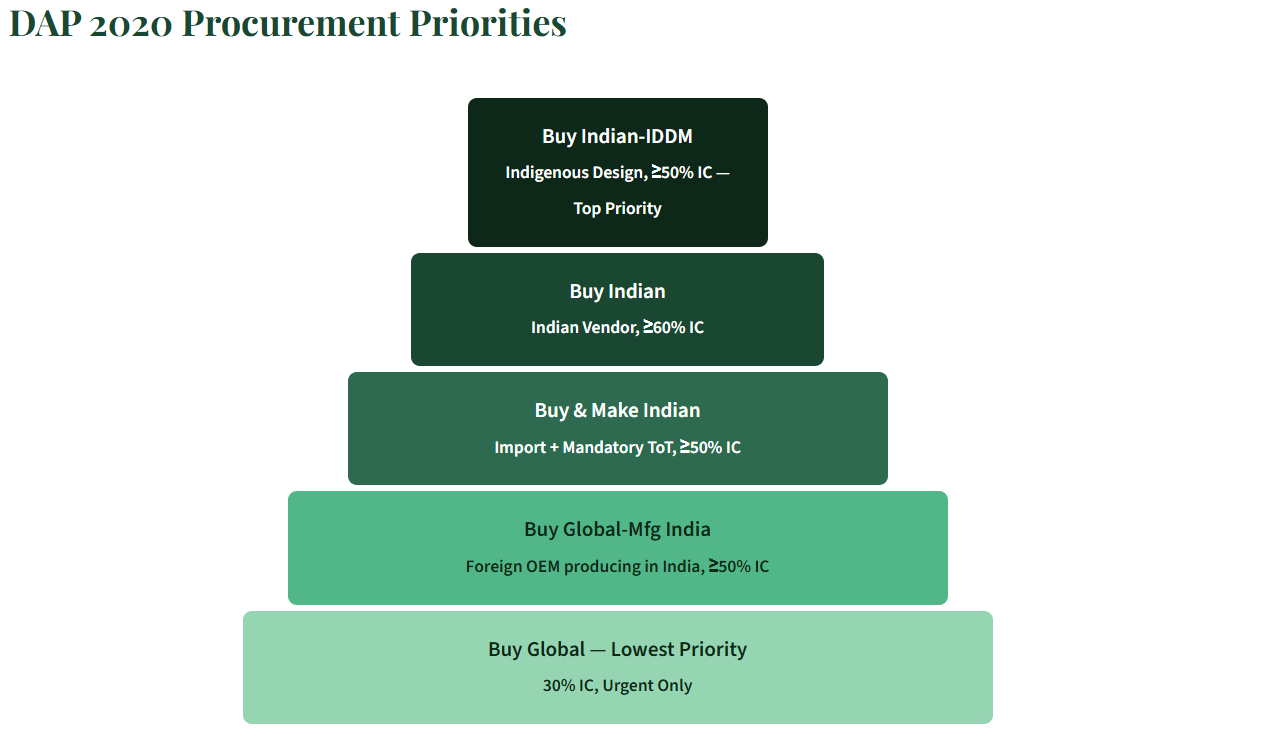
The SRIJAN portal allows MSMEs to bid directly on 4,600+ imported items, shifting ₹75.7 Bn in DPSU orders to local vendors. Two defence corridors (UP: 6 nodes, TN: 5 nodes) have attracted ₹300+ Bn in MoUs. FDI is now allowed up to 74% via automatic route.

Real-world combat validation of Indian systems has drastically shortened procurement timelines.
In April 2025, India’s Operation Sindoor struck 9 targets in Pakistan/AJK, field-proving indigenous systems like BrahMos. This single event triggered a ₹3.3 Trn AoN approval wave and unleashed fast-track procurement across drones, loitering munitions, and counter-UAS systems.

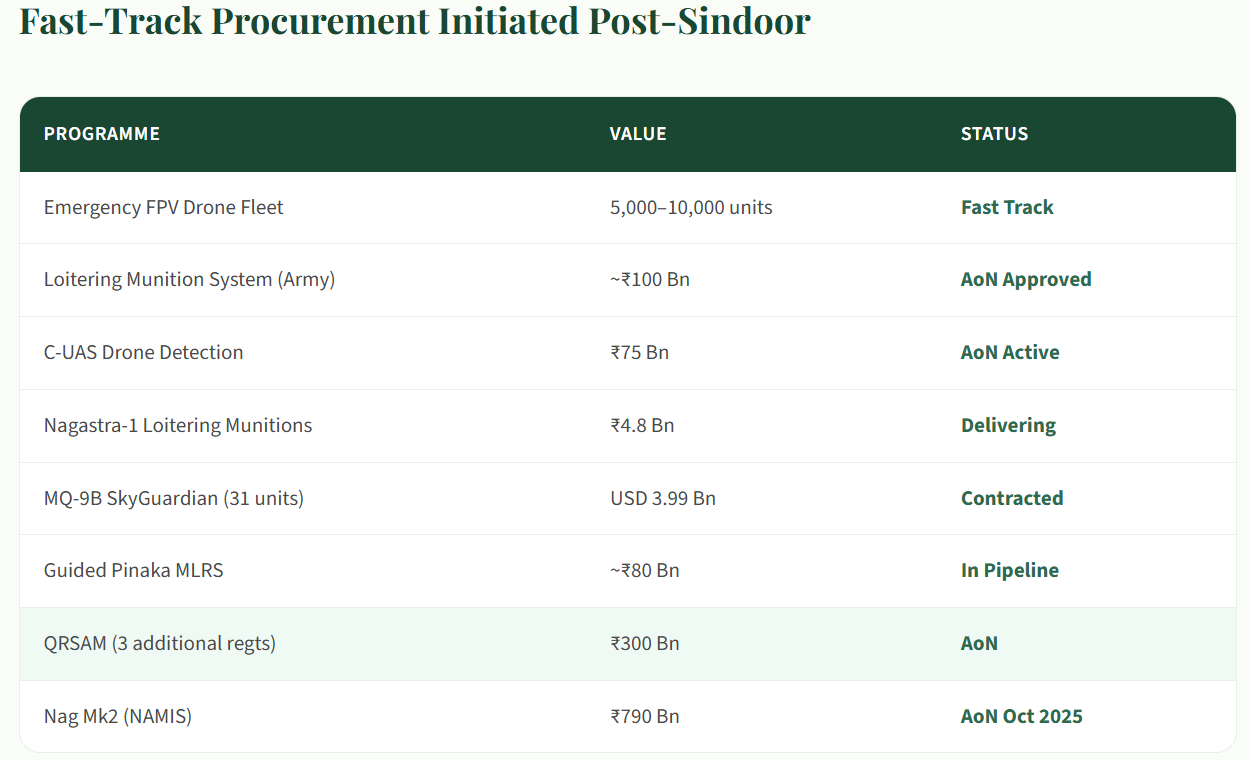
A comprehensive indigenous capability build spanning air, naval, missile, space, cyber, and directed-energy domains.
India is not just buying equipment — it is building an indigenous defence-industrial ecosystem across 8 capability domains under the Atmanirbhar Bharat vision. These programs represent the next 10–15 years of capital allocation and industrial growth.
1. Air Combat Platforms
AMCA — 5th-Gen Stealth Fighter (fly 2029)
Tejas Mk2 — 4.5-Gen (fly 2026-27, ₹720 Bn)
TEDBF — Carrier-borne fighter
Ghatak UCAV — Stealth unmanned wing
MRFA 114 jets — ~₹1,600 Bn
CATS Warrior — Manned-unmanned teaming
2. Missiles & Strike Systems
ET-LDHCM & BrahMos-II — Hypersonic
Project Vishnu — HCM variants
Astra Mk-2/3 — Beyond Visual Range
Pralay / BrahMos-NG — TBM/LACM
Akash-NG / QRSAM / VSHORADS — Air Defence
3. Air Defence — Sudarshan Chakra
Mission Sudarshan Chakra — Nationwide shield
Project Kusha — Long-range SAMs
IADWS — Counter-drone / C-UAS
Akashteer / IACCS — C2 sensor fusion
Anti-Hypersonic — Next-gen interceptors
4. Naval & Submarine Programs
P-75(I) — 6 AIP submarines (₹700 Bn)
Project 76 & 77 — Indigenous SSKs/SSNs
S5-Class SSBN — Nuclear deterrent
IAC-II / IAC-III — CATOBAR carriers
USV & Torpedo — Autonomous swarms
5. Space Defence & Surveillance
SBS-III — ISR/Comms/Nav satellites
Spy Sat Network — SAR constellation
Joint Space Doctrine — DSA-led
Threat Detection / ASAT — LiDAR/BMD
6. Directed Energy & AI Weapons
Sahastra Shakti — Anti-drone laser
Project DURGA II — Multi-platform DEW
AI Kill-Web — Autonomous C2
High-Power Microwave — Anti-drone
Swarms & EW — ALFA-S, DRFM
7. Quantum & Cyber Warfare
Military Quantum Mission — Comm, Compute, Sense
QKD & Crypto — Unhackable comms
Quantum Radar / Nav — Stealth detection
Cyber Defence — AI-driven framework
Quantum Computing — Simulation/decisions
8. Engines, Comms & Enablers
AMCA Engine — Indigenous/co-development
Kaveri Dry — Ghatak engine
Scramjet Tech — Hypersonic propulsion
Netra / MTA — AEW&CS / transport
Secure Satcom — Tri-service satellites
iDEX & AIDWS — Startups / Big data / LLMs
India’s defence program landscape spans from conventional platforms (fighters, submarines) through next-gen systems (hypersonics, directed energy) to frontier technologies (quantum, AI-autonomous). The 15-year TPCR-2025 technology roadmap accelerates indigenous capabilities across all domains — this is not a single procurement cycle, but a generational industrial build.
What makes the Indian A&D opportunity different from a typical sector cycle is the convergence of multiple independent forces — each of which alone would be significant, but together create a self-reinforcing supercycle.
On the aerospace side, the Western supply chain is structurally broken — labour shortages, financial stress across tiers, 17,000 aircraft in backlog, and 7-year lead times. China is no longer a safe outsourcing answer. India, with its deep auto-ancillary base, cost advantage, and growing OEM certifications, is absorbing this capacity shift — not as a possibility, but as an ongoing reality already visible in Boeing and Airbus supplier expansion.
On the defence side, the picture is equally compelling. Global military spending is at an all-time high of $2,653 Bn with accelerating CAGRs. Modern warfare — as seen in Ukraine, Gaza, and the Red Sea — has permanently changed the character of conflict toward high-consumption, drone-heavy, precision-strike warfare. India’s own Operation Sindoor validated indigenous systems under combat conditions, triggering a ₹3.3 Trn procurement wave. Simultaneously, the traditional global suppliers — Russia consumed by its own war, Israel stretched across multiple fronts, the USA burdened by political conditionality — have created a structural gap in global arms supply that India is uniquely positioned to fill.
Underneath all of this sits a 25-year policy evolution — from 65–70% import dependency to a 75% domestic sourcing mandate — backed by ₹7.84 Trn in FY27 budget, 16,000+ MSMEs in the ecosystem, 2,851+ items restricted from import, and 300+ iDEX startups building the next generation of defence technology. This is not a single budget cycle. This is a structural, multi-decade industrial build — and we are in the early innings.
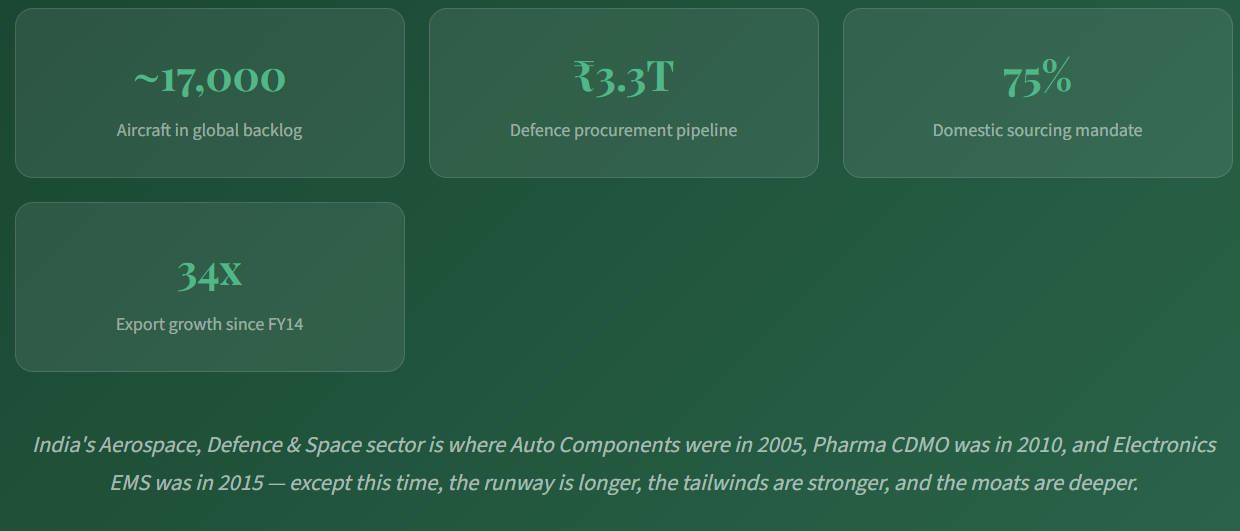

Electronic Manufacturing Services
Blue Water, Big Ambition: Indian Naval Surge
India's naval shipbuilding sector is undergoing a historic transformation. With a ₹4,780+ Bn modernisation pipeline, the investment opportunity this creates.
As geopolitical competition intensifies across global sea lanes, maritime dominance is becoming a strategic priority for major economies.
Chokepoints like the Strait of Hormuz — through which a significant share of global oil flows — underscore how naval strength directly shapes energy security and trade stability.
India is emerging as one of the most consequential players in this shift.
Following the commissioning of INS Tamal, India has signalled a decisive pivot from foreign procurement toward indigenous shipbuilding capability.
This is not a temporary policy adjustment — it reflects a structural transition in how India intends to build and sustain its naval power.
The numbers reinforce this direction. India’s naval budget has grown from ₹45,000 crore in FY20 to ₹97,000 crore in FY26 more than doubling in six years.
A modernisation pipeline exceeding ₹4,780 billion is now underway, spanning new vessels, advanced systems, and supporting infrastructure.
For investors, this signals more than a defence sector trade.
Naval shipbuilding is a long-cycle industrial theme, capital-intensive, policy-backed, and underpinned by a deep ecosystem of ancillary suppliers, component manufacturers, and engineering services.
The strategic case for India’s maritime self-reliance is clear. The investment case is building alongside it.
For details you can visit our website here:
📌https://niveshaay.smallcase.com/
Explore our Blog section here:
📌https://niveshaay.com/blog-type/deep-dives/
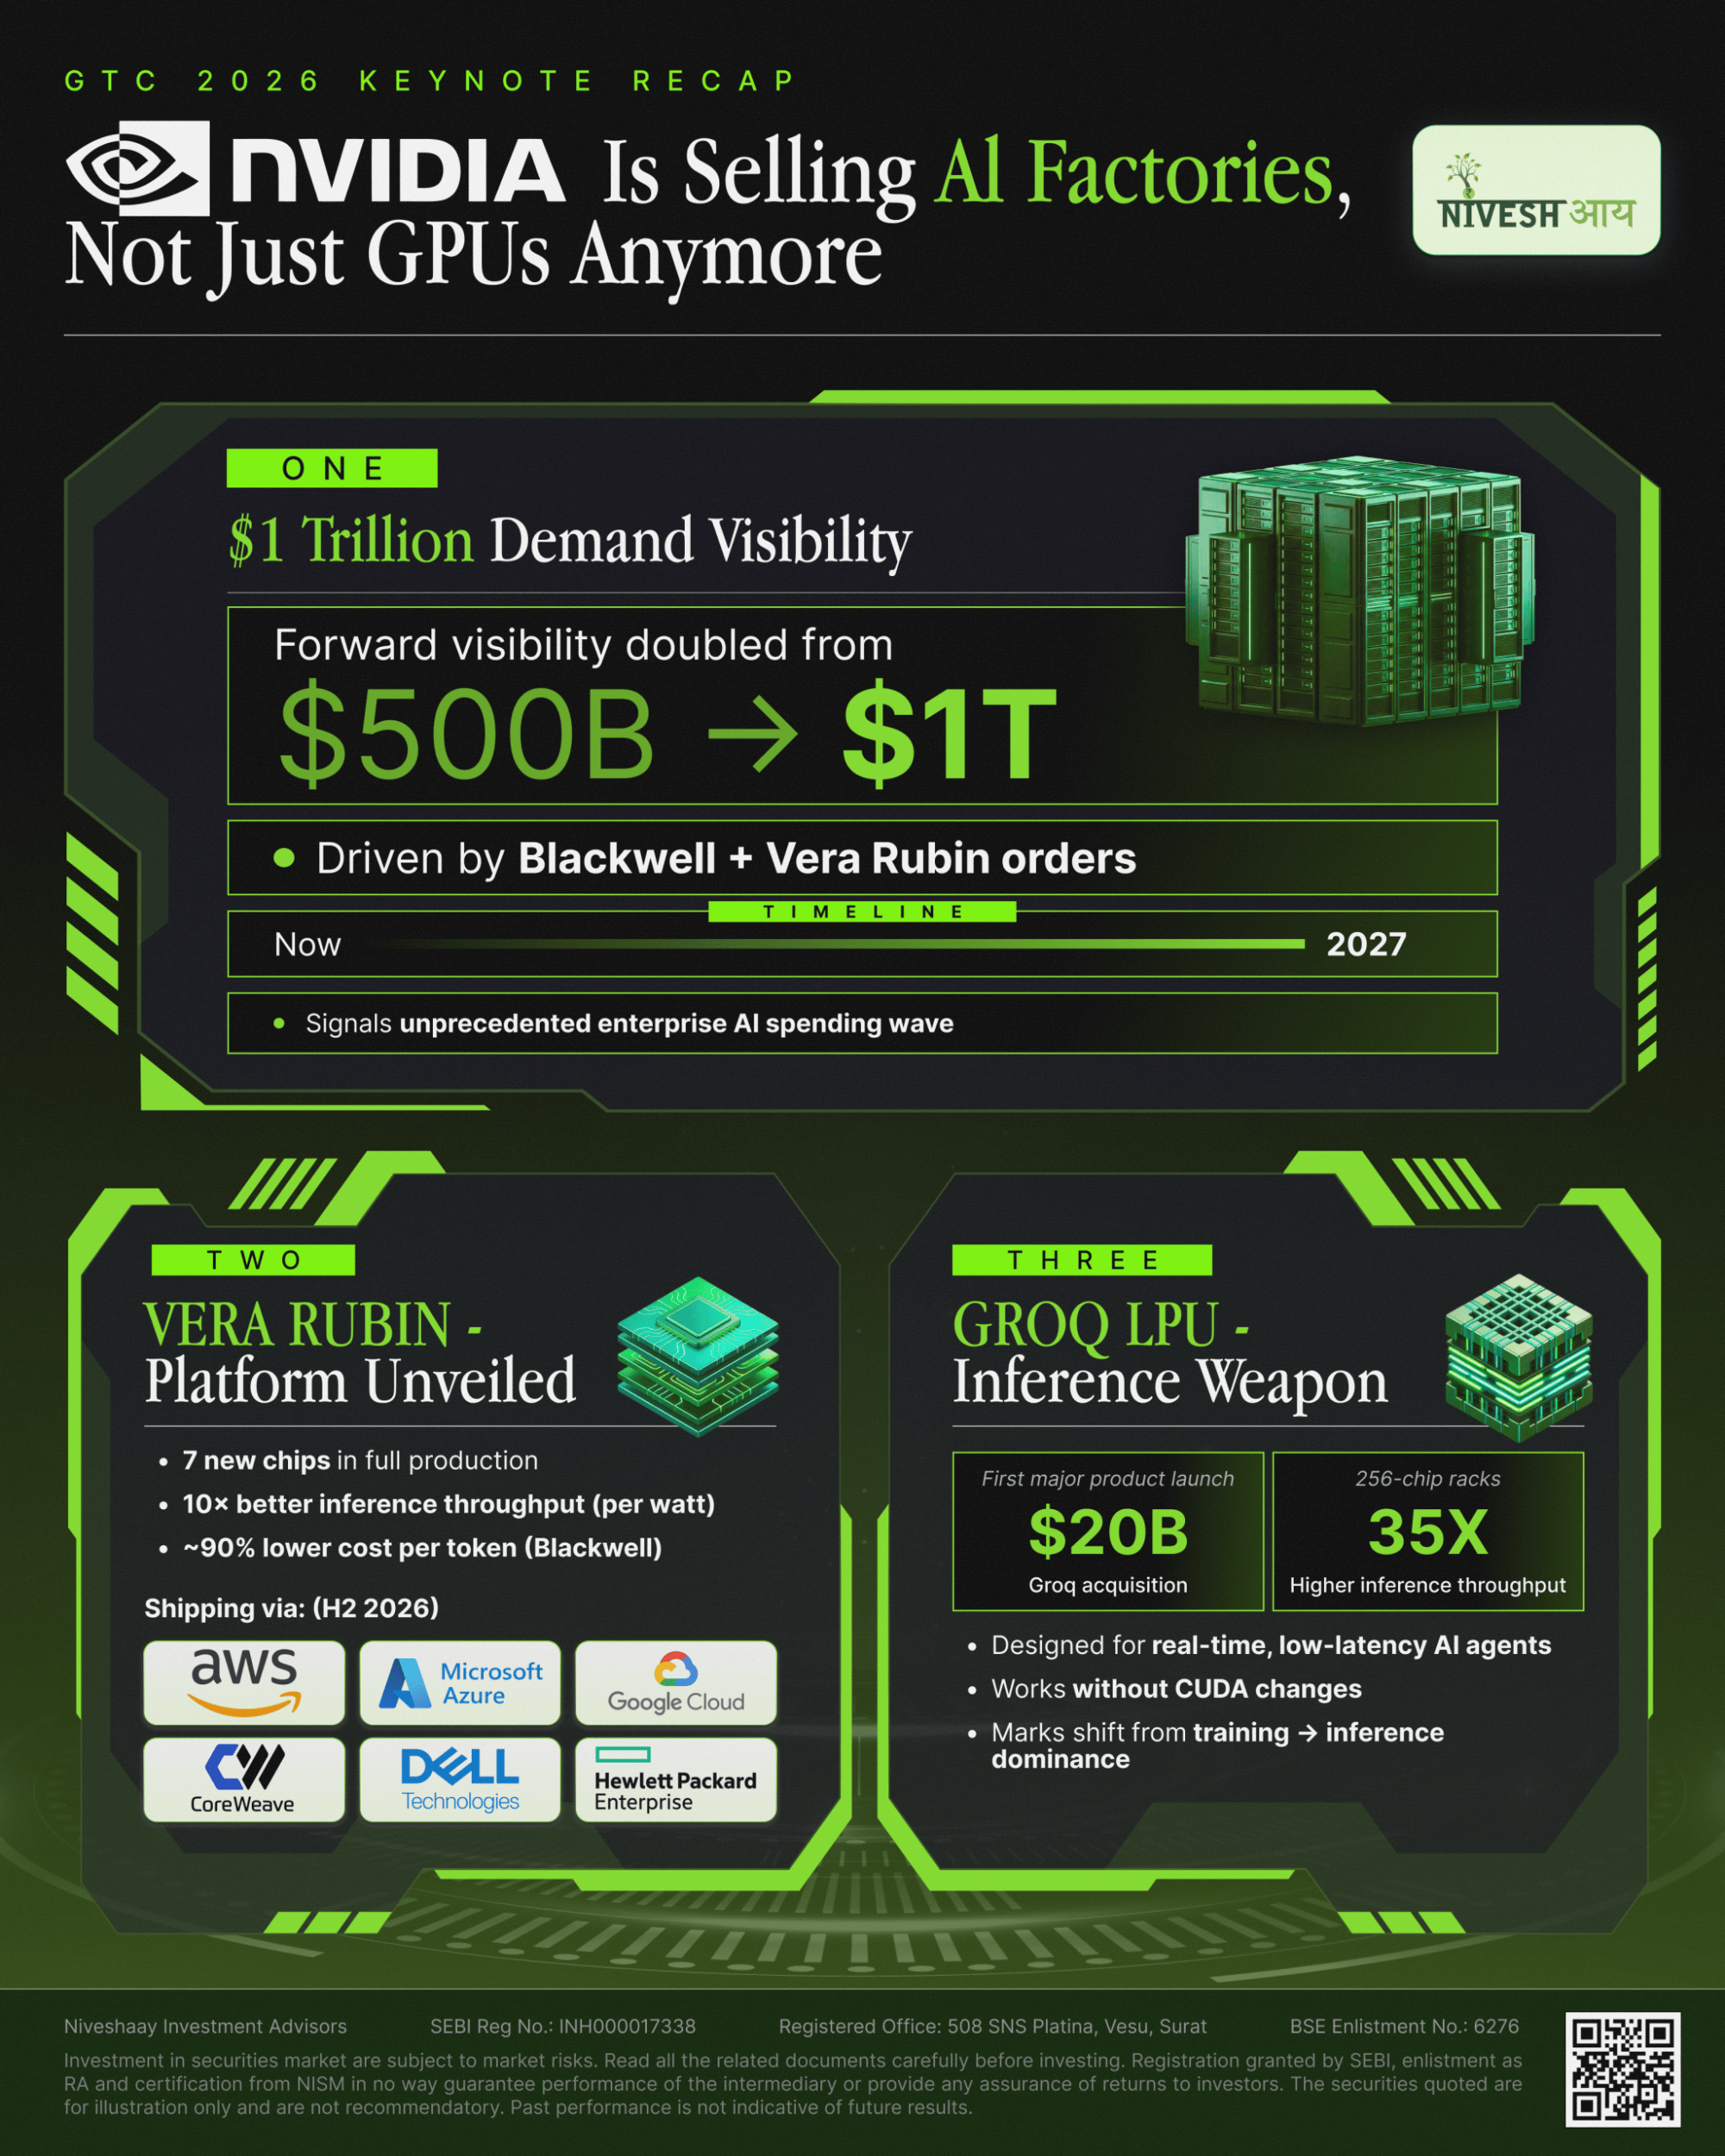
AI & Data Center
NVIDIA GTC 2026: From GPU Maker to AI Infrastructure Giant
NVIDIA GTC 2026 revealed a $1 trillion AI infrastructure play. Vera Rubin, Agentic AI, Nemotron — here's what investors need to know about the structural shift.
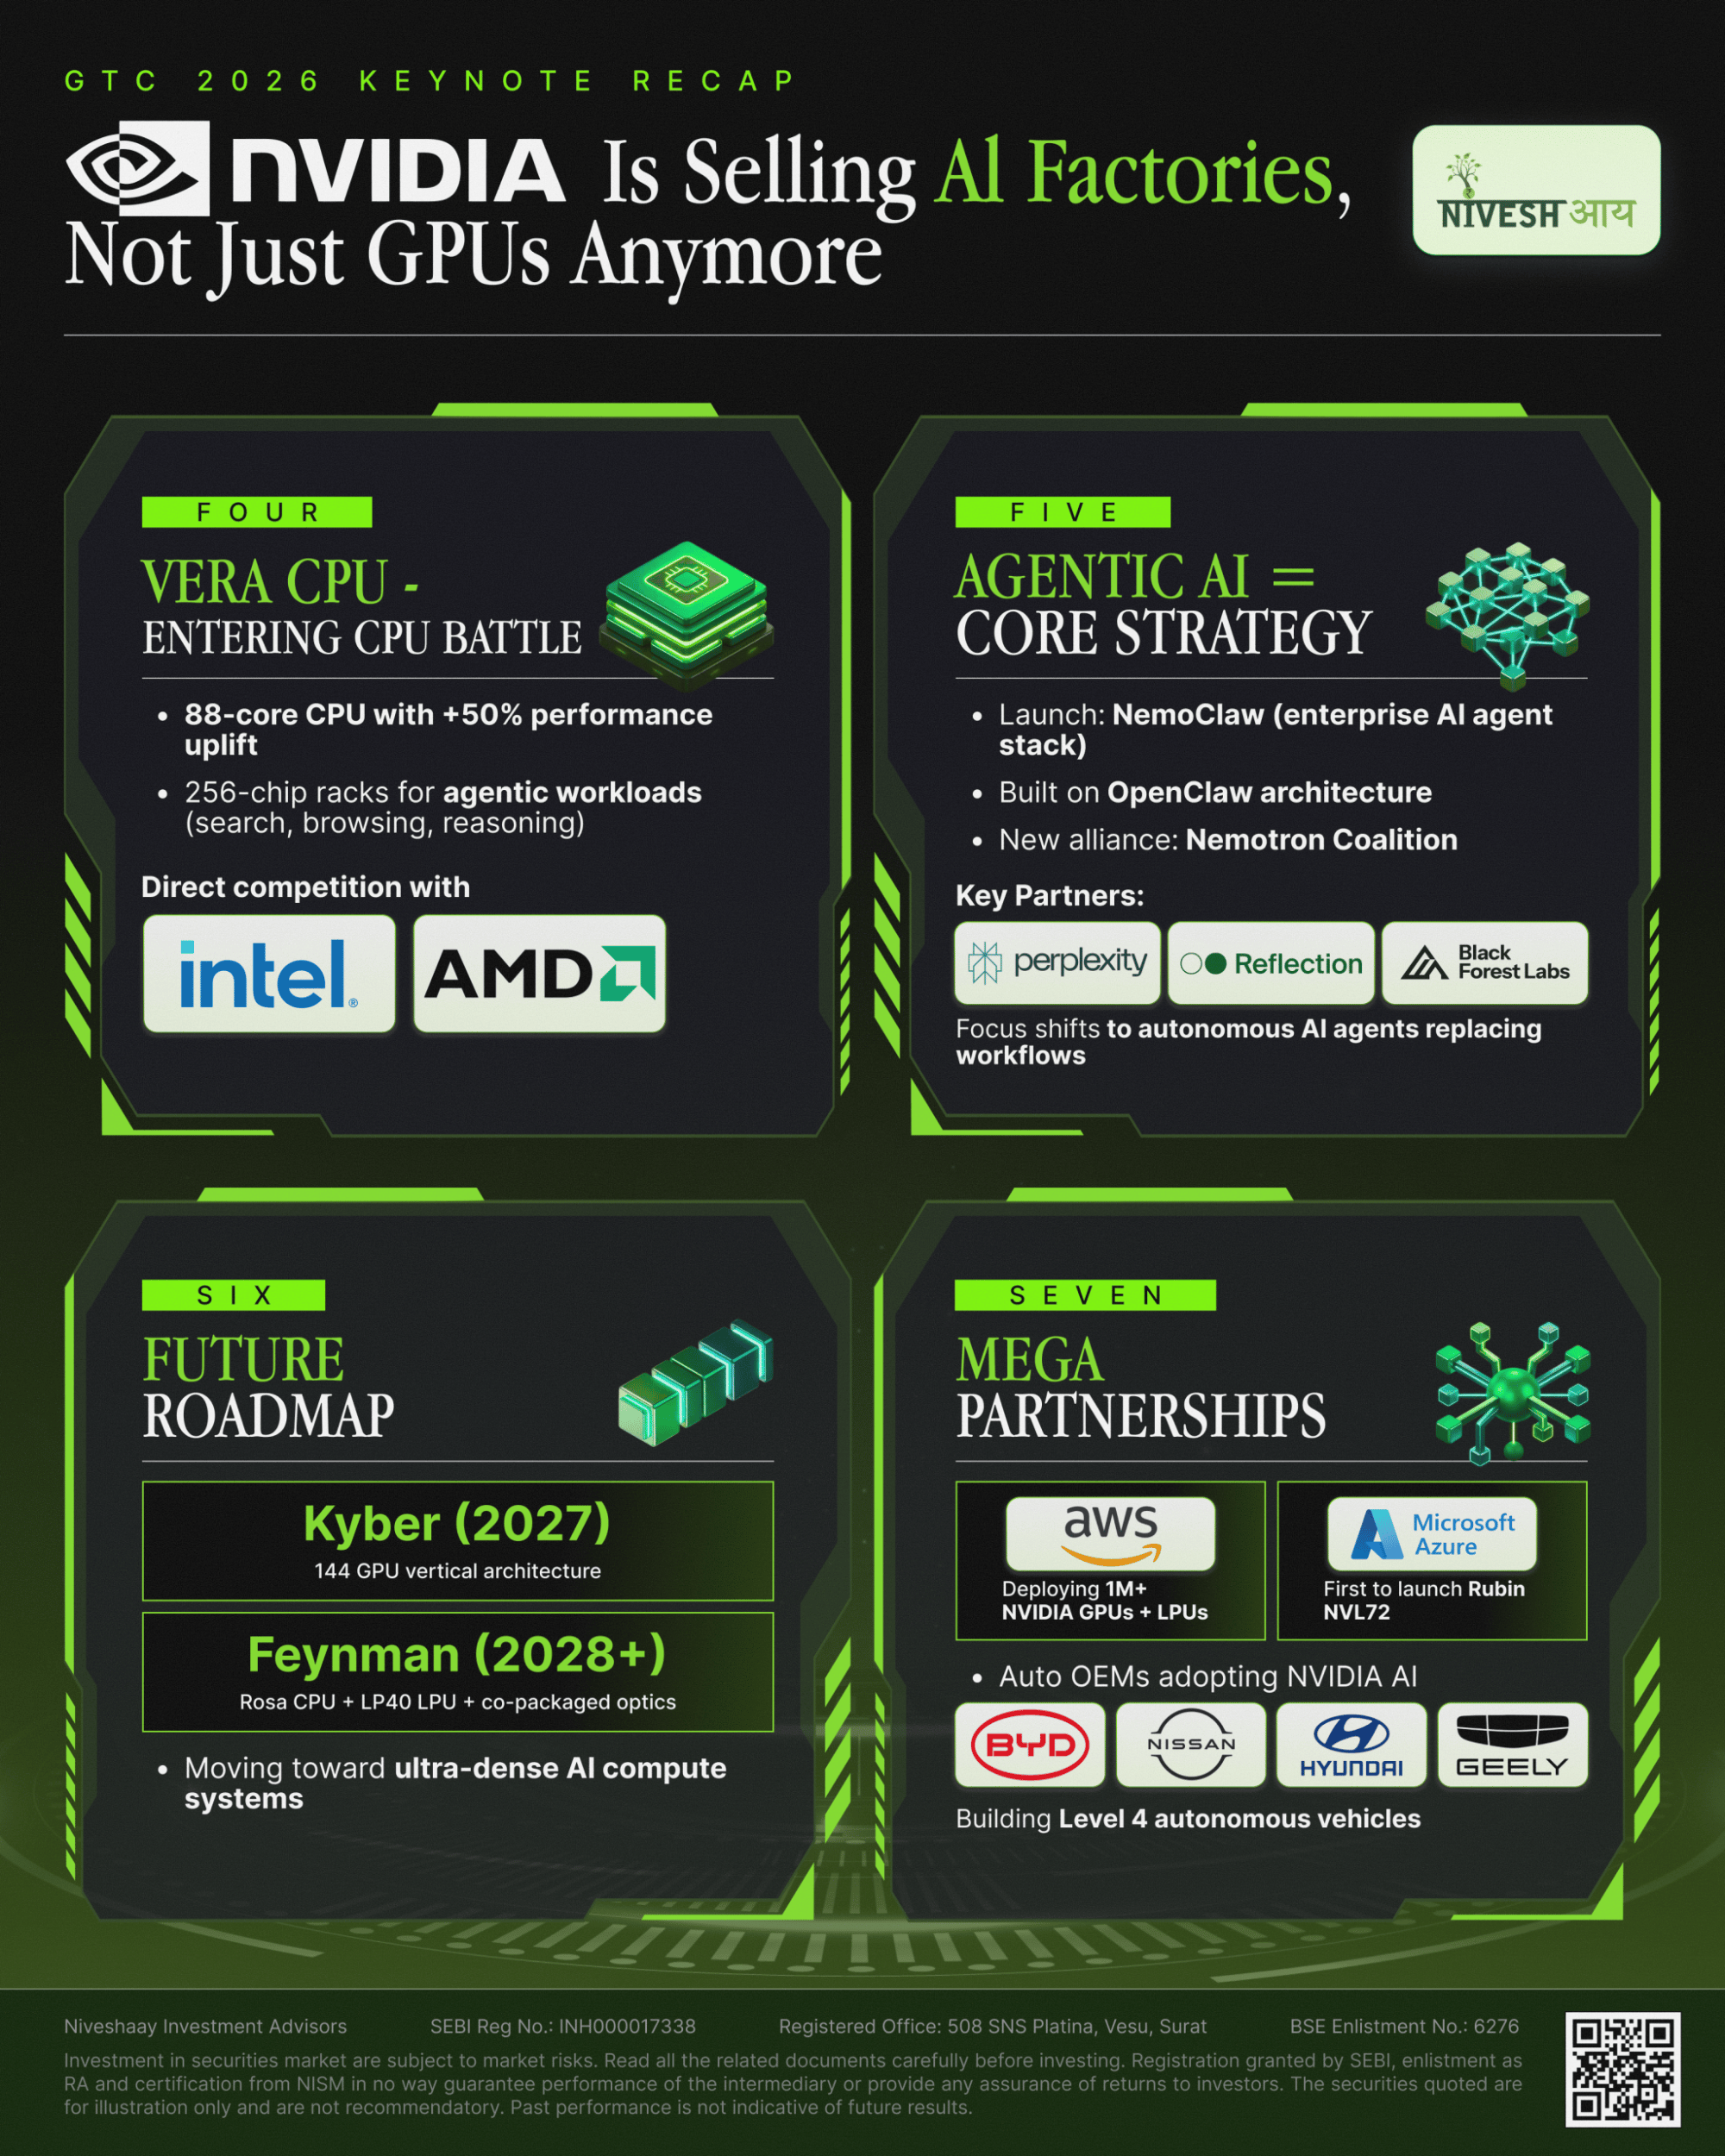
NVIDIA is no longer just a GPU company. It is building the backbone of the AI economy.
From GPUs to a full-stack AI infrastructure player, NVIDIA’s GTC 2026 showcased a clear shift—GPU + CPU + ASIC + Software + AI Agents. With platforms like Vera Rubin redefining compute efficiency and massive deals like the $20B Groq LPU deployment, the company is pushing boundaries in speed, cost, and scalability of AI workloads.
The bigger story lies in Agentic AI—through Nemotron (AI brain) and OpenCLAW (AI operating layer)—enabling machines to autonomously handle real-world tasks like reads your emails, updates your CRM, Manage Finances, book Travel Tickets and executes tasks for you. Combined with deep partnerships across AWS, Azure, and global Auto OEMs, NVIDIA is positioning itself at the center of a $1 trillion Revenue Opportunity through AI infrastructure
“AI won’t just assist work—it will execute it.”
For investors, this is not about NVIDIA alone. It signals a structural shift across industries—from IT services and cloud to manufacturing, automotive, and enterprise software—where AI infrastructure becomes the new oil. The question is no longer if AI will disrupt, but who captures value across this stack.
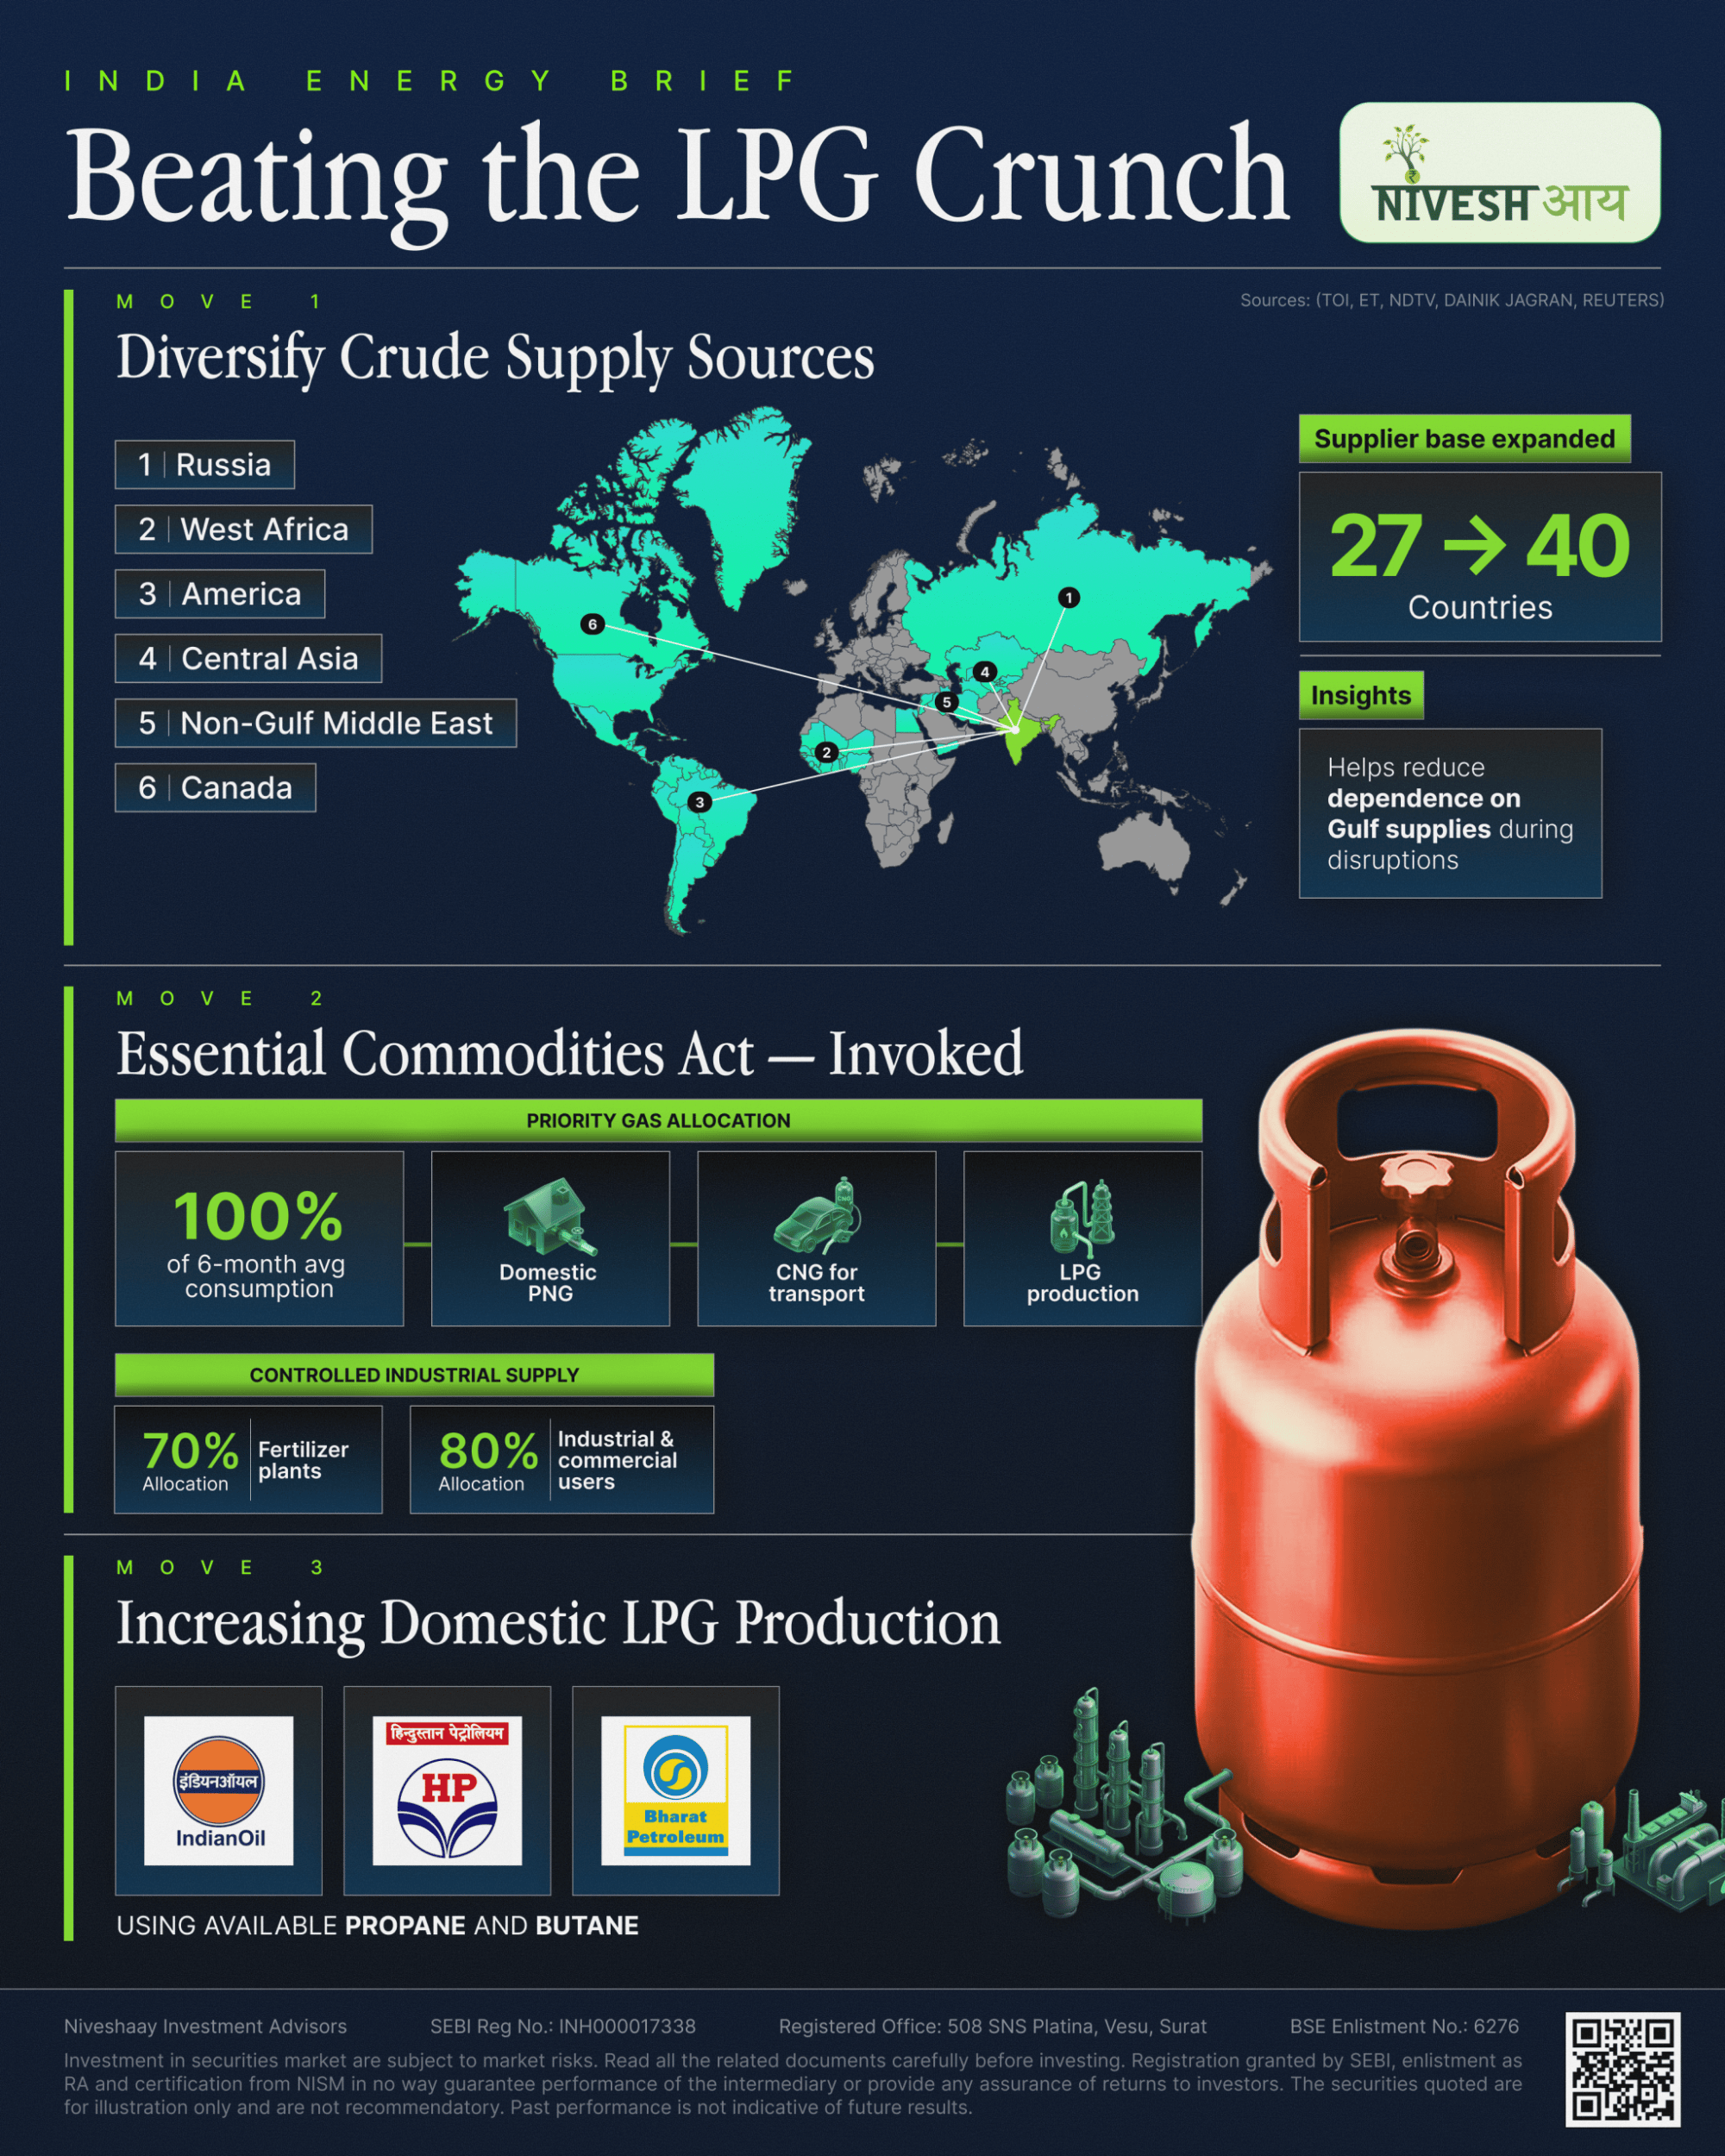
Power & Renewable Energy
India’s Game Plan to Beat the LPG Crunch
India, the second-largest importer of LPG, consumed 33.15 million metric tonnes of cooking gas last year. Nearly 85–90% of that supply passes through the Strait of Hormuz, making it a critical route for India’s energy security.
India, the second-largest importer of LPG, consumed 33.15 million metric tonnes of cooking gas last year. Nearly 85–90% of that supply passes through the Strait of Hormuz, making it a critical route for India’s energy security.
Amid rising geopolitical tensions, India is reducing dependence on the Gulf by diversifying crude supply from Russia, West Africa, the Americas, Central Asia, Canada, and the non-Gulf Middle East.
Domestically, refiners such as Indian Oil Corporation, Hindustan Petroleum Corporation, and Bharat Petroleum Corporation have been asked to maximise LPG production using available propane and butane.
With households consuming 6–7 LPG cylinders a year, a refill roughly every 50–55 days, the government has invoked the Essential Commodities Act to prioritise gas allocation for domestic use.
The strategy is clear:
• Diversify supply
• Strengthen domestic production
• Reduce exposure to regional disruptions
Because behind every kitchen flame lies a global energy supply chain that must remain resilient.

AI & Data Center
AI in Indian Healthcare
AI is steadily reshaping healthcare in India. The market is projected to reach $25.6B by 2027, growing at a 20%+ CAGR. But the real story lies beyond market size. With 7.9 doctors per 10,000 people, far below the global average of 20.2. AI is increasingly becoming a force multiplier for an overburdened healthcare system.


AI is steadily reshaping healthcare in India. The market is projected to reach $25.6B by 2027, growing at a 20%+ CAGR.📈
But the real story lies beyond market size. With 7.9 doctors per 10,000 people, far below the global average of 20.2. AI is increasingly becoming a force multiplier for an overburdened healthcare system.🏥
As adoption accelerates, investors are beginning to focus on segments where technology, infrastructure, and capital are converging.
Where capital is flowing:
👉 Pharma services (CDMO/CRO): ~$16B market in FY24, attracting ~55% of healthcare fund flows
👉 Healthtech: ~$7B market, 2× growth since FY20, with rising investor preference for enterprise-led models
👉 Medtech & Biotech: ~$2.5B and ~$4B markets respectively, emerging as green-shoot innovation areas
As digital infrastructure deepens and AI capabilities evolve, India’s healthcare ecosystem is gradually shifting toward a more data-driven, technology-enabled future—unlocking new opportunities for innovation and long-term capital.🚀
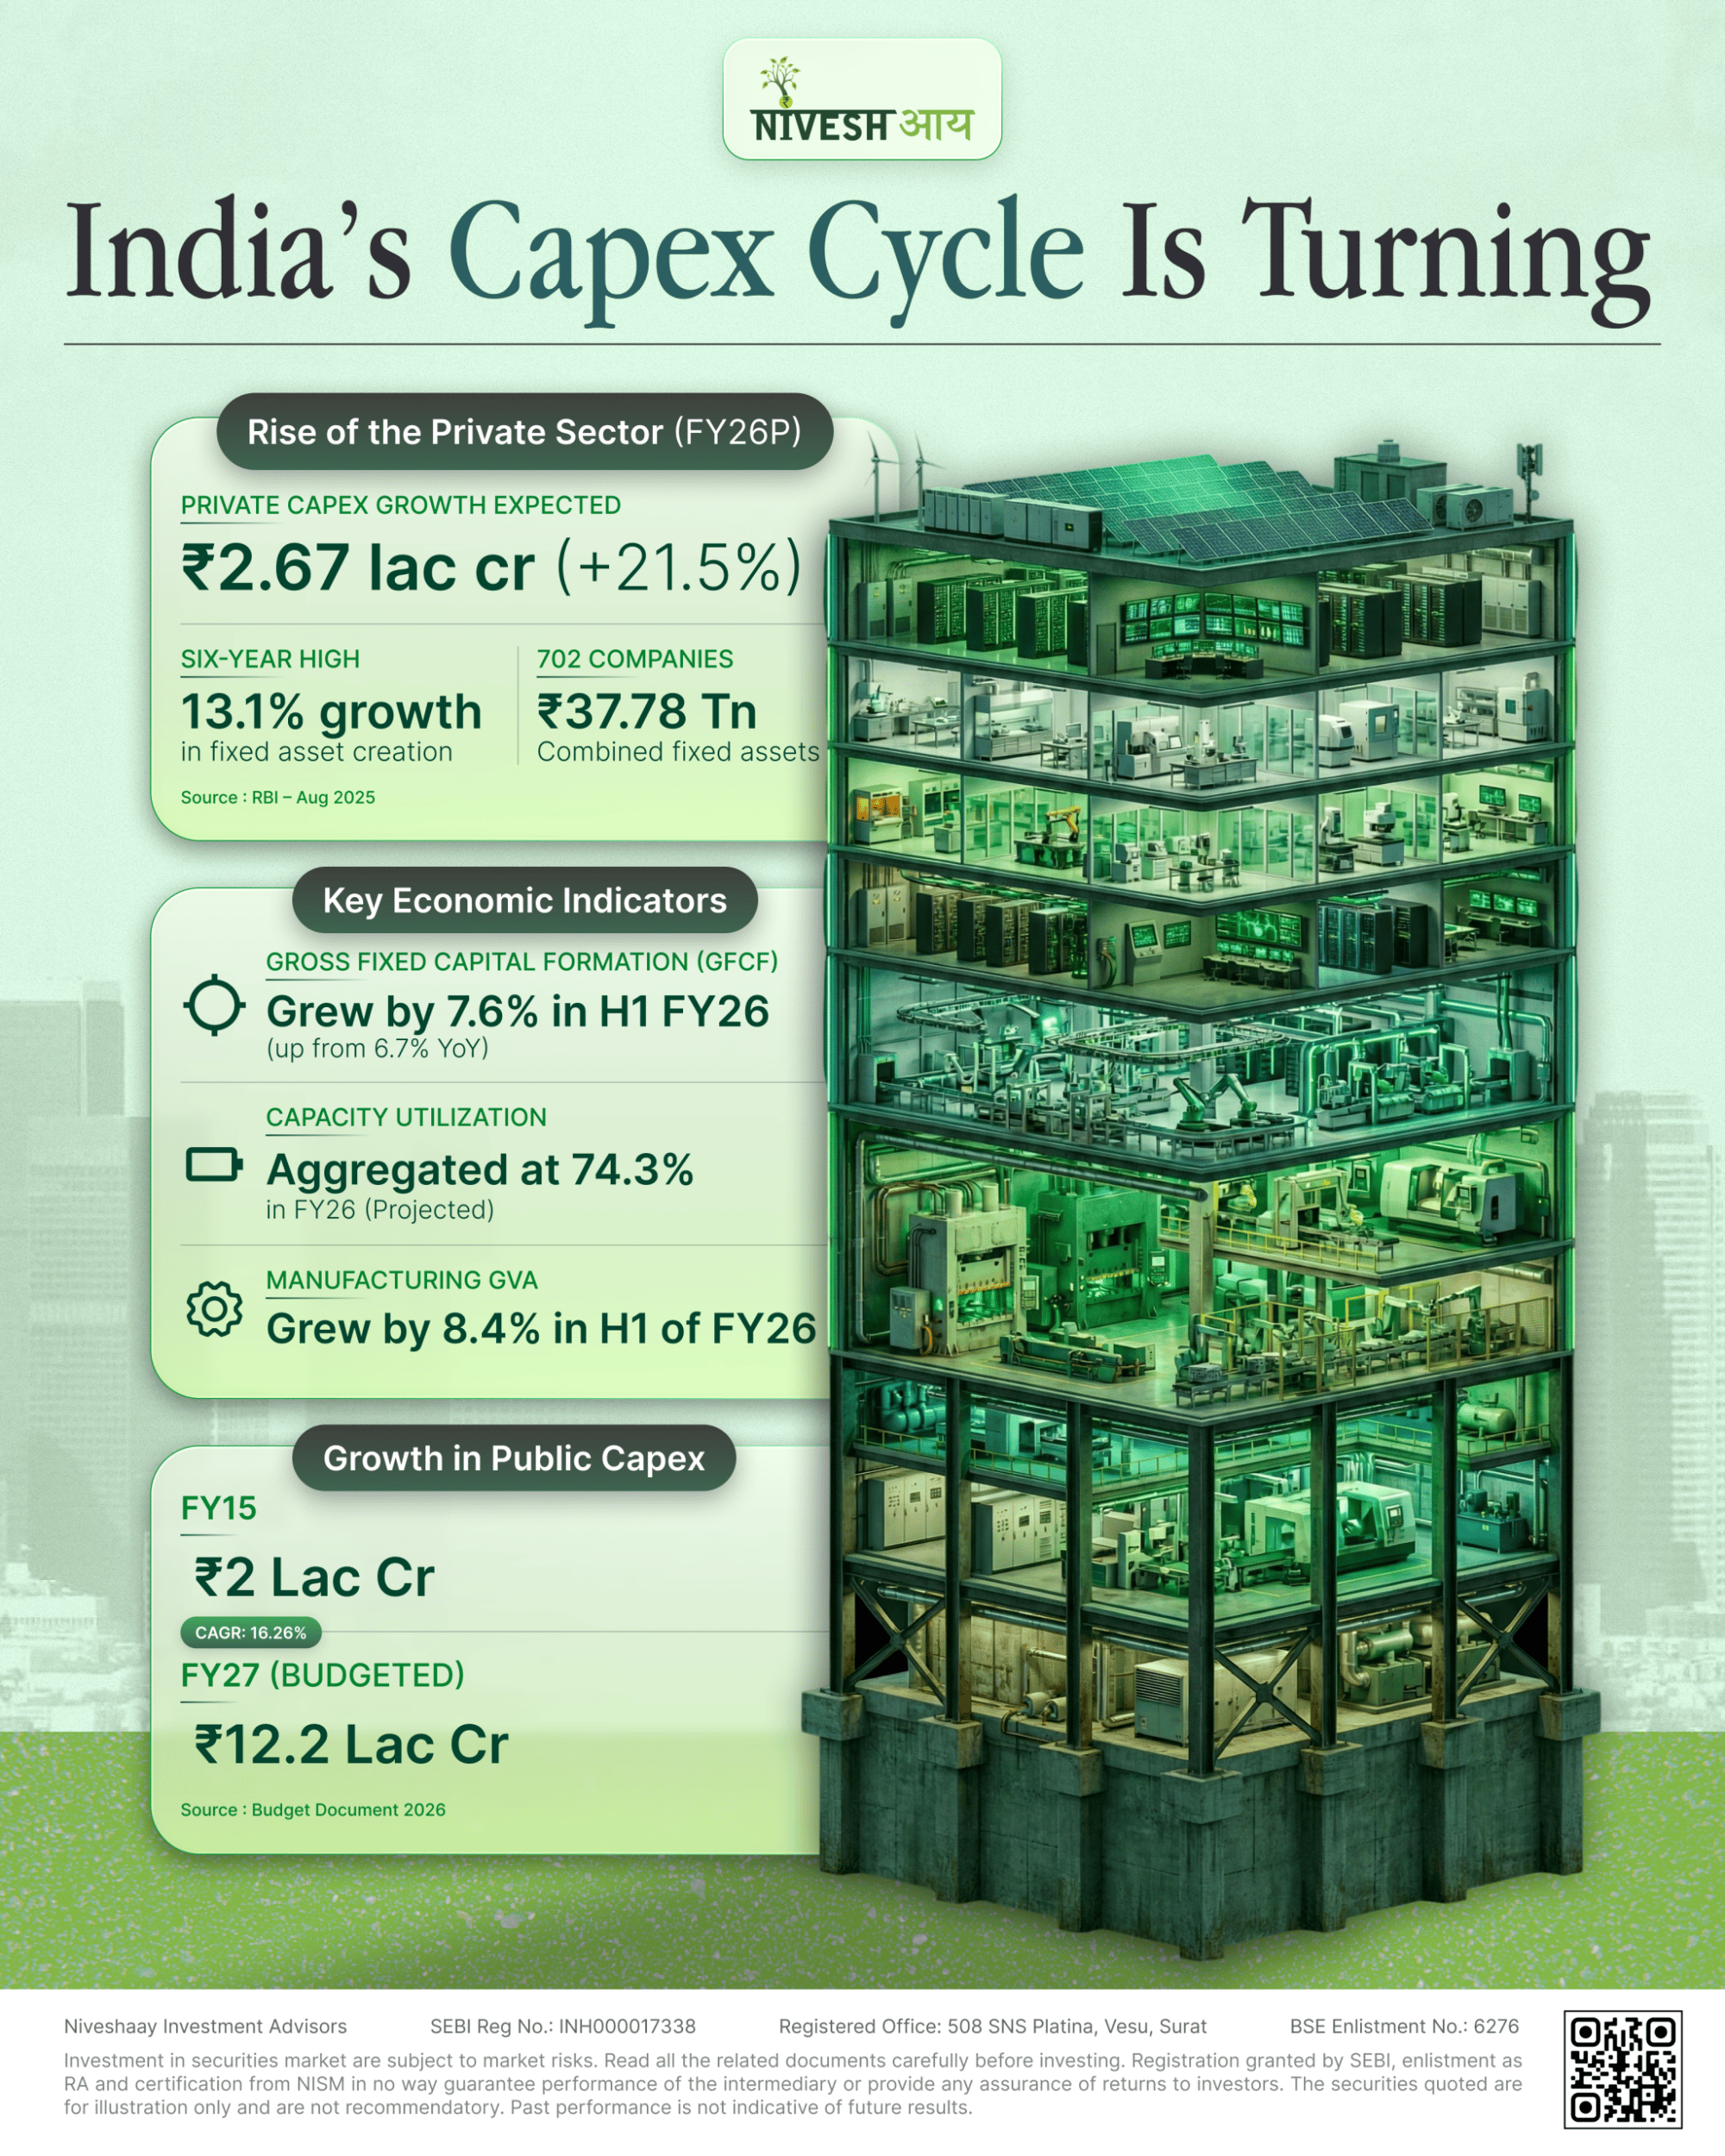
AI & Data Center
India’s Capex Cycle is Turning
India’s long-awaited private capex revival is no longer a whisper, it’s turning into momentum 🚀📊. After years of government-led spending, corporate India is stepping forward with conviction, pushing asset creation to multi-year highs and capacity utilisation toward key inflection levels.
The Big Pivot: India’s Capex Cycle Shifts into Top Gear
For years, the Indian private sector capex cycle was “just around the corner.” Today, the data suggests it has finally arrived, but with a twist that every investor needs to understand.
The Lead: A Six-Year High
According to a recent Business Standard article, fixed asset creation by leading listed firms hit a six-year high of 13.1% in H1FY26. This isn’t just a statistical blip—it’s a fundamental shift. While the government has been the sole engine of growth for the last few years, the baton is finally being passed to the private sector. The combined fixed assets of 702 top companies have climbed to ₹37.78 trillion, spearheaded by Power, Cement, Automobiles, and Metals.
The Insight: It’s Not Just “Building Factories”
While the headline numbers look like a classic “industrial” boom, the Modern capex is becoming tech-heavy and efficiency-driven.Asset Light to Asset Right: It’s no longer just about massive “brownfield” expansions. Companies are investing in automation, digitalization, and green energy transitions to lower their long-term cost of production.
Data centers, semiconductors, and Renewables are leading the incremental investment surge, while traditional giants like Steel and Cement are tracking domestic demand growth.
Why This Matters for Your Portfolio
A capex cycle usually leads to a “multiplier effect.” When a cement major expands, it creates a tailwind for industrial machinery, logistics, and power stocks.
We are moving from a “Policy-led” cycle to an “Execution-led” cycle. For Investors, this signals a transition from defensive plays to growth-oriented cyclicals. The companies winning today aren’t just those spending the most, but those spending smartest—integrating technology to stay competitive in a global supply chain. With clean balance sheets and rising demand, India Inc. is no longer waiting for the future; they are building it.
Electric Vehicle & Ancillaries
Copper Prices May Dip, but Recycling Still Shines: Copper’s Second Act
A scrap dealer empties a gunny sack onto the floor, old phone chargers, a burnt motor, a bundle of dusty wires. It looks like junk until you remember what’s inside it. That dull reddish strand is the same metal that keeps an EV moving, a solar inverter humming, and an AI data center cool. Copper

A scrap dealer empties a gunny sack onto the floor, old phone chargers, a burnt motor, a bundle of dusty wires. It looks like junk until you remember what’s inside it. That dull reddish strand is the same metal that keeps an EV moving, a solar inverter humming, and an AI data center cool. Copper prices can swing with sentiment and cycles. But copper’s role in electrification is structural. And that’s why when primary supply takes years to respond, recycling comes into the picture; it isn’t a side story anymore. It’s turning into the main plot.
And that is exactly what this blog is trying to trace: how copper recycling is moving from the margins to the center of the value chain. As demand rises from grids, EVs, renewables, and data centers, secondary copper is becoming the fastest way to add supply without waiting a decade for new mines. The story now is not just about scrap, it is about scale, cleaner processing, policy support, and the companies building the rails for a more circular copper economy.
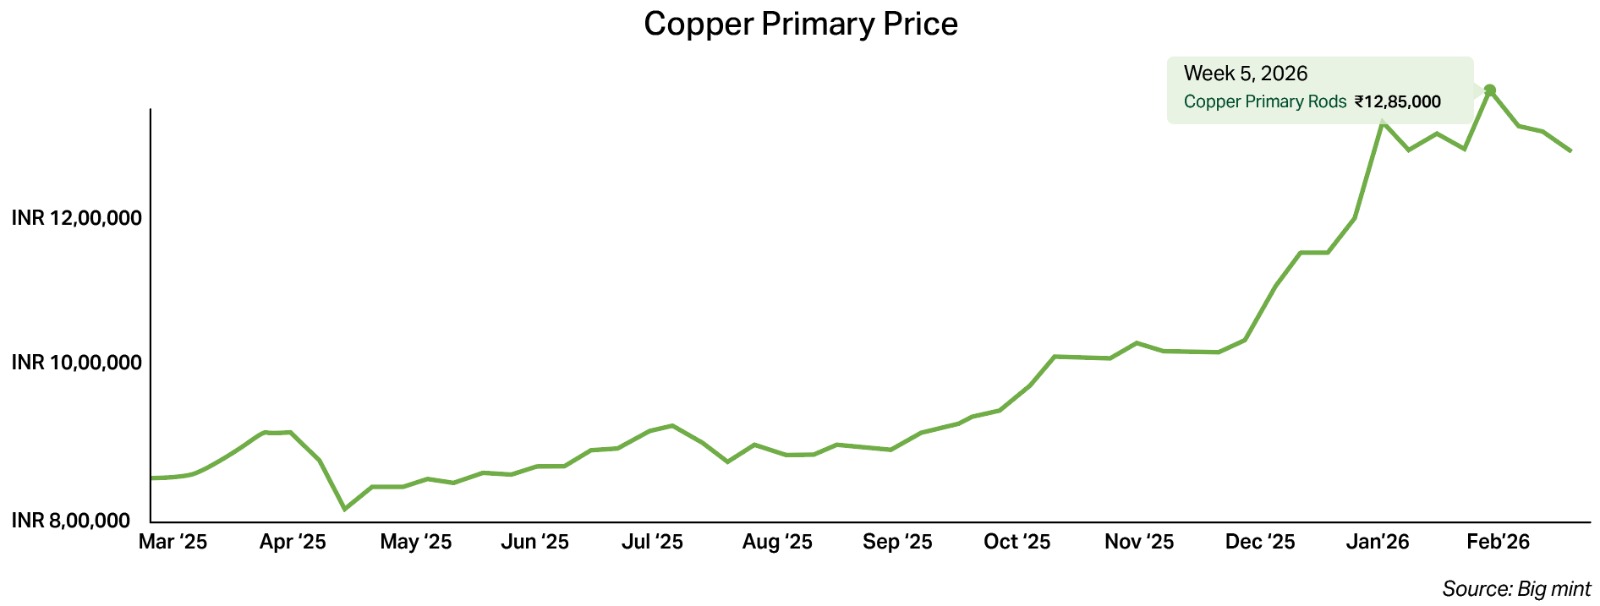
Copper’s Endless Appetite: Demand Signal’s a New Era
Copper is the bloodstream of modern infrastructure, conductive, corrosion‑resistant, ductile, and surprisingly hard to replace at scale. As grids expand, EV penetration rises, and computing moves into a data‑hungry AI era, copper demand keeps finding new lanes.
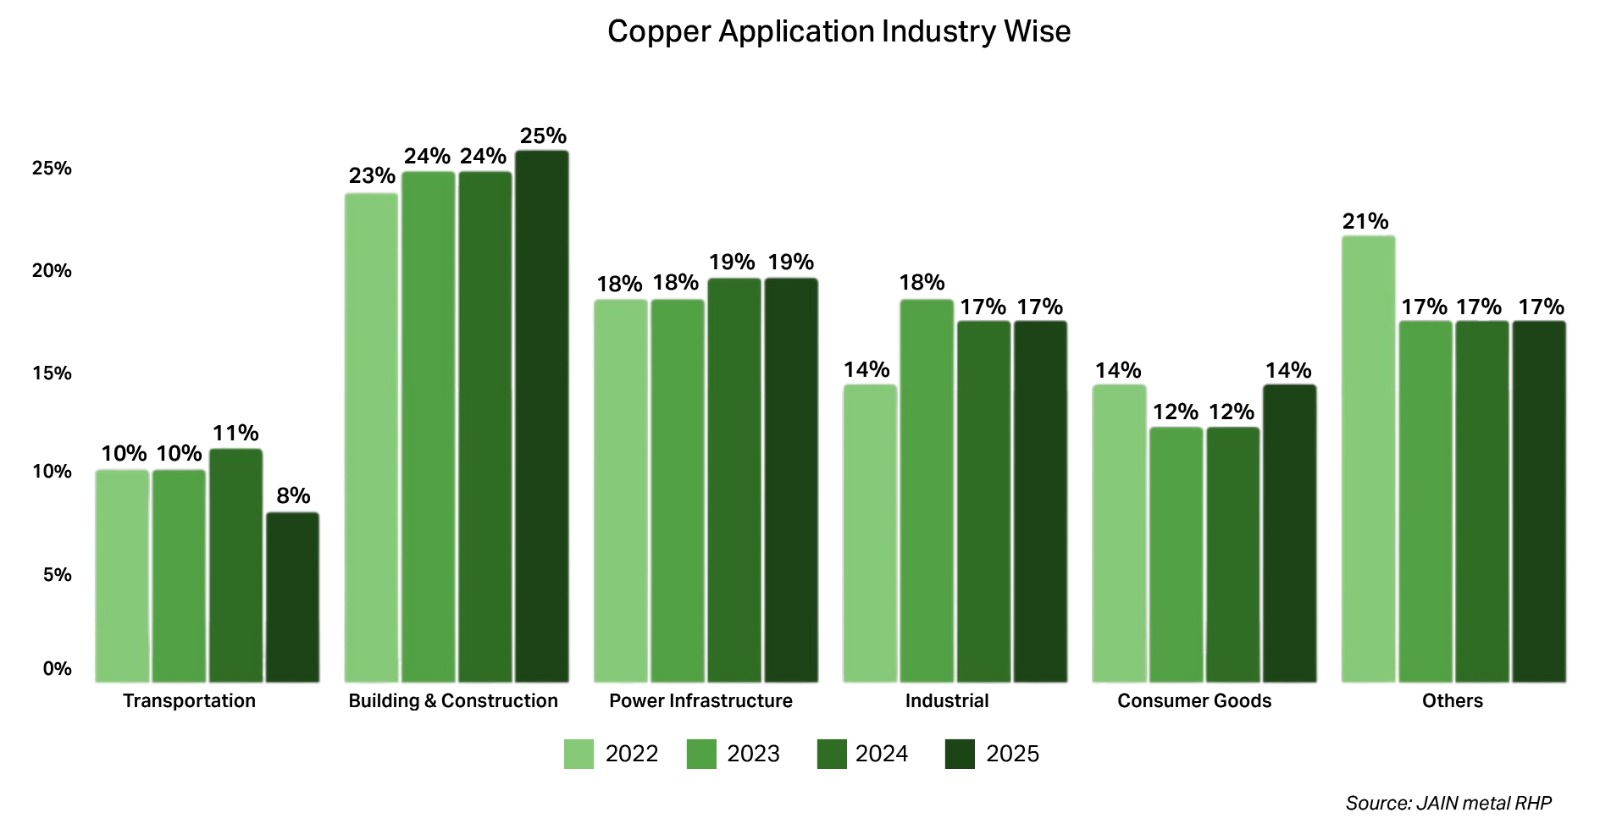
One simple way to see the headroom is through per-capita copper consumption. India is still at just ~0.5–0.6 kg per person, far below the global average of ~3.2 kg. History shows that copper demand tends to accelerate sharply during phases of industrial expansion. China saw this during its rapid buildout between 2000 and 2012, while the U.S. witnessed a similar surge in the post-World War II growth era.
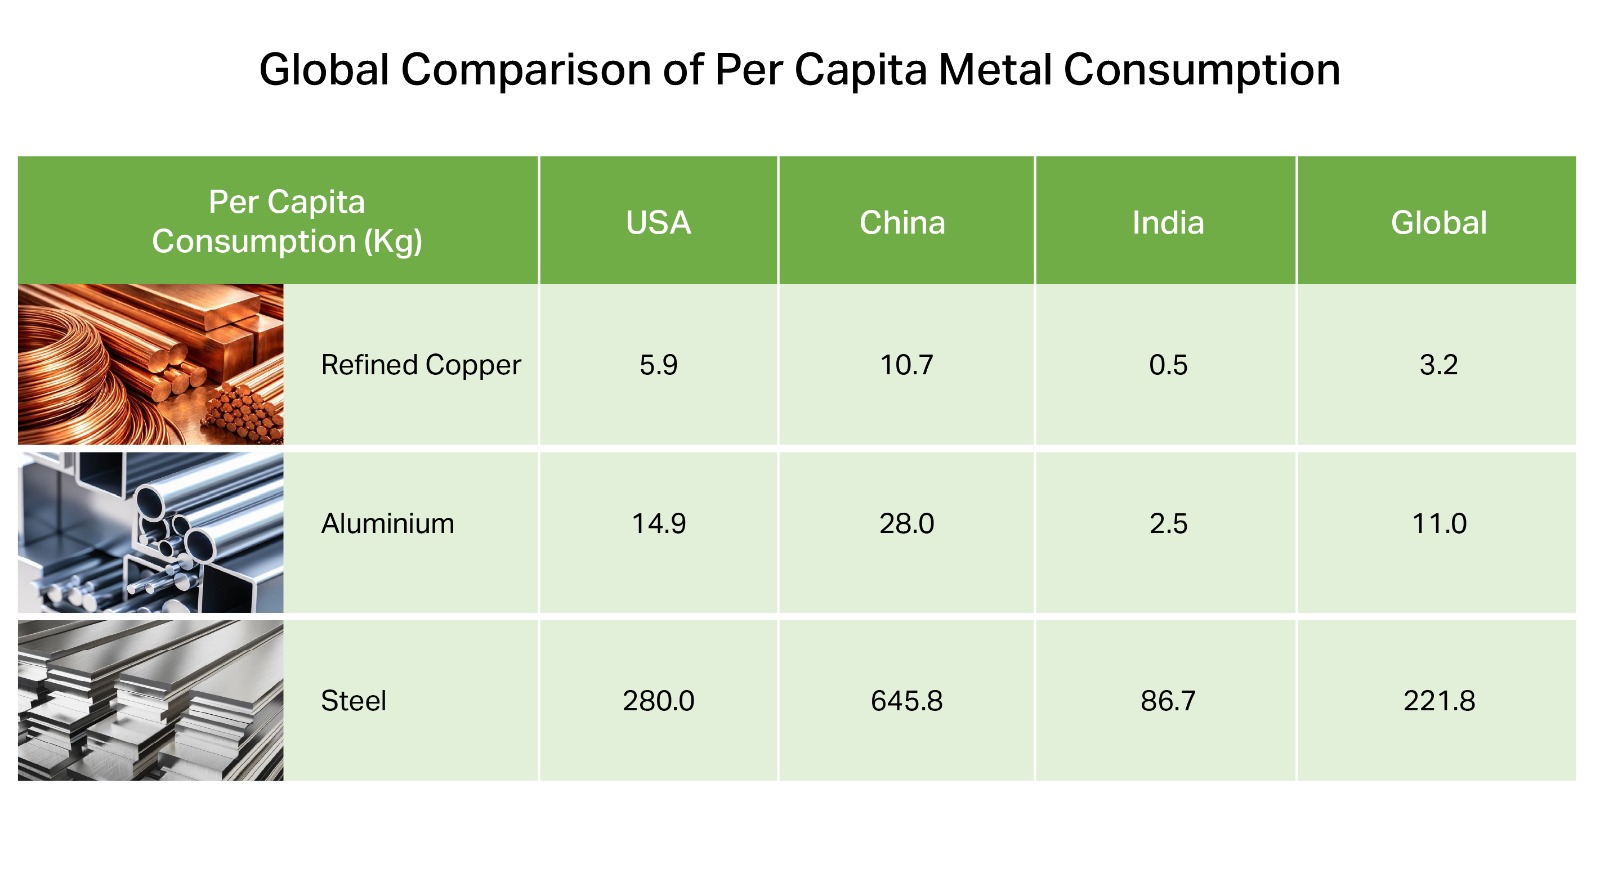
While demand is adding new use‑cases, the primary supply is constrained by geology and timelines. S&P Global estimates it can take ~16–17 years, on average, to bring a new copper mine from discovery to production. Add lower ore grades, permitting complexity, community pushback, and geopolitics supply response becomes sluggish.
Recent disruptions, mine shutdowns, project delays, and tighter concentrate availability have been enough to swing the market balance, a reminder that the copper supply chain is far less elastic than it appears. Global production edged up from 20.4 MT to 23 MT (a modest ~2.4% CAGR) between 2019 and 2024, while demand climbed faster from 23.4 MT to 25 MT, steadily widening the gap.
And the fragility is not theoretical. Chile, the world’s largest copper producer, has seen output volatility due to declining ore grades, water constraints, and operational setbacks at major mines. In Indonesia, regulatory shifts and export restrictions (Globally 7% share in concentrate copper) linked to smelting requirements have periodically tightened concentrate availability. Meanwhile, Canada evolving regulatory and environmental approval regime has lengthened project timelines, adding friction to new capacity additions.
These disruptions underline a structural truth: new copper supply is capital-intensive, politically sensitive, and slow to respond.
India mirrors this imbalance. Demand is projected to surge from ~3.3 million MT today to 8.9–9.8 million MT by 2047, while domestic supply is expected to rise from just 1.78 MT to only 6–7 MT. Even with aggressive mining expansion, the gap remains persistent.
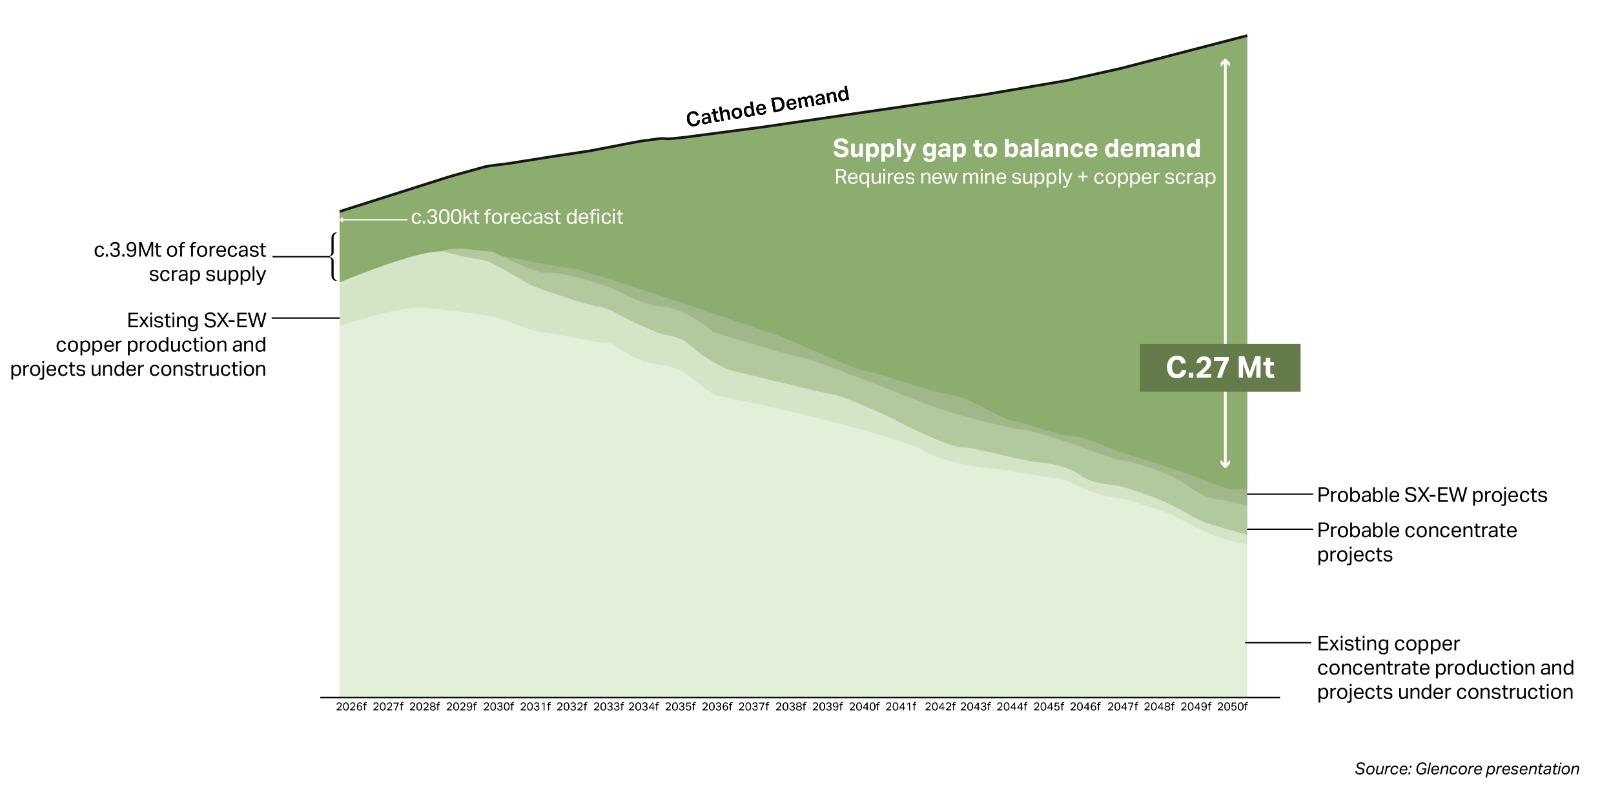
Copper is one of the few materials that can be recycled repeatedly without loss of performance. That makes it a rare circular winner. Every tonne of scrap that returns reduces the need to dig, crush, and process ore.
Industry estimates show why recycling is getting strategic attention. Premium copper scrap can retain up to ~95% of the value of primary metal, recycling copper can save up to ~85% of energy and reduce CO₂ emissions by around ~65% versus the primary route.
Where the value pools sit in the secondary chain:
A practical thumb rule: Every step you integrate forward improves control on purity, traceability, and customer stickiness, often where margins expand.
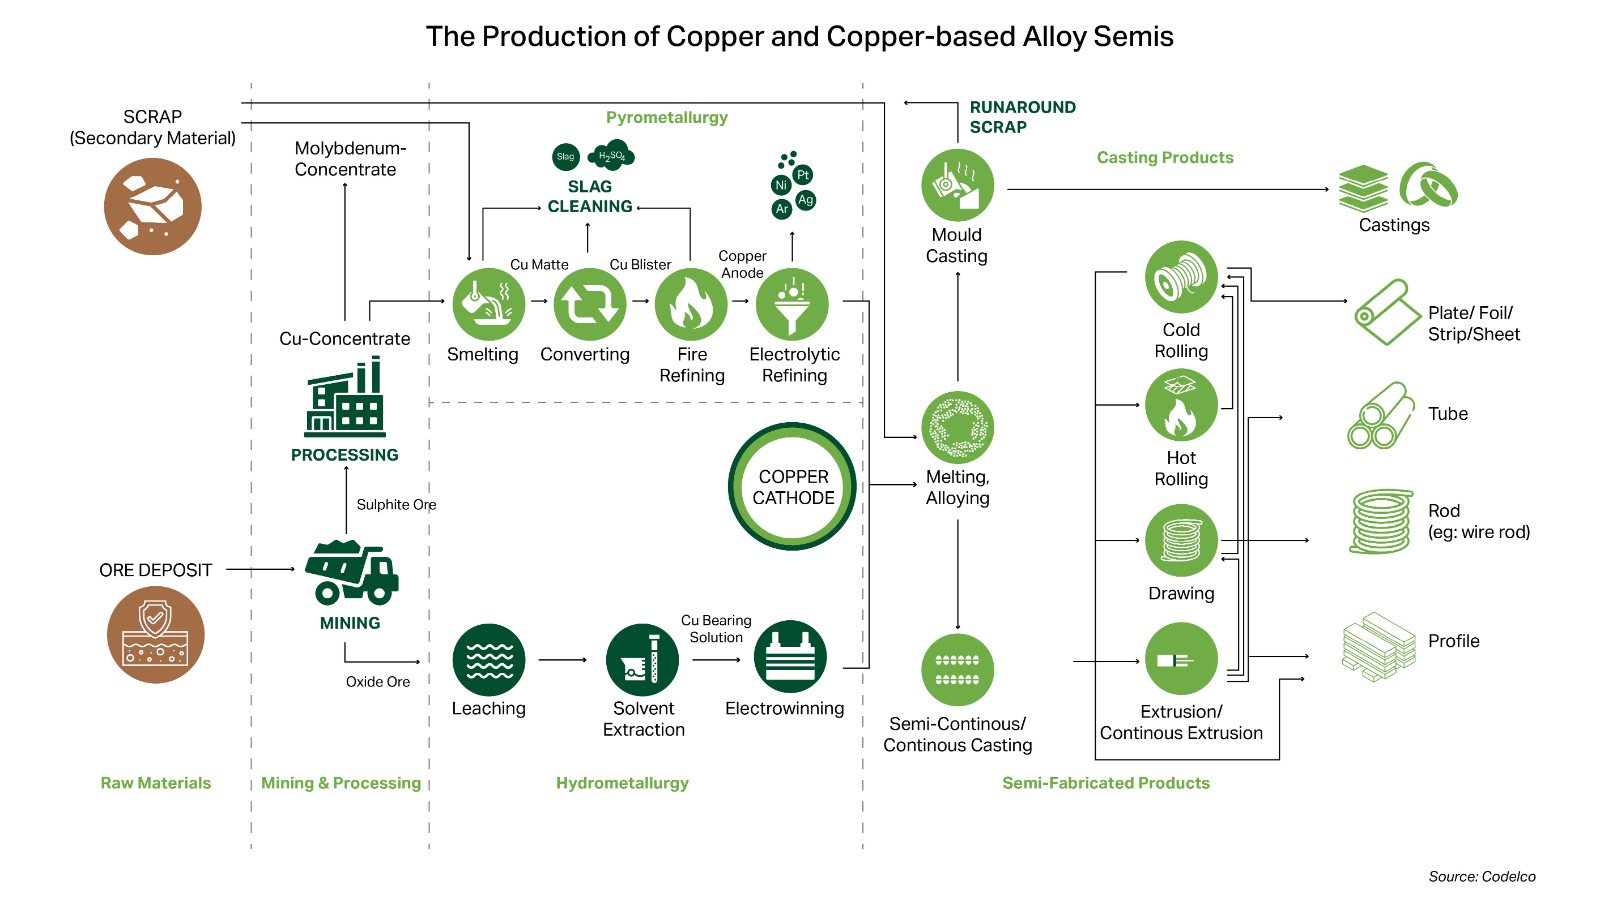
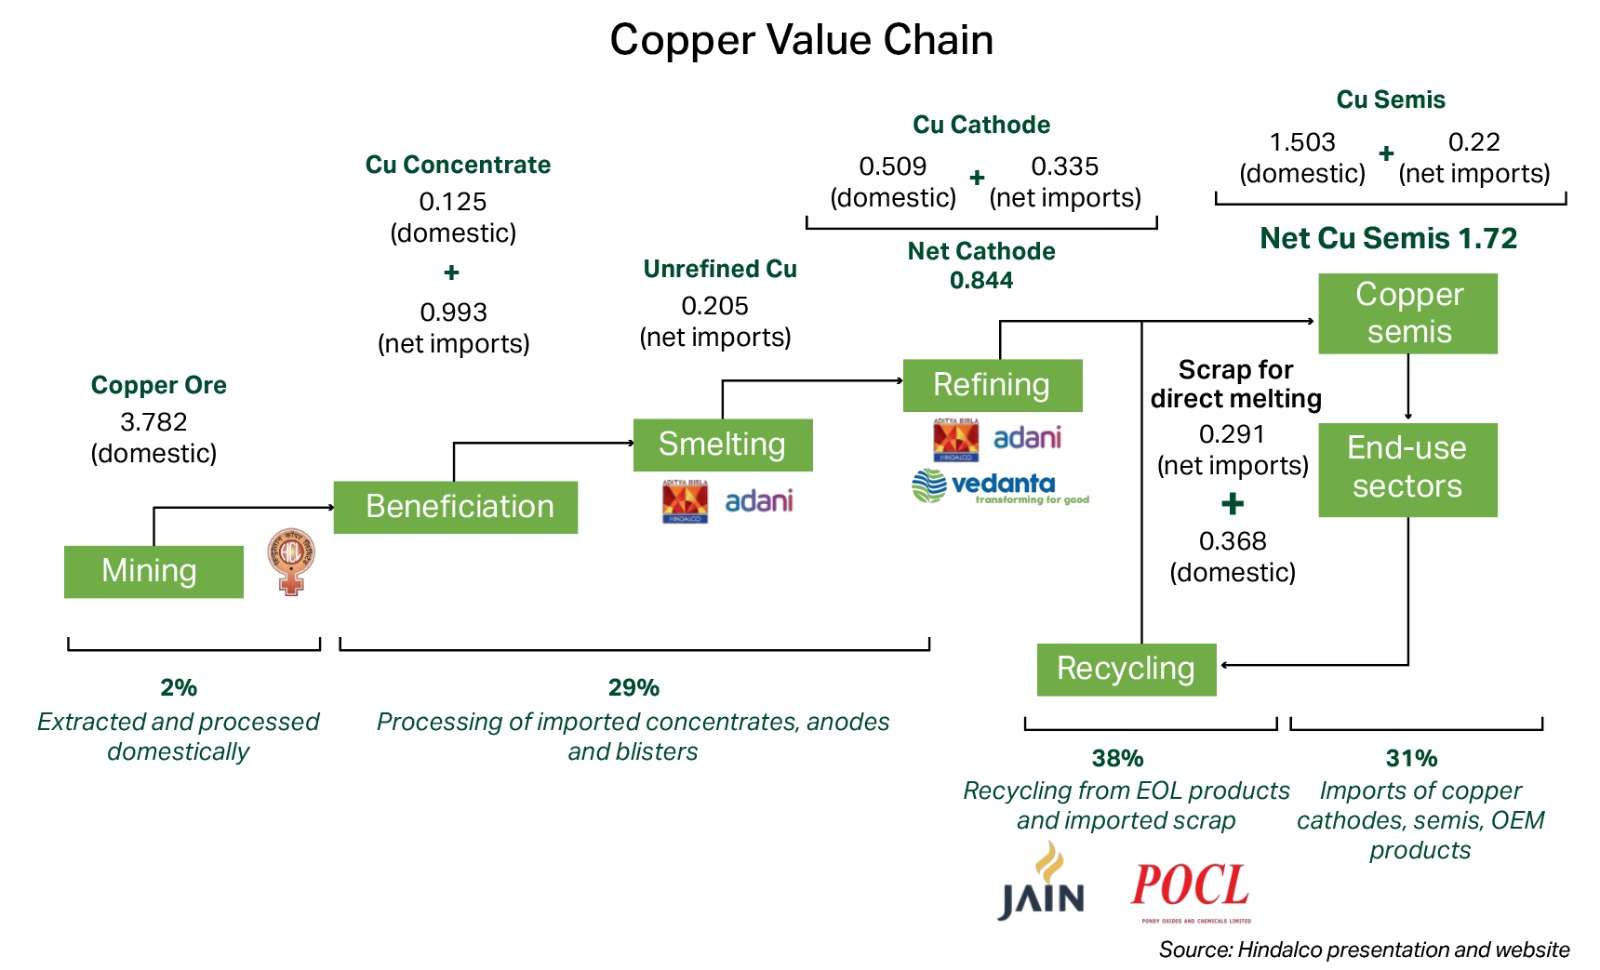
Seeing the big demand supply gap various India mining players are putting heavy capex. Even with mining players ramping up capex, the supply deficit is likely to persist, creating a strong runway for secondary copper.
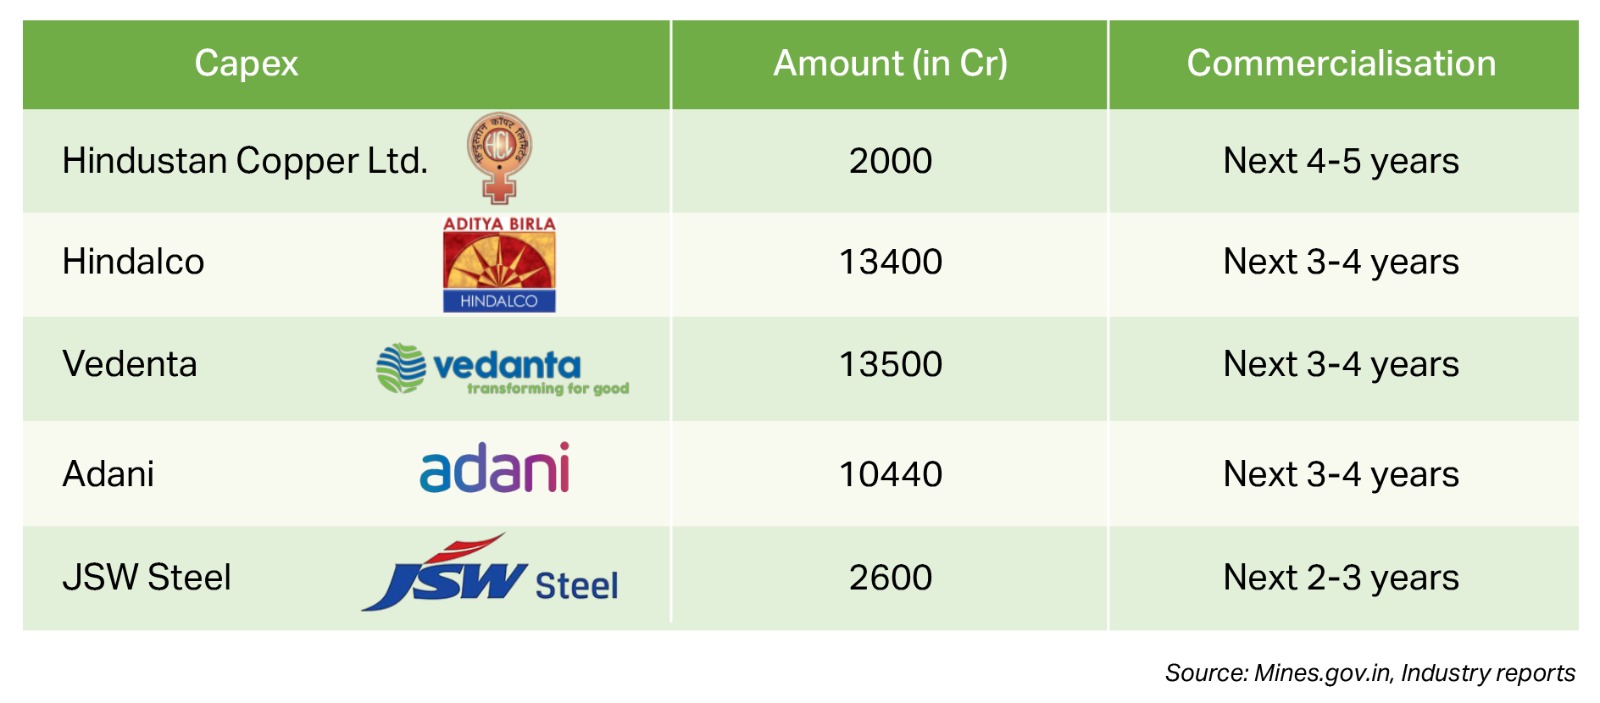
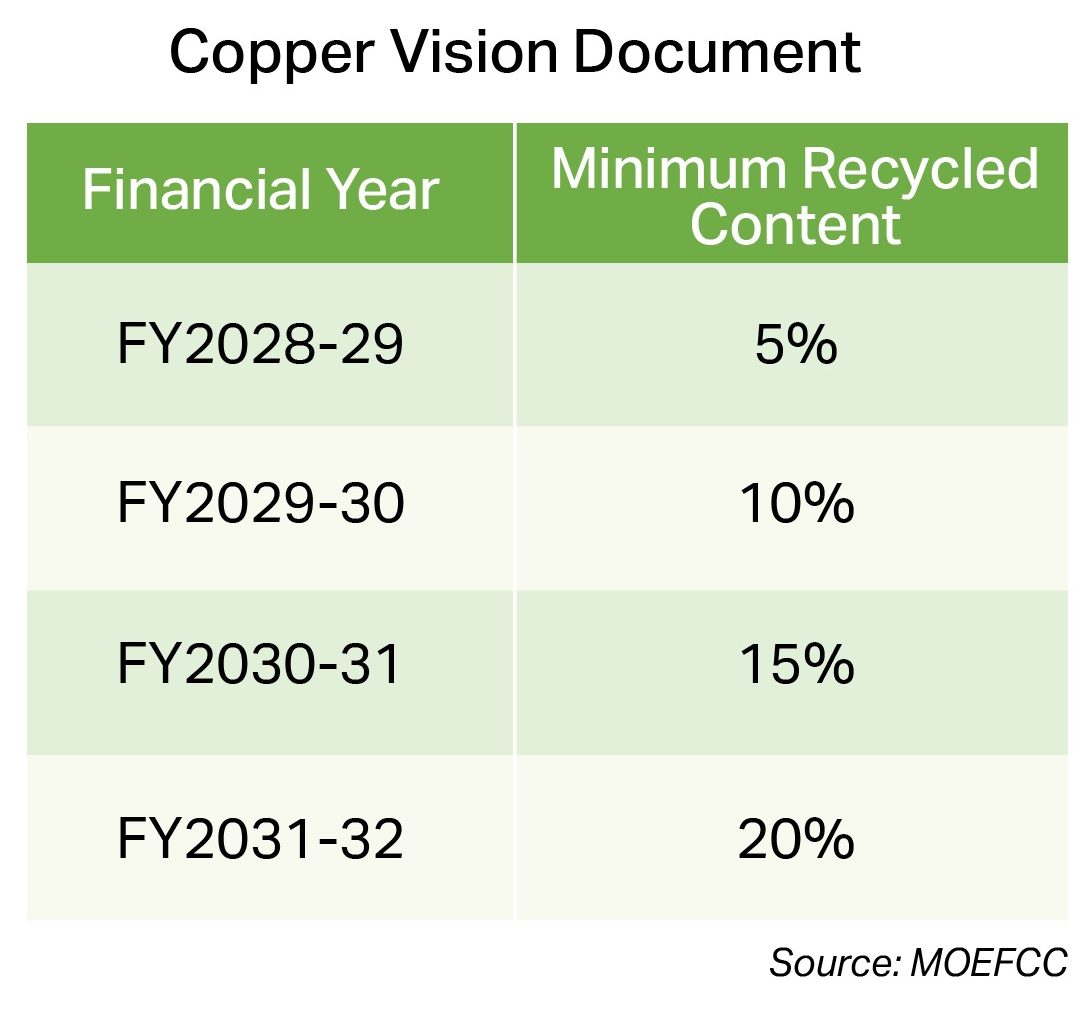
India’s copper story has a twist: Despite rising demand, the country has leaned more on imports in recent years, especially after the 2018 shutdown of Sterlite’s Tuticorin plant, an event that CSEP notes reduced cathode output sharply and worsened import dependence, currently it is 90% import.
Now, regulation is nudging the system toward circularity. Under the MoEFCC’s Non‑Ferrous Metal Scrap & Recycling framework, minimum recycled content requirements for copper products are slated to step up over time, reaching 20% by FY2031‑32, with intermediate milestones starting at 5% in FY2028‑29. India’s current effective recycling contribution is already estimated at 30% of supply, driven less by policy and more by necessity.
If copper is the new oil of electrification, recycling is the new refinery local, faster to scale, and far cleaner. Primary supply will still matter, but it can not be the only answer when timelines are measured in decades.
The winners won’t be the ones who simply buy scrap. They’ll be the ones who formalise collection, master sorting, guarantee purity, and climb the chain from cathodes to semis (rods, wires, busbars). Because even when prices cool, the shine of recycling doesn’t, it’s tied to physics, policy, and the world’s irreversible move toward electrons.
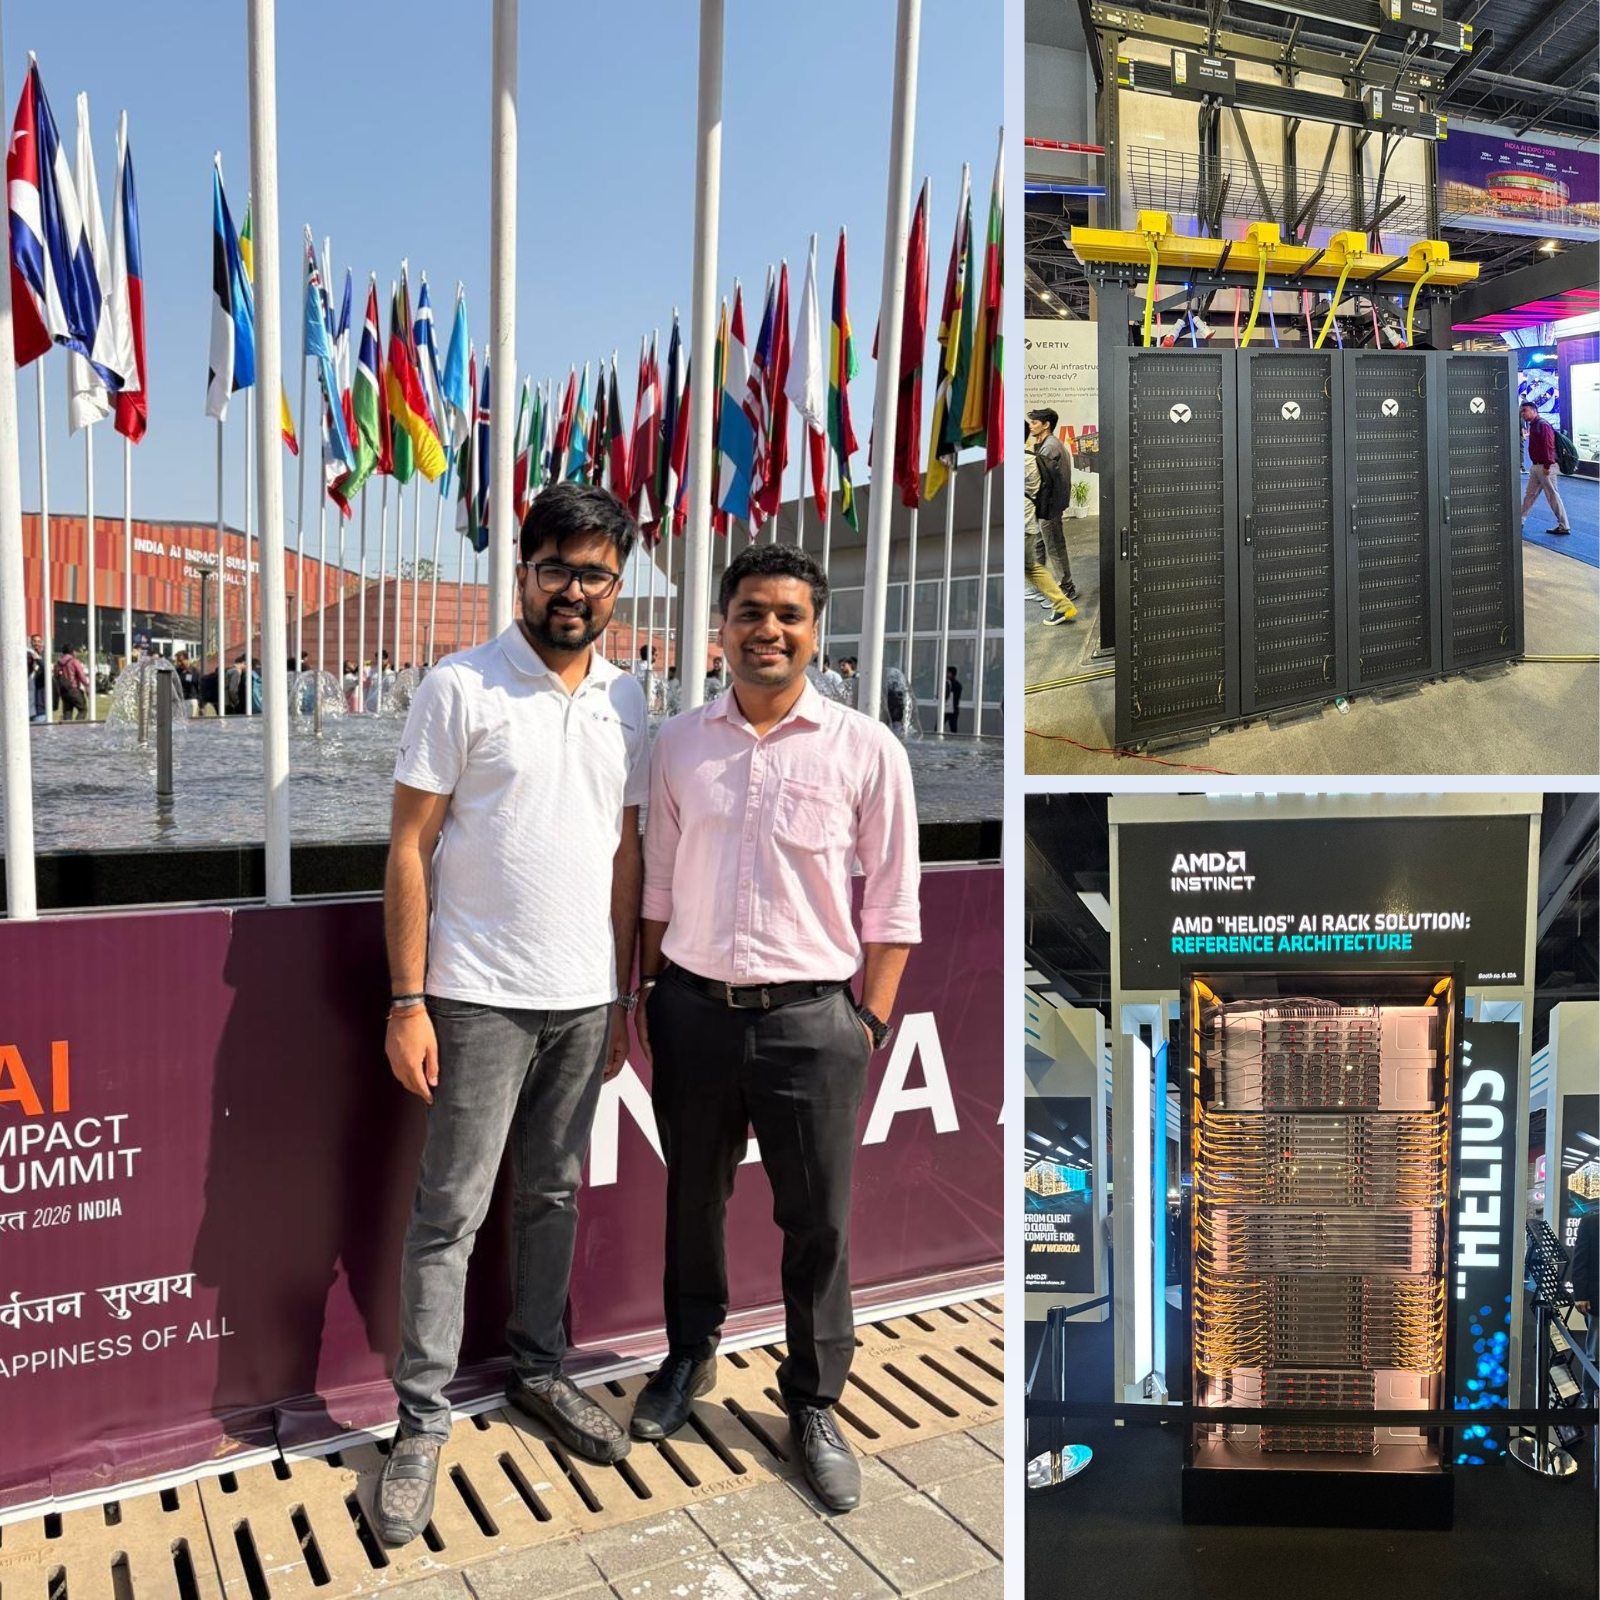
AI & Data Center
Niveshaay Take on India AI Impact Summit 2026
The India AI Summit in New Delhi marked a decisive shift in India’s technology narrative — from ambition to execution. Over five days, the event brought together global policymakers, founders, Big Tech leaders, and investors to formalise capital commitments, sovereign AI frameworks, and large-scale infrastructure plans. What emerged was clear: India is no longer positioning
The India AI Summit in New Delhi marked a decisive shift in India’s technology narrative — from ambition to execution. Over five days, the event brought together global policymakers, founders, Big Tech leaders, and investors to formalise capital commitments, sovereign AI frameworks, and large-scale infrastructure plans. What emerged was clear: India is no longer positioning itself as just a talent hub for global AI, but as a serious architect of compute, governance, and population-scale deployment.
• The first global AI summit in the Global South opened at Bharat Mandapam, 600+ startups, 300+ pavilions, 13 country delegations. PM Narendra Modi toured booths from Sarvam AI, HCLTech, and Jio.
• Big launch: India’s sovereign AI models arrived. BharatGen unveiled Param2 (17B parameters, 22 languages, MoE architecture). MahaGPT is already deployed with the Maharashtra government.
• Sarvam doubled down on vernacular AI with Sarvam Vision, Bulbul V3 and Sarvam Arya, signaling India’s AI future is voice-first, not English-first.
• Compute momentum is real. Yotta has deployed ~10,000 GPUs, with more expected alongside Nvidia.
• The sharp takes:
Vinod Khosla: IT/BPO may “almost disappear” in 5 years
HCL’s Vineet Nayar: AI won’t generate jobs
Info Edge’s Sanjeev Bikhchandani: Learn 10- 15 AI tools or fall behind
• Global players are leaning in: Anthropic opened its India office now its #2 market, AMD partnered with Tata Consultancy Services, and Qualcomm pitched hybrid AI deployment.
• The floor wasn’t theory, it was execution, precision farming, sign-language gloves, AI for special education, digital safety, and rural empowerment.
India’s AI thesis isn’t about building GPT-5. It’s about deploying AI at population scale across 22 languages, for problems global models never designed for.
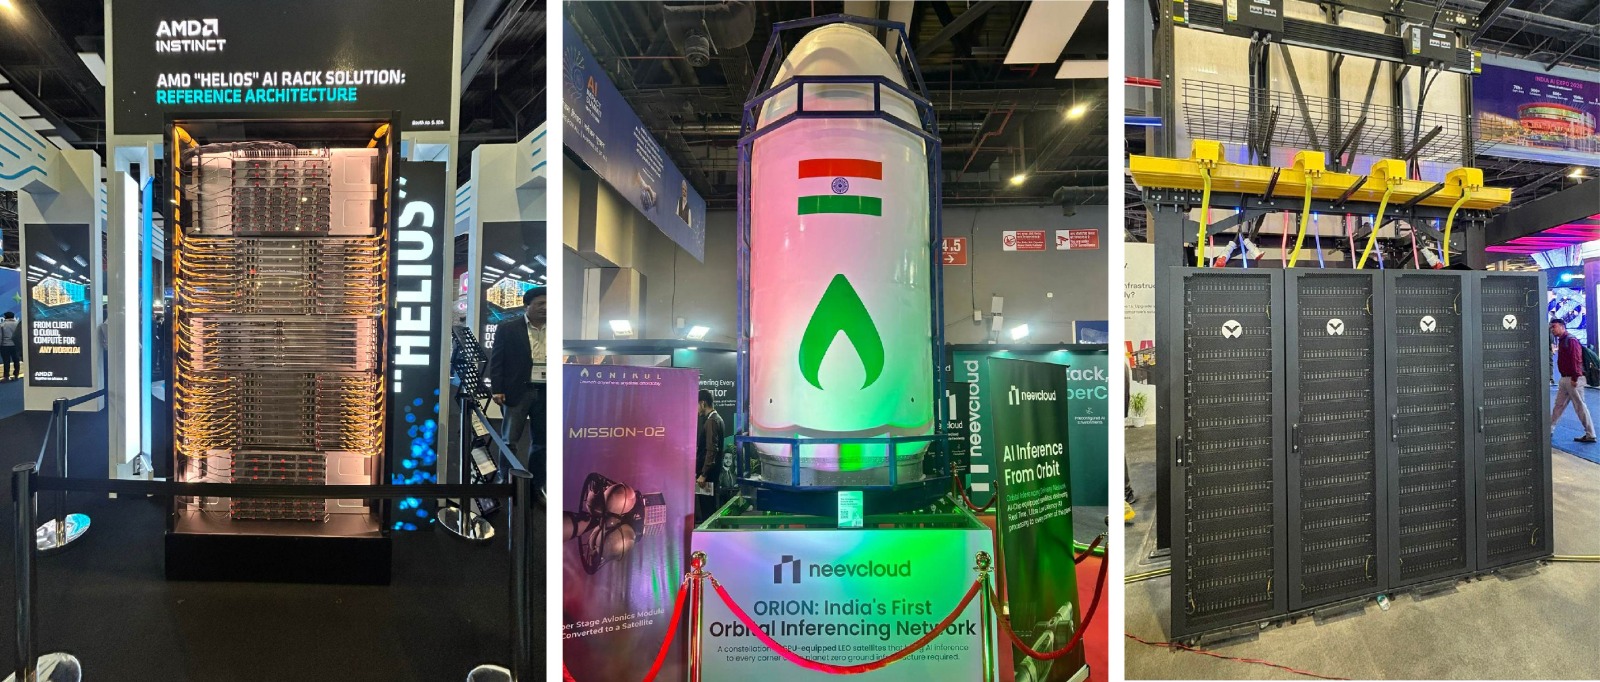
• IT Minister Ashwini Vaishnaw announced $200B in infra commitments and $17B in VC funding. 20,000+ GPUs being added to India’s 38,000 base. AI Mission 2.0 previewed. Clean energy at 51% of generation, a structural edge for AI infra.
• Adani Group committed $100B toward renewable-powered data centres by 2035 (Target: 5GW). Partnerships with Google and Microsoft already live. Spillover of $150B expected across server manufacturing and sovereign cloud.
• PM Narendra Modi wore Sarvam Kaze, Made-in-India smart glasses with real-time voice interaction in 10+ languages, fully on-device (Launch: May 2026). India’s consumer AI moment.
• Infosys × Anthropic is official. Claude-led enterprise deployments begin with telecom. Infosys disclosed AI revenue at 5.5% of total first public marker.
• Products that stood out:
Gnani.ai: Inya VoiceOS (5B params, direct audio processing)
Mastercard: India’s first agentic commerce transaction with Axis Bank, Swiggy, Razorpay
Cohere: TinyAya (70+ languages, offline-ready, trained on 64 H100s)
• The sharp takes:
Nandan Nilekani: Coding won’t remain the core tech job.
Sridhar Vembu: India is the most AI-enthusiastic population globally.
Defence Research and Development Organisation: Strategic AI independence is non-negotiable.
Day 2 wasn’t about demos. It was about money, scale, and geopolitical positioning.
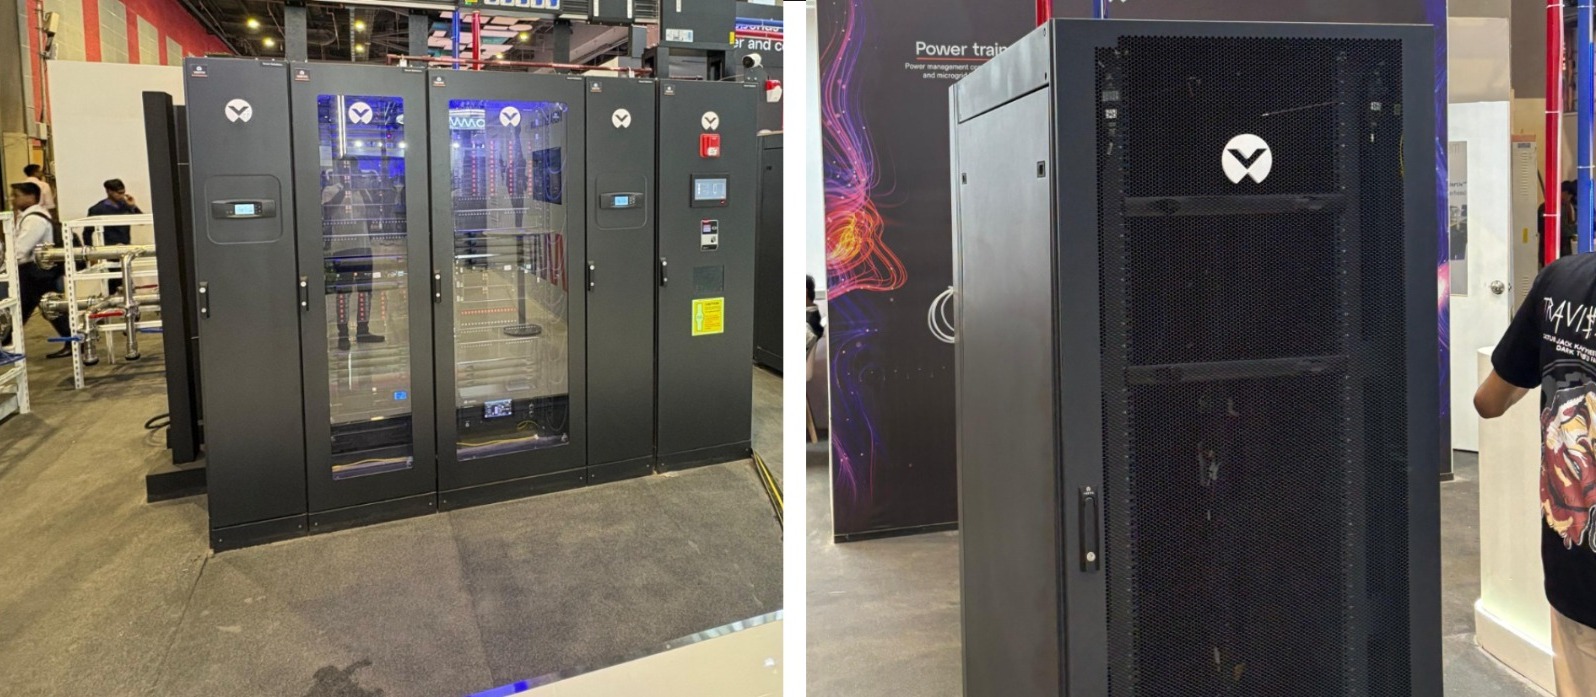
• Yotta × Nvidia: $2B commitment. 20,736 Blackwell Ultra GPUs by Aug ’26. Nvidia to host its own DGX Cloud region in India. That’s sovereign-scale compute.
• Sarvam AI open-sourced two models (30B & 105B) trained fully on Indian data. The standout demo: a ₹1,500 keypad phone running a Bhojpuri AI voice agent. Not a smartphone. A keypad device.
• Sundar Pichai announced a new US–India subsea cable and Google DeepMind open-sourcing models for Indian researchers. His line: “The next Google will be built in India.”
• Yann LeCun dropped in unannounced, spoke to founders. On open source: “Build on closed models and you’re renting intelligence from California.”
• Product momentum:
Ola launched Krutrim Pro (40% cheaper than GPT-4 for Indian languages).
Qure.ai showcased a handheld TB detection device (under 60 seconds).
Paytm turned its Soundbox into a Hindi-speaking AI assistant.
• Guinness World Record: 250,946 students pledged responsible AI use in 24 hours.

The biggest days just wrapped. If you track tech capital flows, the signal here was unusually clear: $200B+ in commitments is one thing, visible ground execution is another.
• The Jio Moment for AI: Mukesh Ambani committed $110B over 7 years — gigawatt-scale, green-powered data centres in Jamnagar. The stated ambition: drive down the “cost of intelligence.” That’s a structural challenge to global cloud economics.
• Hard Infra > Cloud Credits: Google is putting $15B into a full-stack AI hub in Visakhapatnam, including a new US–India subsea cable. Microsoft reaffirmed a $50B Global South commitment. This is physical capex- land, fibre, power, not just software scaling.
• Tata × OpenAI Anchor Play: Tata Consultancy Services is building a 100MW data centre (scaling to 1GW), with OpenAI as the first anchor customer. Rolling out ChatGPT Enterprise to hundreds of thousands of TCS employees makes India a serious node in OpenAI’s global infra map.
• Sovereign AI Doctrine: PM Narendra Modi outlined the MANAV framework. Core thesis: “Jiska data, uska adhikaar.” Data sovereignty is no longer philosophical — it’s regulatory and economic.
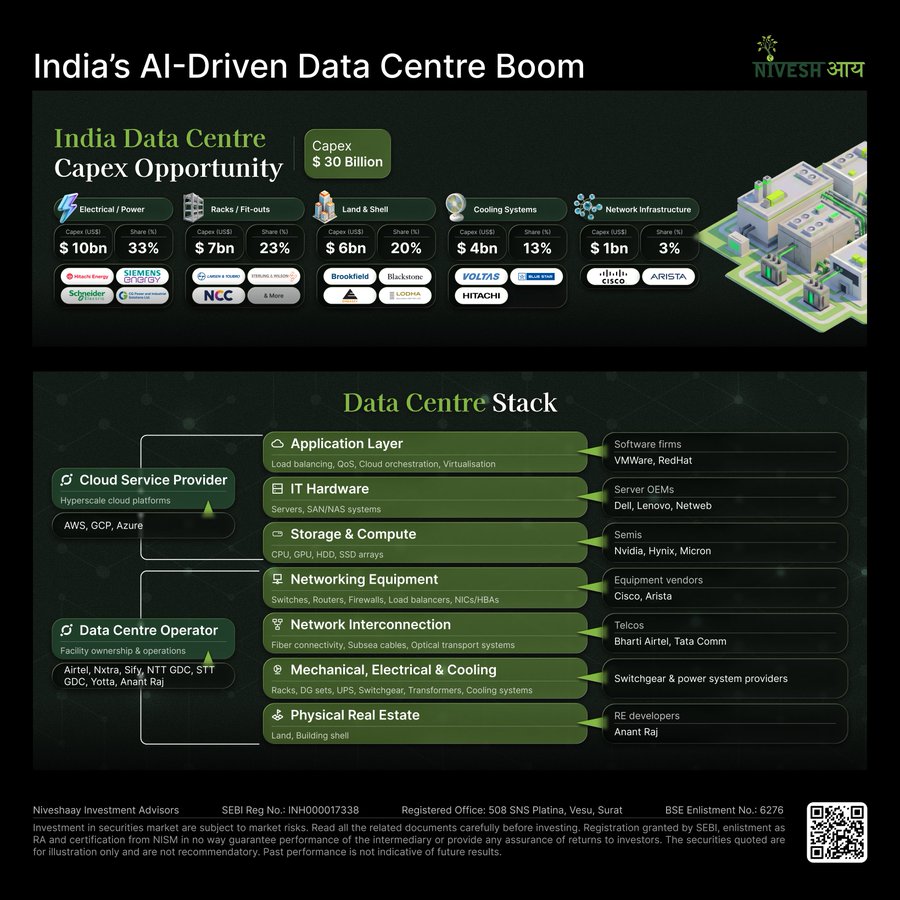
The final day wasn’t built for headlines. It was built for alignment global, regulatory, and capital.
• Delhi AI Declaration Adopted: 86 nations and global institutions endorsed the Responsible AI framework – formalising India’s governance-first positioning. The summit closed with structure, not slogans.
• $270B+ Investment Confidence: Cumulative global interest now exceeds $270B across AI infra, data centres, semiconductors, and compute capacity. The capital stack is no longer speculative – it’s directional.
• Governance, Not Hype: Discussions centred on safety, bias mitigation, accountability, and human-centric deployment. Regulatory maturity was the dominant theme.
• AI + Public Infrastructure: The focus moved beyond enterprise SaaS, toward healthcare, agriculture, skilling, and digital public infrastructure. AI as a population-scale utility.
• India as a Neutral Bridge: Under PM Narendra Modi, India positioned itself between US innovation velocity and EU-style regulatory structure, sovereign, but collaborative.
Across the summit, three structural shifts became clear:
1) Capital is committed at infra scale.
2) Governance architecture is being formalised.
3) India is transitioning from AI consumer to AI architect.
The announcements are done. The declarations are signed.
Now execution becomes the only metric that matters.
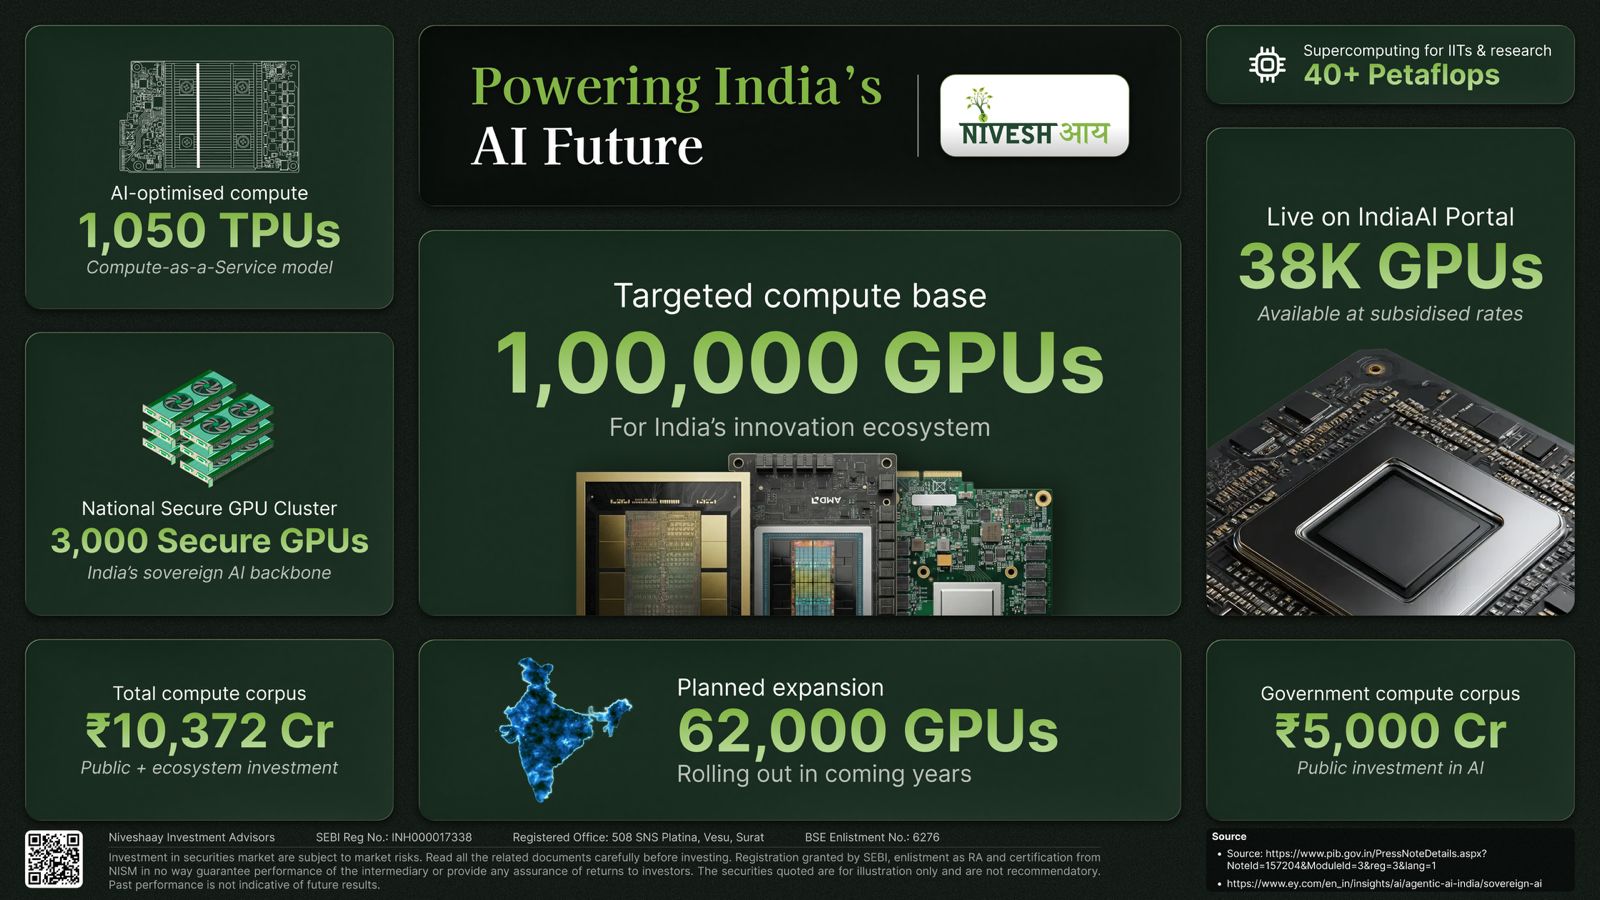
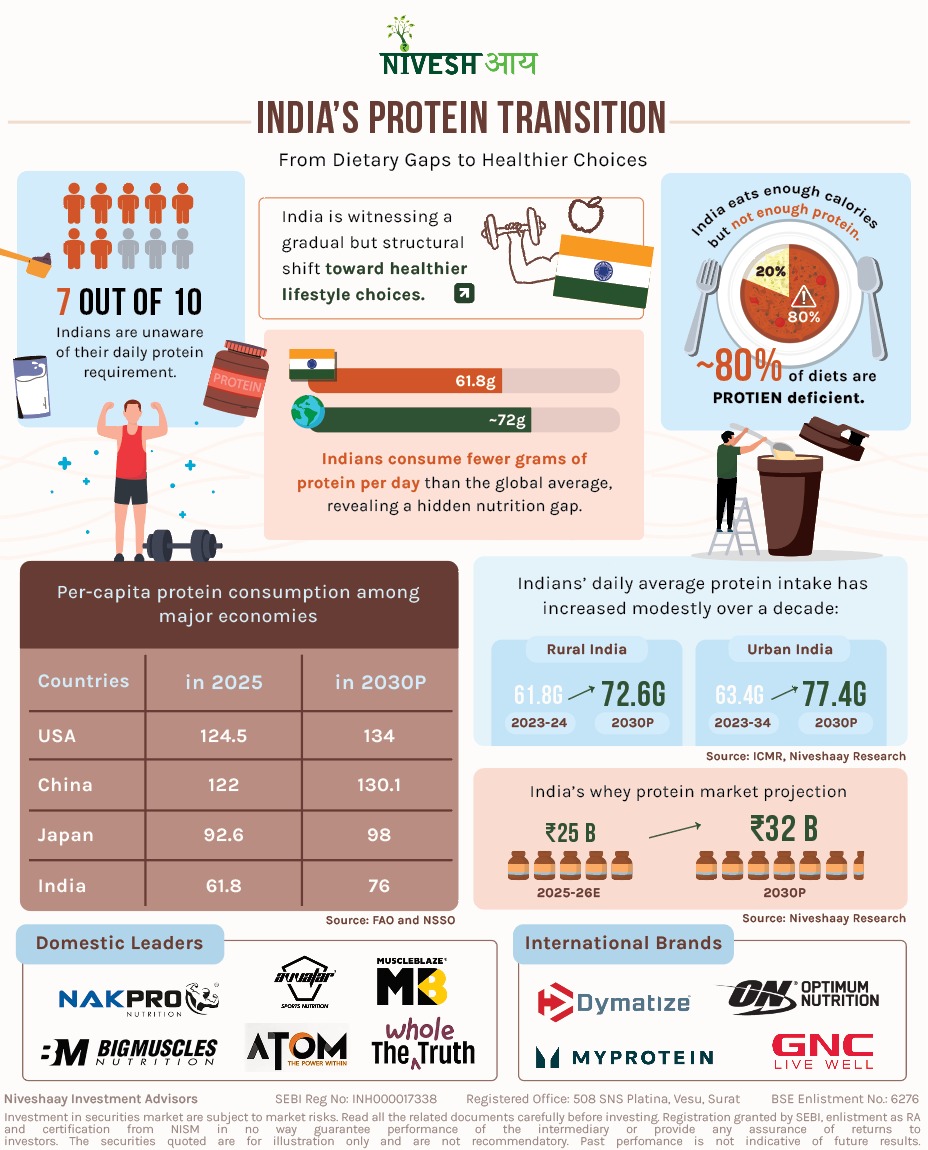
Electric Vehicle & Ancillaries
India’s Protein Transition
India’s nutrition narrative is shifting from calorie sufficiency to protein adequacy. Persistent protein gaps in carb-heavy diets continue to impact muscle efficiency, recovery cycles, and overall productivity — positioning quality protein as a structural health imperative rather than a lifestyle add-on. 🧬📈
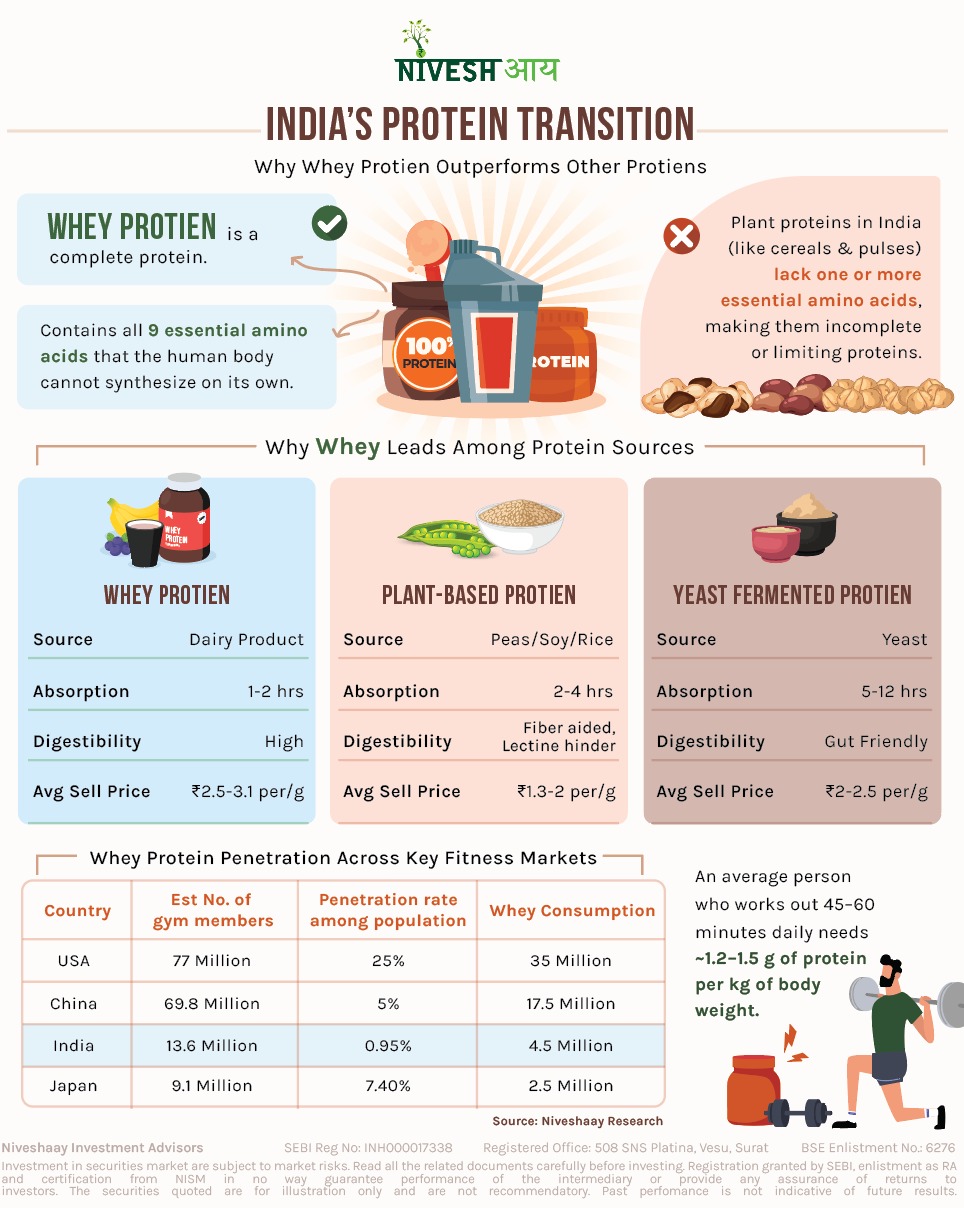

India’s nutrition narrative is shifting from calorie sufficiency to protein adequacy. Persistent protein gaps in carb-heavy diets continue to impact muscle efficiency, recovery cycles, and overall productivity, positioning quality protein as a structural health imperative rather than a lifestyle add-on. 🧬
The Indian Whey Protein Market, estimated at ~₹25 billion in 2025 and projected to reach ~₹32 billion by 2030, underscores this transition. For investors, it represents a structurally emerging category, driven by health formalisation, dietary premiumisation, and rising willingness to pay for performance-linked nutrition. 💰📊
With its complete amino acid profile and rapid absorption, whey holds a clear functional edge. What was once a niche fitness supplement is steadily evolving into a mainstream nutrition category. 🚀

Consumer Durables, Services & Consumption
The Invisible Crisis – Decoding the Protein Paradox
The Indian kitchen is often celebrated for its vegetarian balance, yet a silent nutritional crisis is brewing. A staggering 80% of Indian diets are protein-deficient. This isn't merely a matter of food availability; it is driven by what experts call the "Protein Paradox."

The Indian kitchen is often celebrated for its vegetarian balance, yet a silent nutritional crisis is brewing. A staggering 80% of Indian diets are protein-deficient. This isn’t merely a matter of food availability; it is driven by what experts call the “Protein Paradox.”
Data reveals that while 95% of Indian mothers recognize protein is important, only 3% can correctly identify its actual functions, such as building immunity or repairing tissue. Most families rely on a “staple myth,” incorrectly believing that a regular diet of roti, dal, and rice provides sufficient protein. In reality, cereals currently supply nearly 50% of the average Indian’s protein, despite their low-quality amino acid profile and poor digestibility.
As we look toward the Indian Whey Protein Market, it is estimated to be around ₹25 Billion in 2025 and till 2030 it will reach ₹32 Billion due to rising fitness culture, urbanization, increasing awareness and Digital distribution transformation, and India’s transition from staple-heavy to protein-first is becoming a public health necessity which will give a big push.
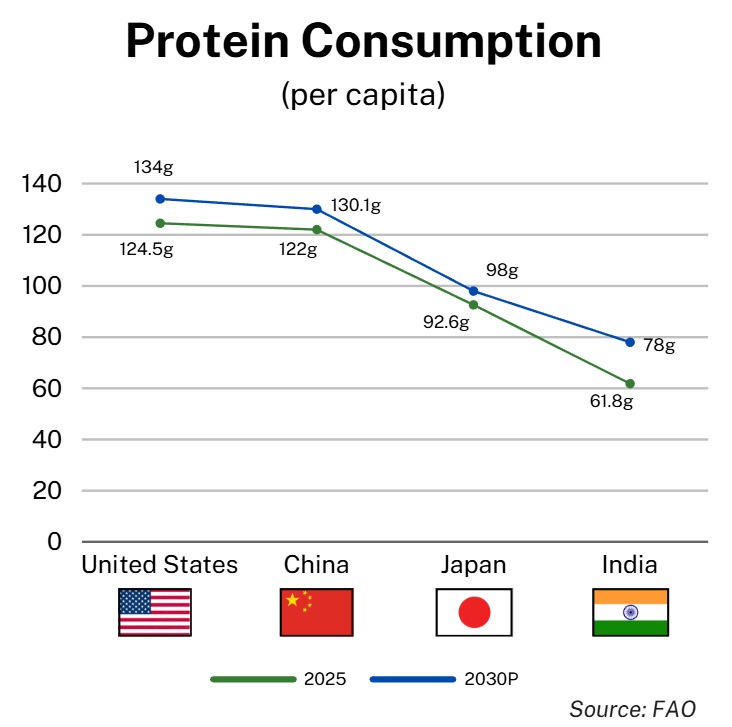
So, India’s per capita protein consumption stands at around 61.8 grams per day, significantly under the global average of approximately 77-78 grams per day. Surveys indicate 73% of Indians experience protein deficiency, driven by cereal-heavy diets contributing 60% of protein but low quality and limited animal protein access, especially among vegetarian.
The Protein Pinch and the Cereal Trap
A major factor contributing to this imbalance is an over-reliance on low-quality protein sources:
Why Whey is the Superior Solution
Whey protein is uniquely positioned to address these gaps due to its high efficiency and complete profile:
The Science of Purity – Why the Source Matters
Whey, once a discarded byproduct of cheese-making, is now the gold standard of nutrition because it is a “complete protein”. The industry categorizes whey based on how much extra fat and lactose is filtered out:
The Contenders – Plant-Based vs the “New Boy” (Yeast)
The modern consumer is increasingly looking for dairy-free alternatives, but the report highlights significant trade-offs:
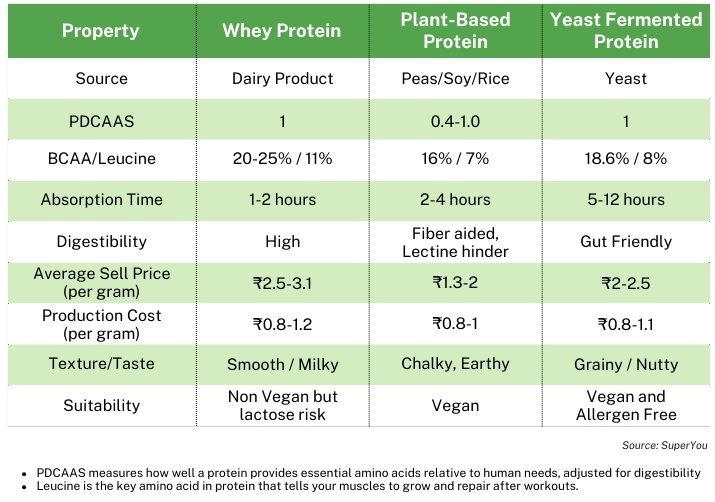
Market Snapshot: Leaders in India
As awareness grows, several key players are establishing themselves in the Indian market:
Breaking the Protein Pinch – Economic Barriers
The most significant hurdle to adoption in India is the “Protein Pinch”
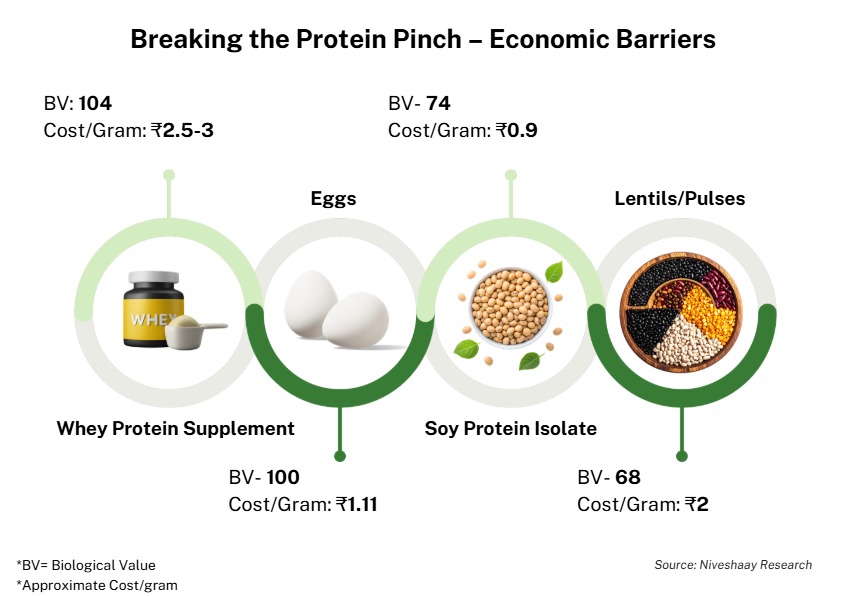
The Future – The GLP-1 Wave & Market Leadership
GLP-1 Drug has been nothing short of a medical revolution in the United States. What started as a niche diabetes treatment has exploded into a multi-billion dollar weight management phenomenon.

The most unexpected growth driver for whey protein is the rise of weight-loss drugs like GLP-1 agonists.
The Perfect Fitness Stack
The modern Indian consumer is no longer just looking for gym fuel—they are looking for functional snacks that fit into a busy, urban lifestyle.
Why Parag Stands Alone in the Domestic Whey Market
Parag Milk Foods has solidified its position as the domestic manufacturer in India’s sports nutrition market that produces whey protein directly from its own cheese-making process with Amul

Conclusion
India’s protein challenge is no longer about availability it is about awareness, absorption, and accessibility. As dietary habits evolve, protein is shifting from a fitness accessory to a daily nutritional essential. Whey protein, with its superior bioavailability and complete amino acid profile, is emerging as a practical solution to bridge chronic dietary gaps. The rise of active nutrition formats like bars, RTDs, and functional snacks is making protein intake effortless and routine. Medical trends such as GLP-1 therapies are further reinforcing protein’s role in muscle and metabolic health.
At the same time, consumers are demanding greater trust, traceability, and purity from brands. This convergence of science, convenience, and credibility signals a decisive move toward a protein-first future.
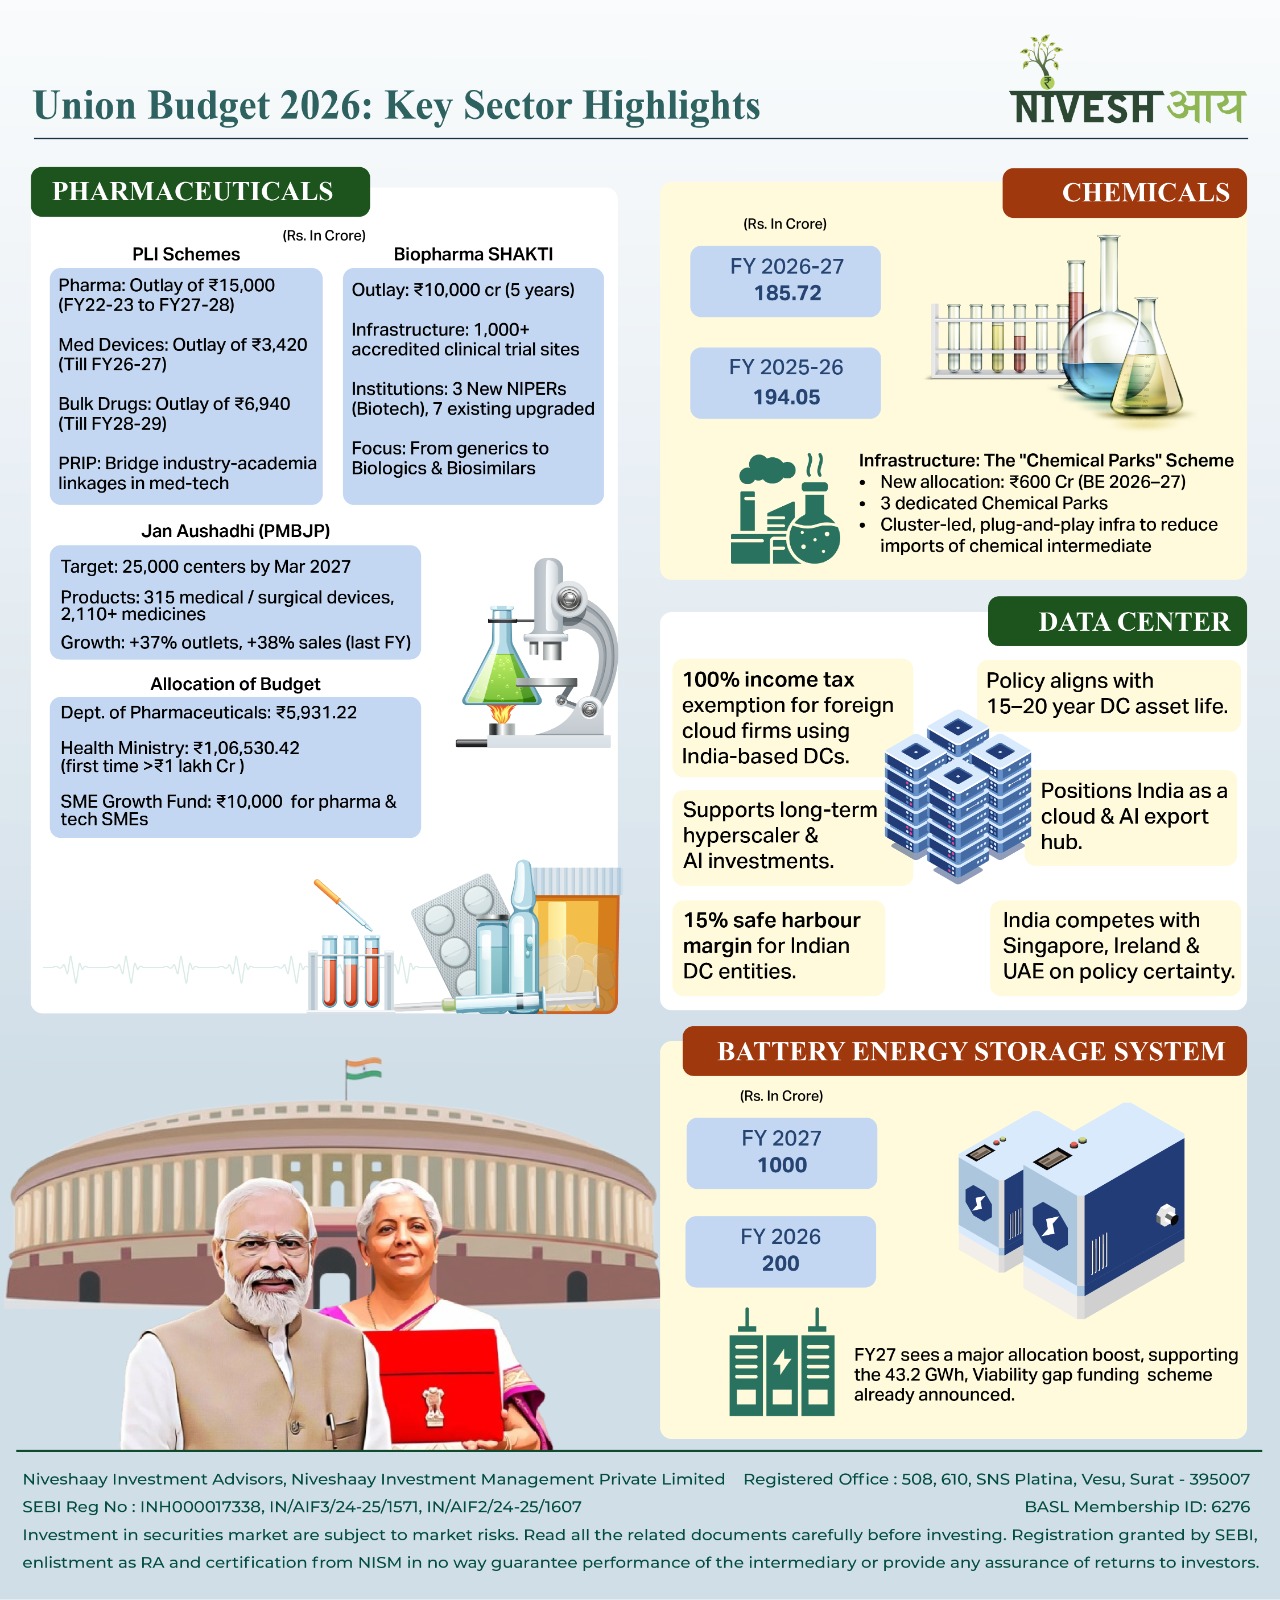
AI & Data Center
Union Budget 2026: Key Sector Highlights
Union Budget 2026 isn’t about headline announcements, it’s about where capital is being committed. The allocation choices signal a clear shift toward execution, scale, and long-term capacity building.📊
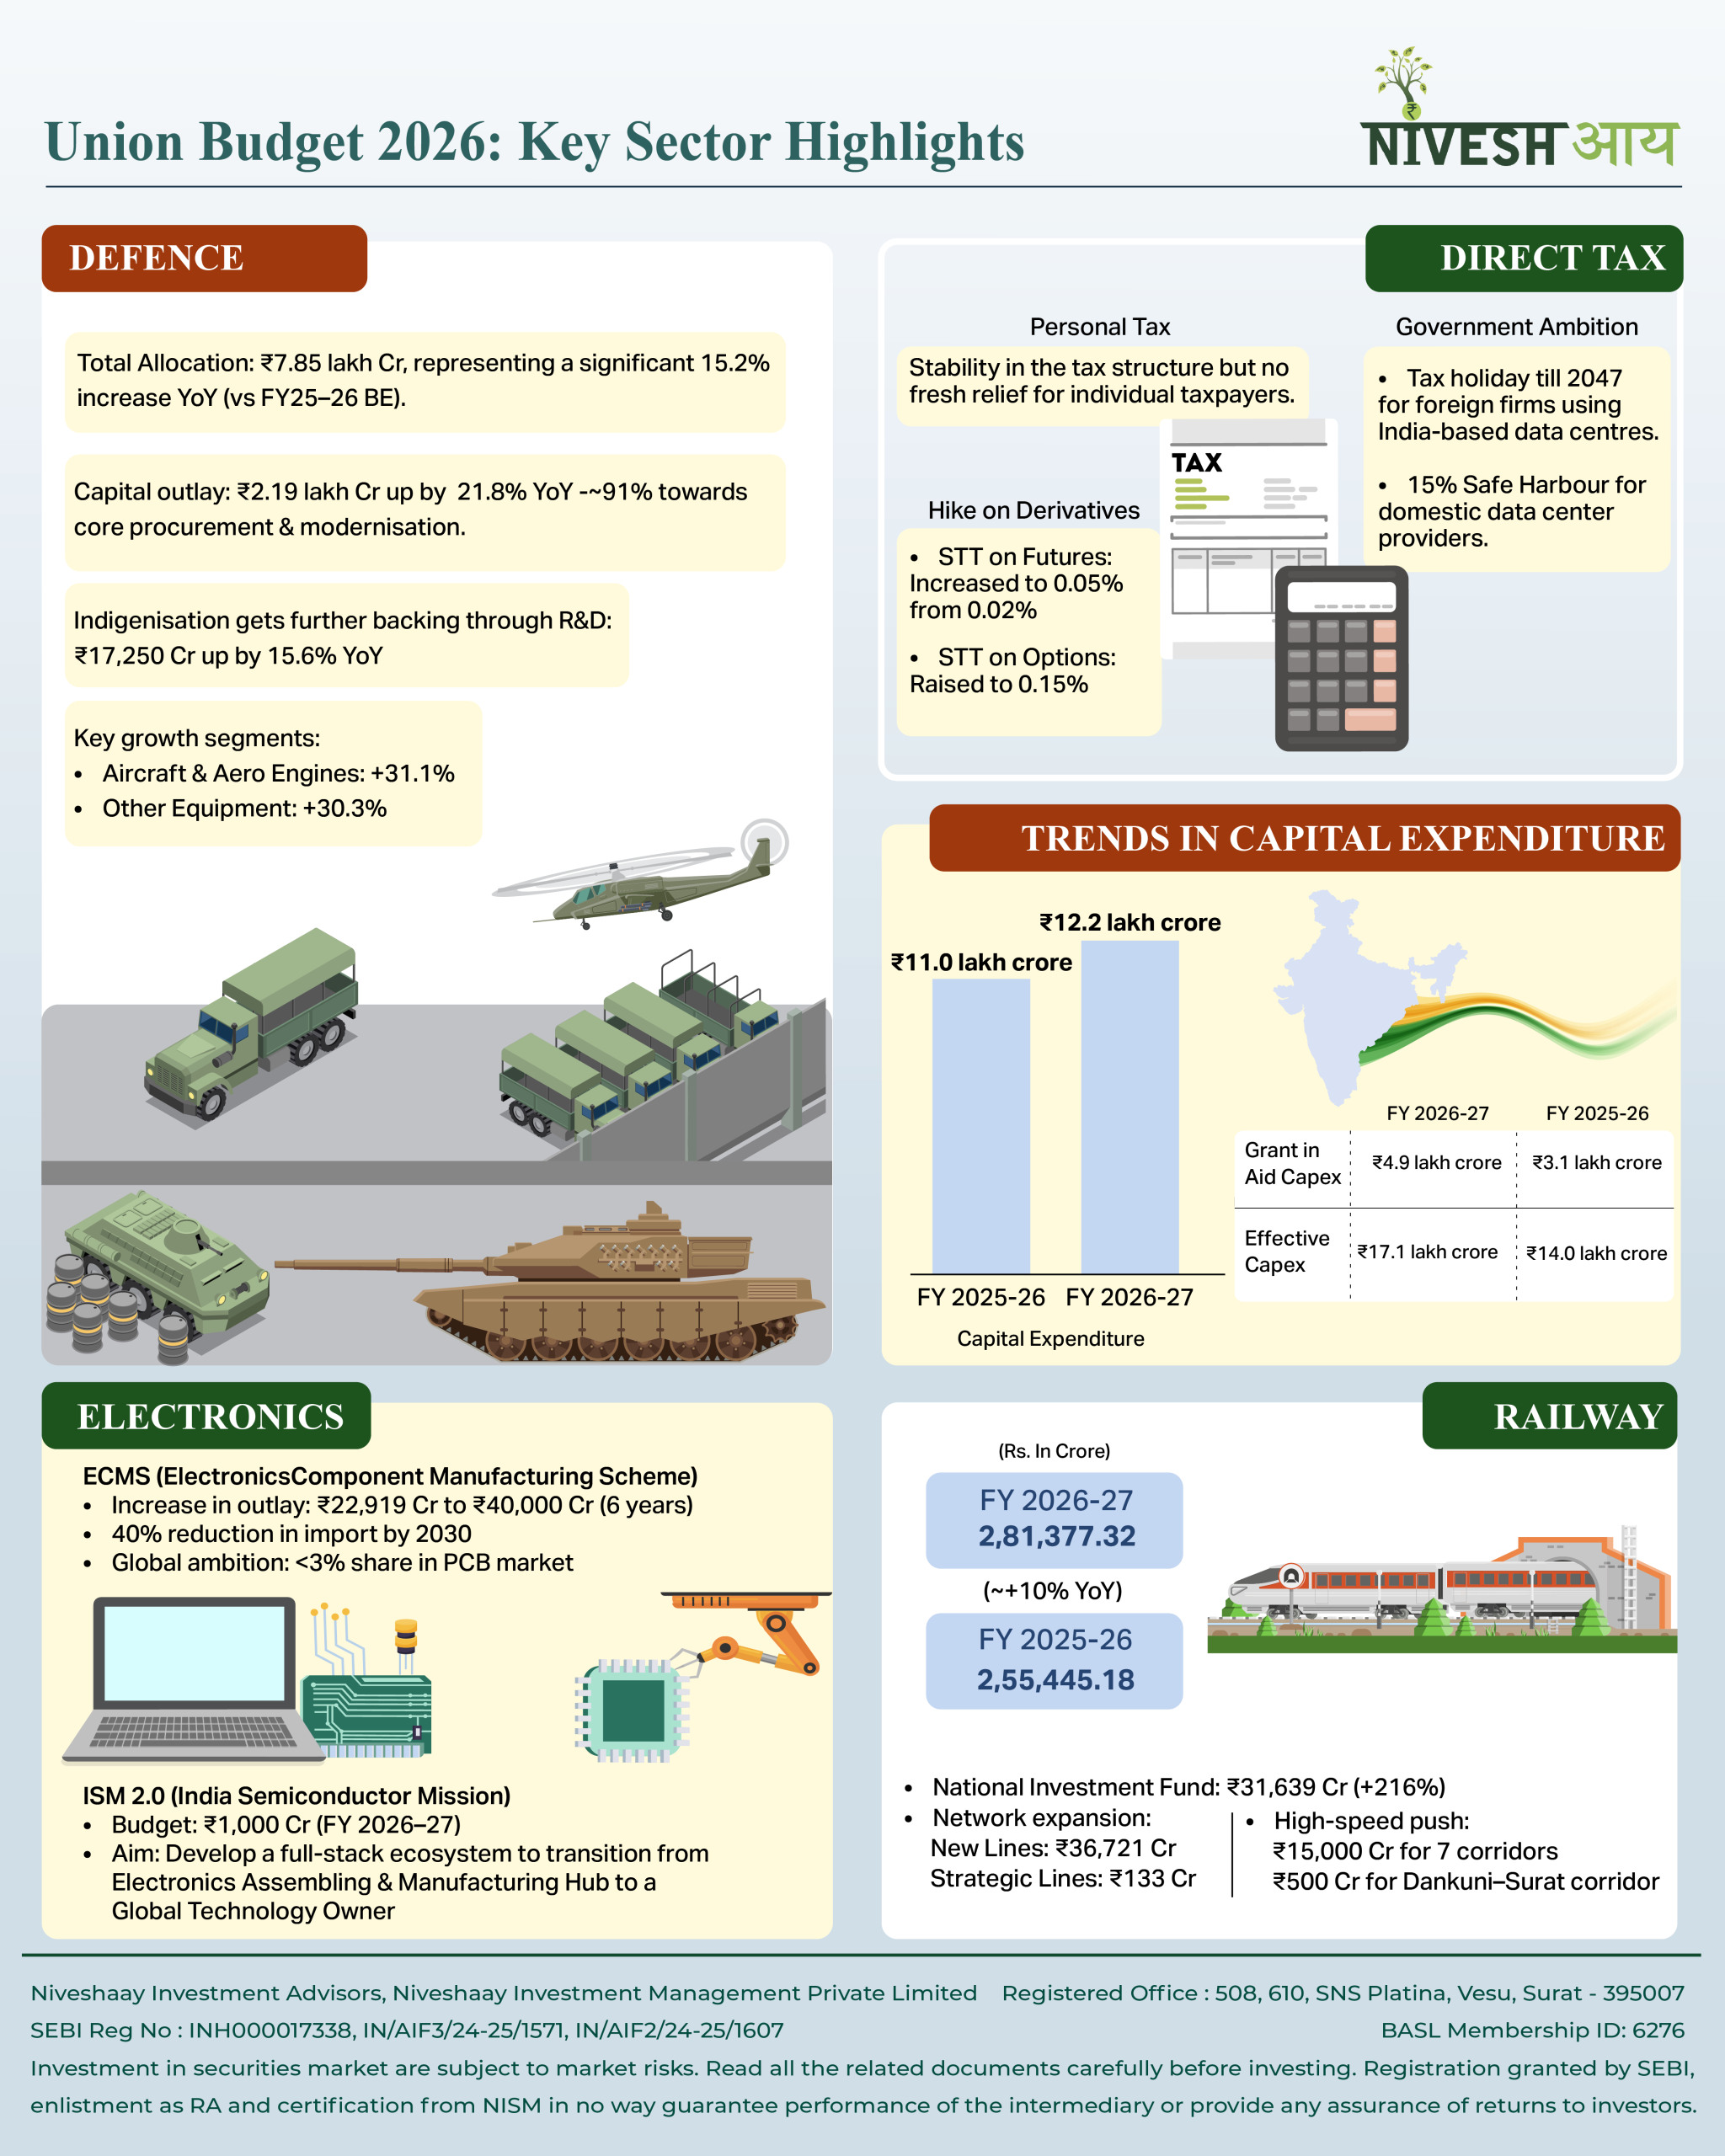
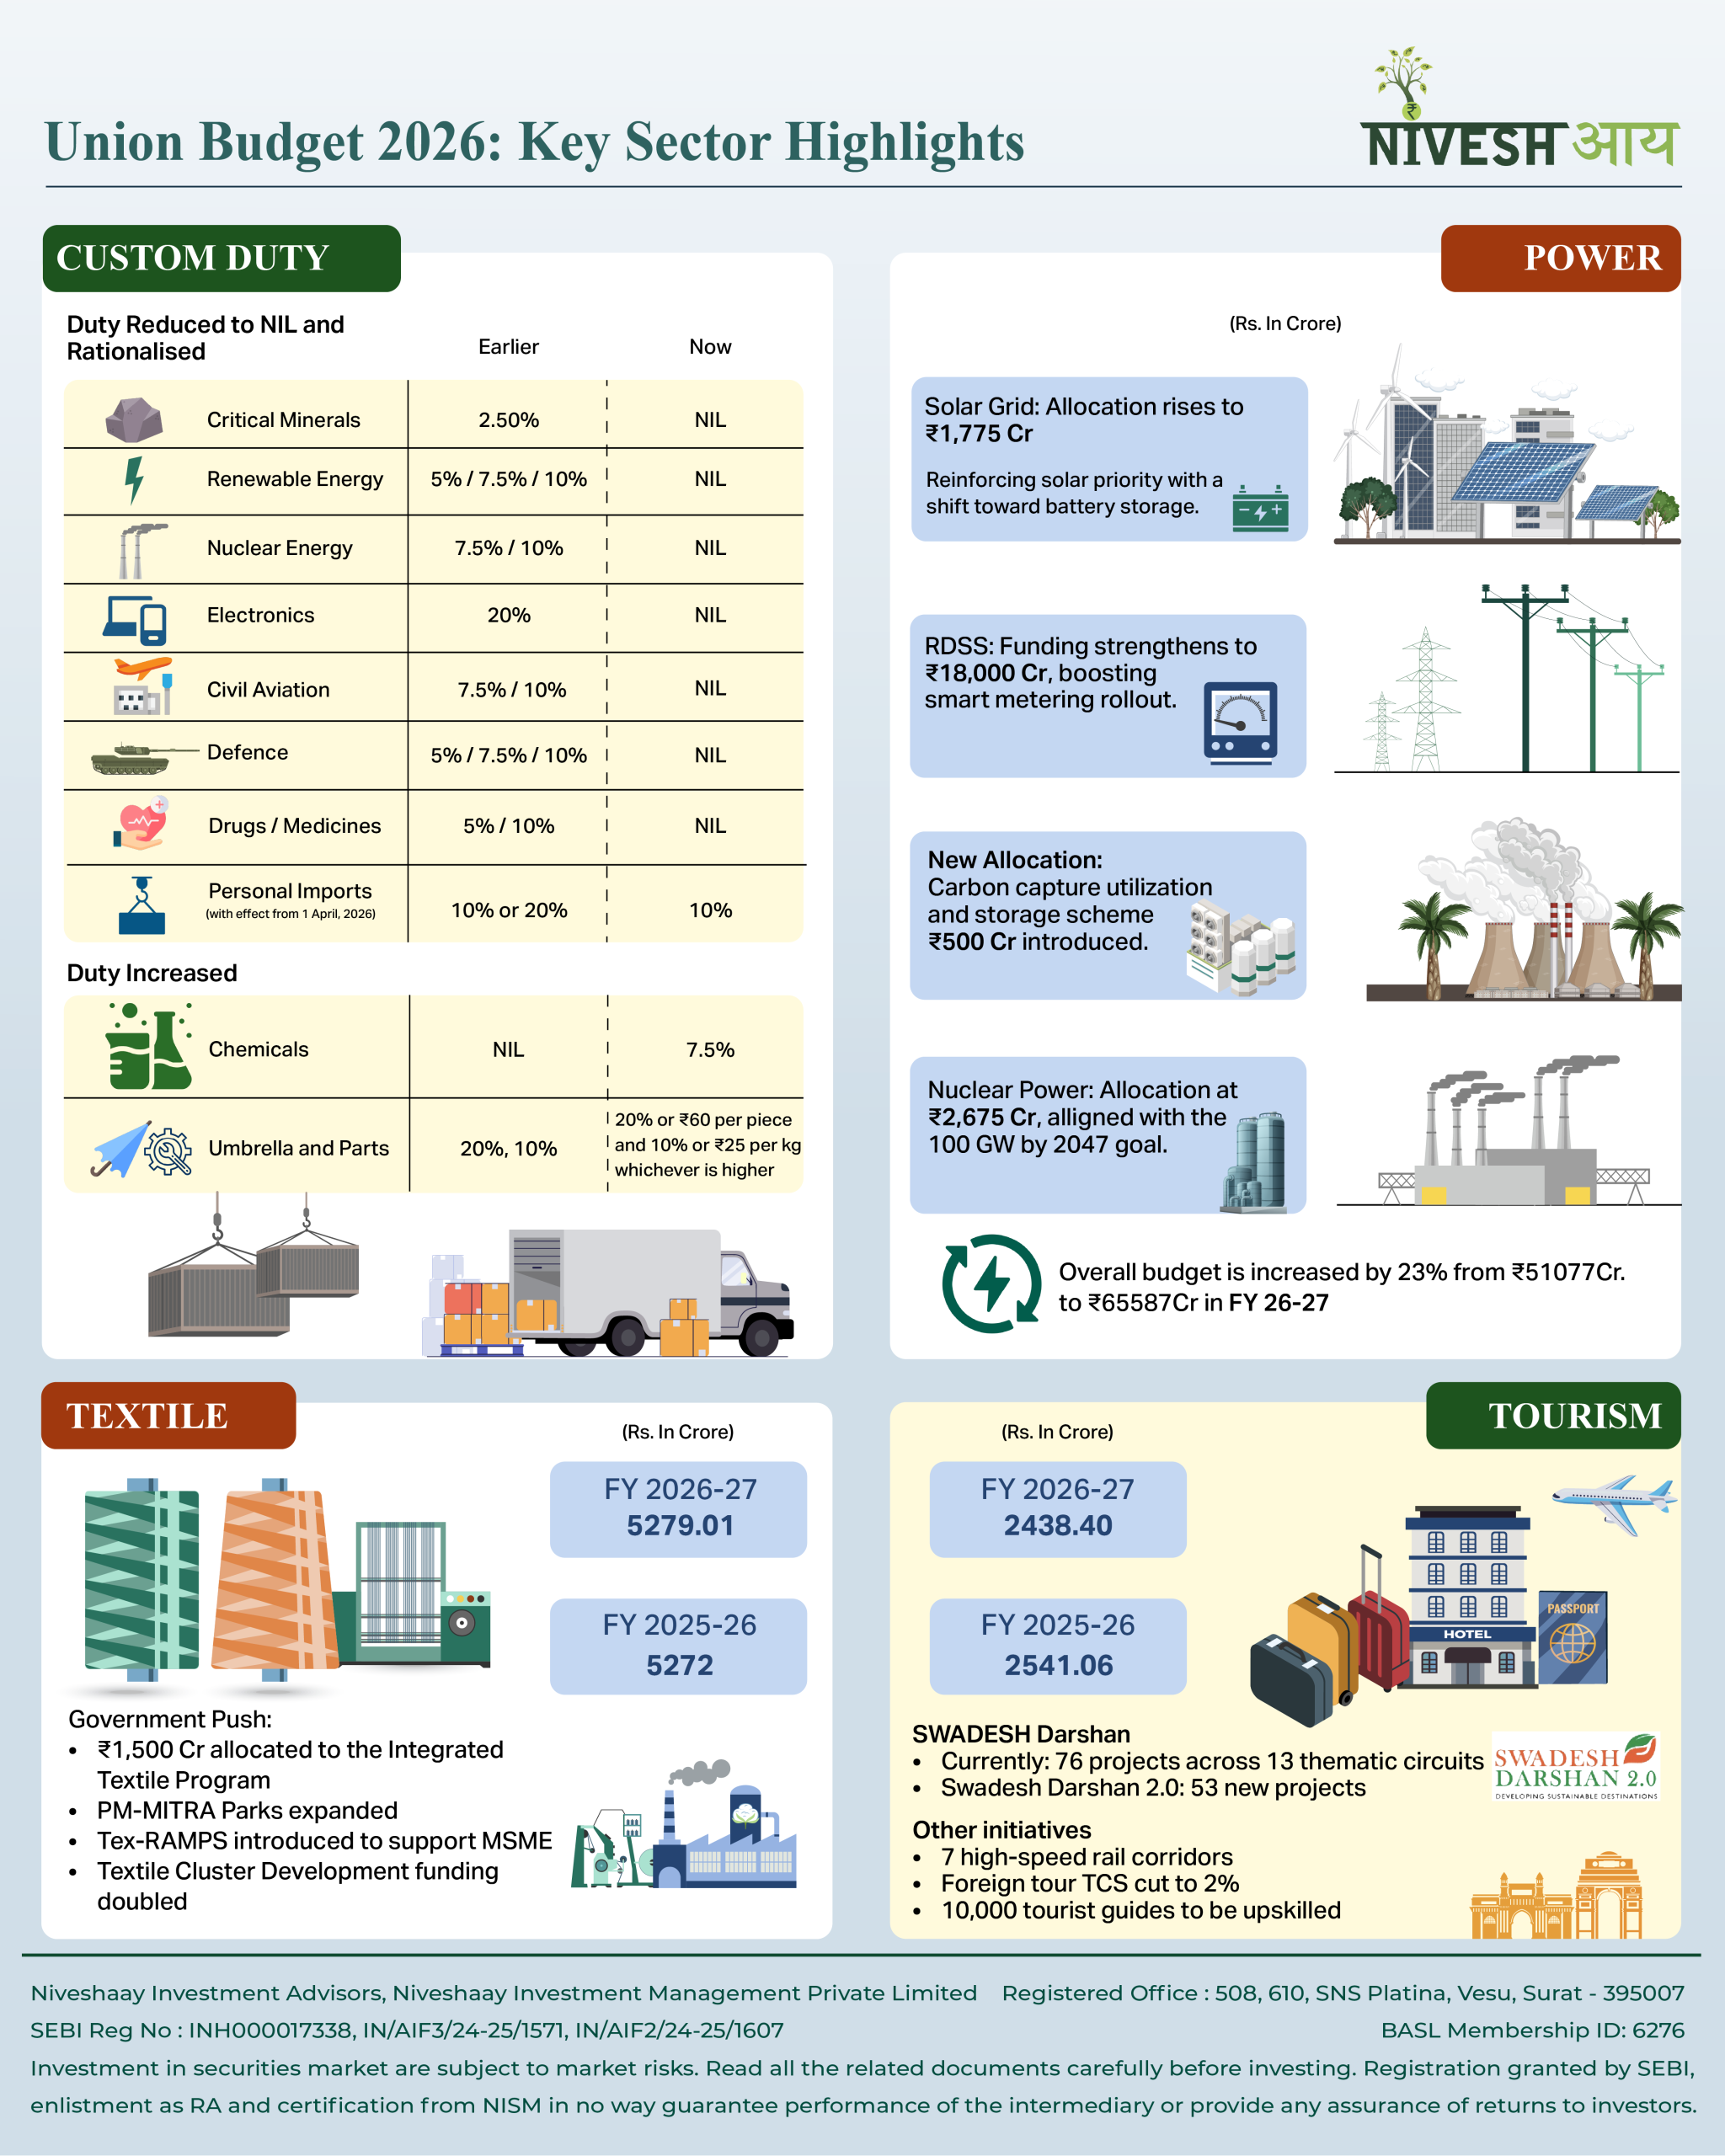
Union Budget 2026 isn’t about headline announcements, it’s about where capital is being committed. The allocation choices signal a clear shift toward execution, scale, and long-term capacity building.📊
From defence and railways to electronics and semiconductors, the budget maps India’s growth priorities with intent 🏗️⚙️.
These are sectors that don’t just drive GDP today, but shape competitiveness, self-reliance, and technological depth over the next decade.✨
In many ways, Budget 2026 reads like a blueprint for India’s next growth phase 🚀.
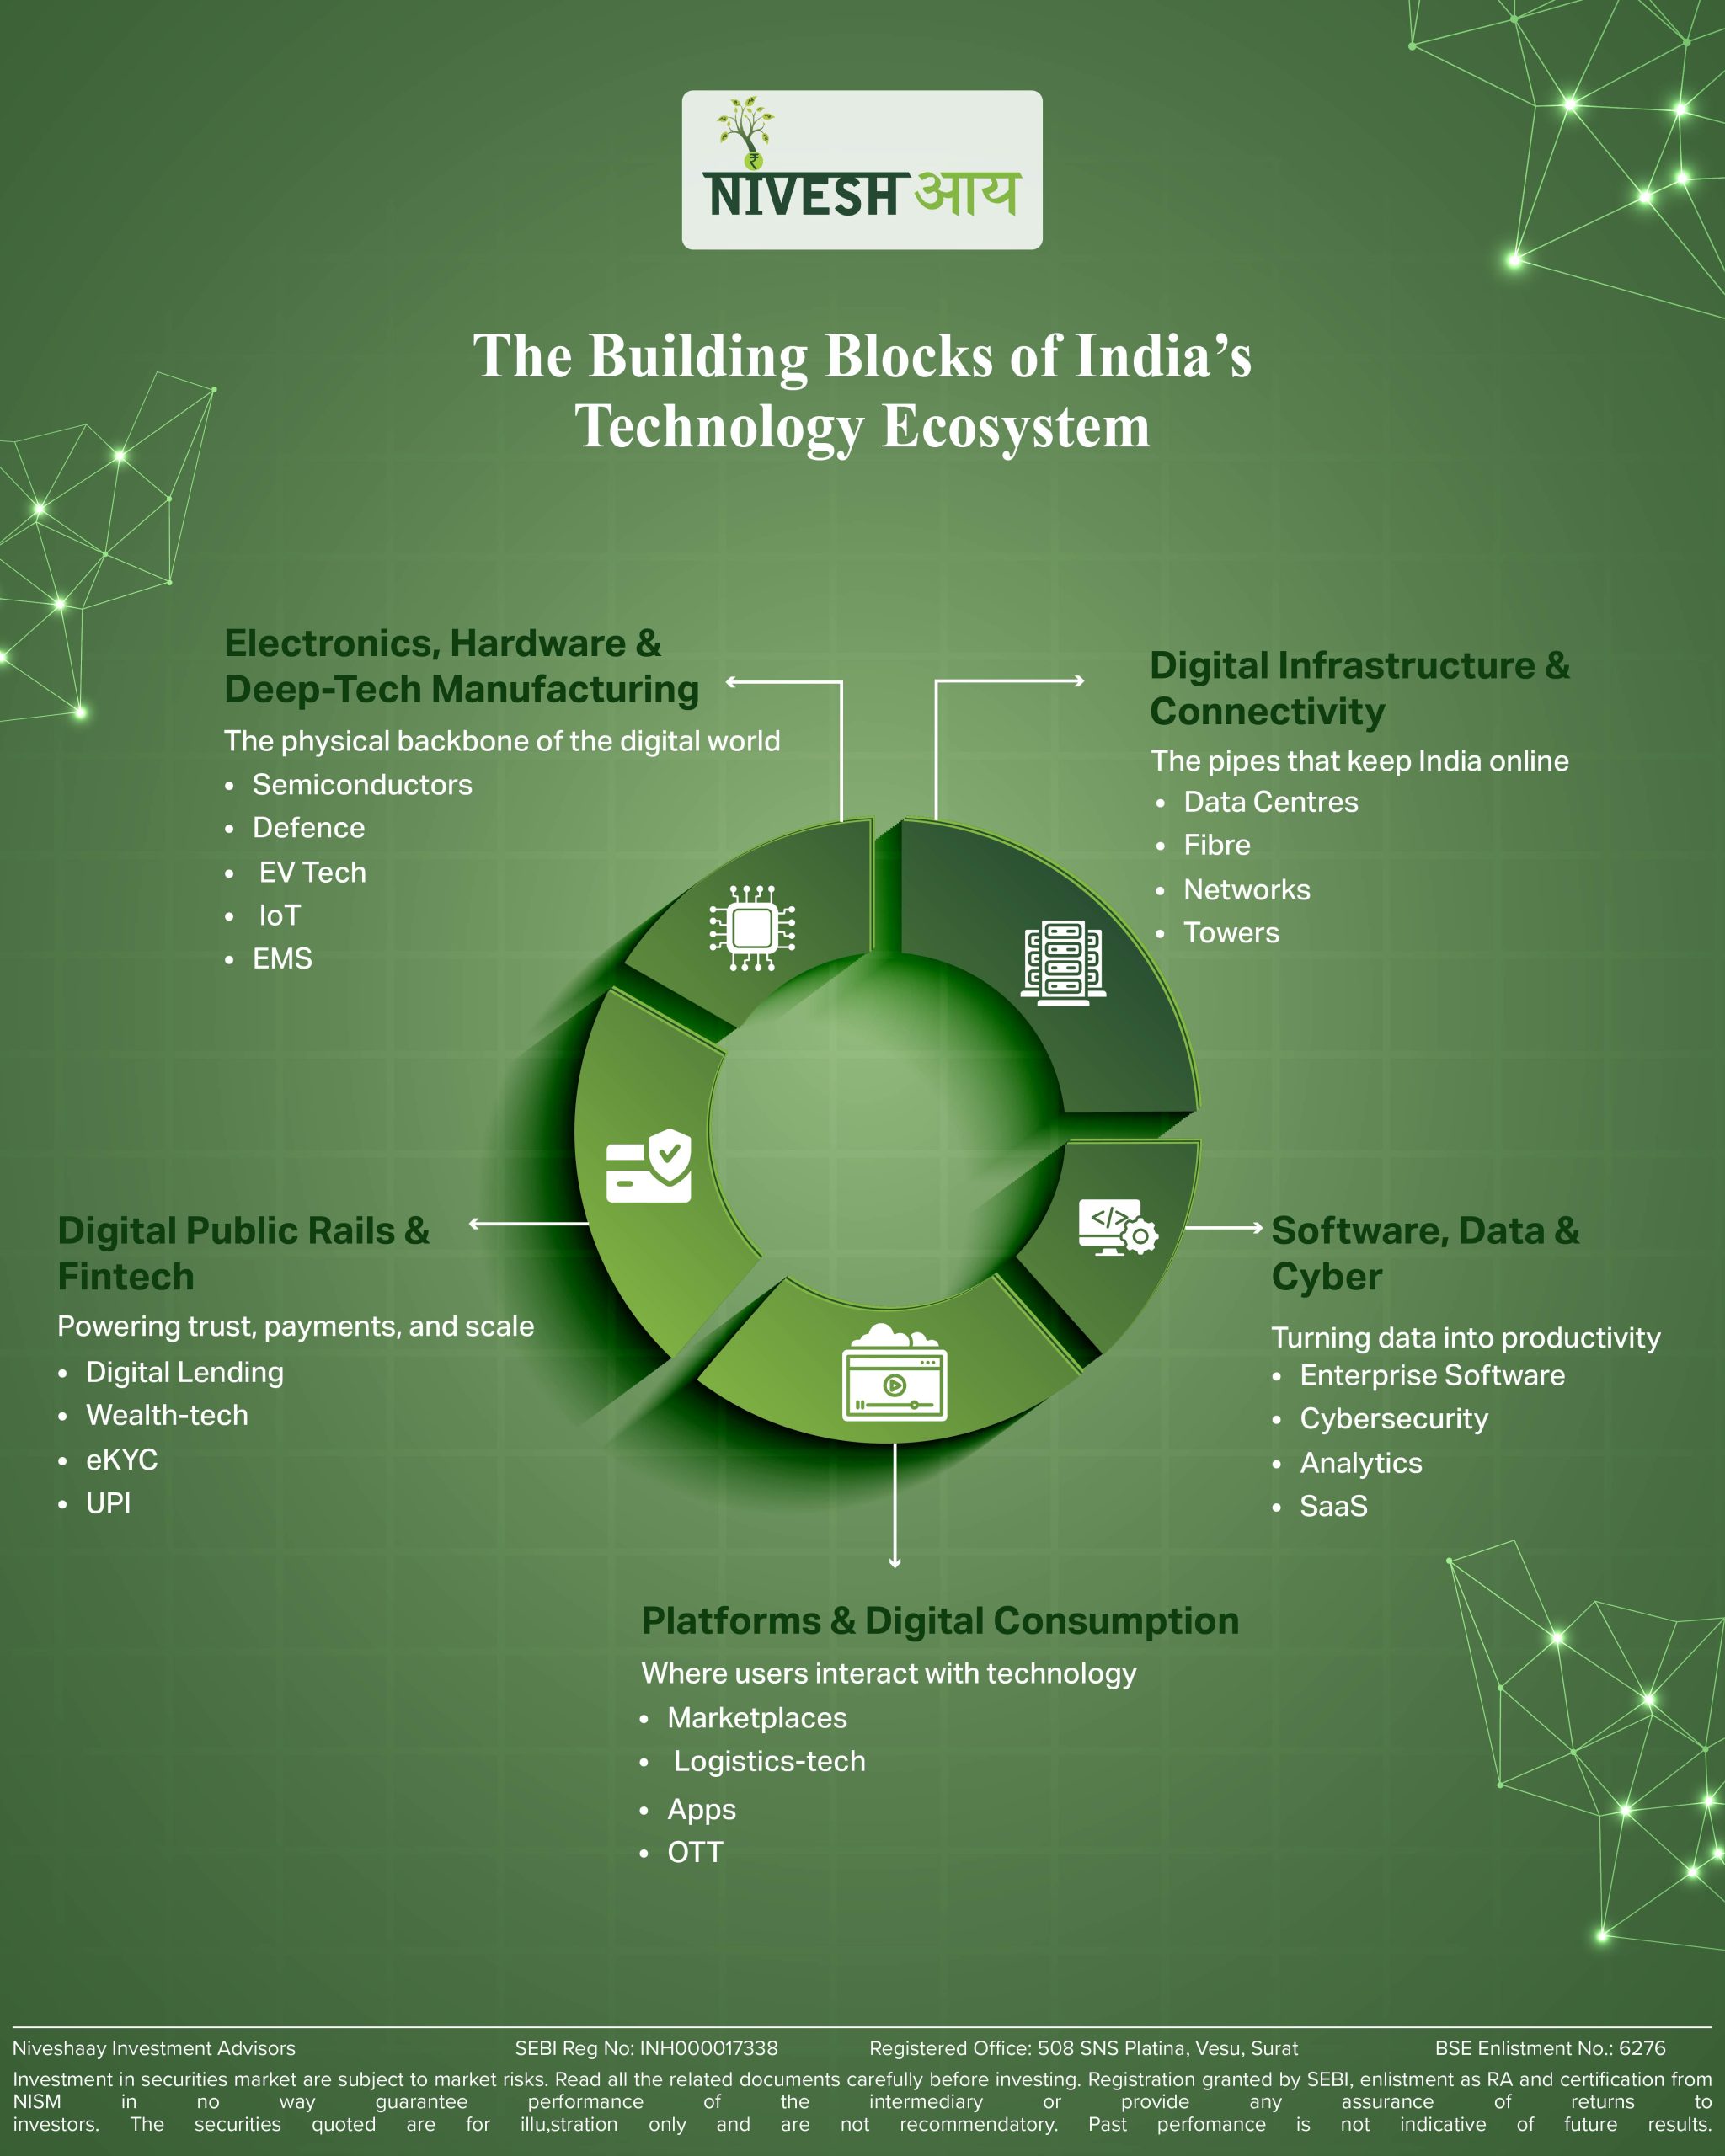
AI & Data Center
Five Pillars of Niveshaay TechStack
India’s tech story isn’t about one sector or one moment. It’s a full-stack compounding cycle—digital rails, physical infrastructure, software, platforms, and hardware working together to scale adoption and value creation.

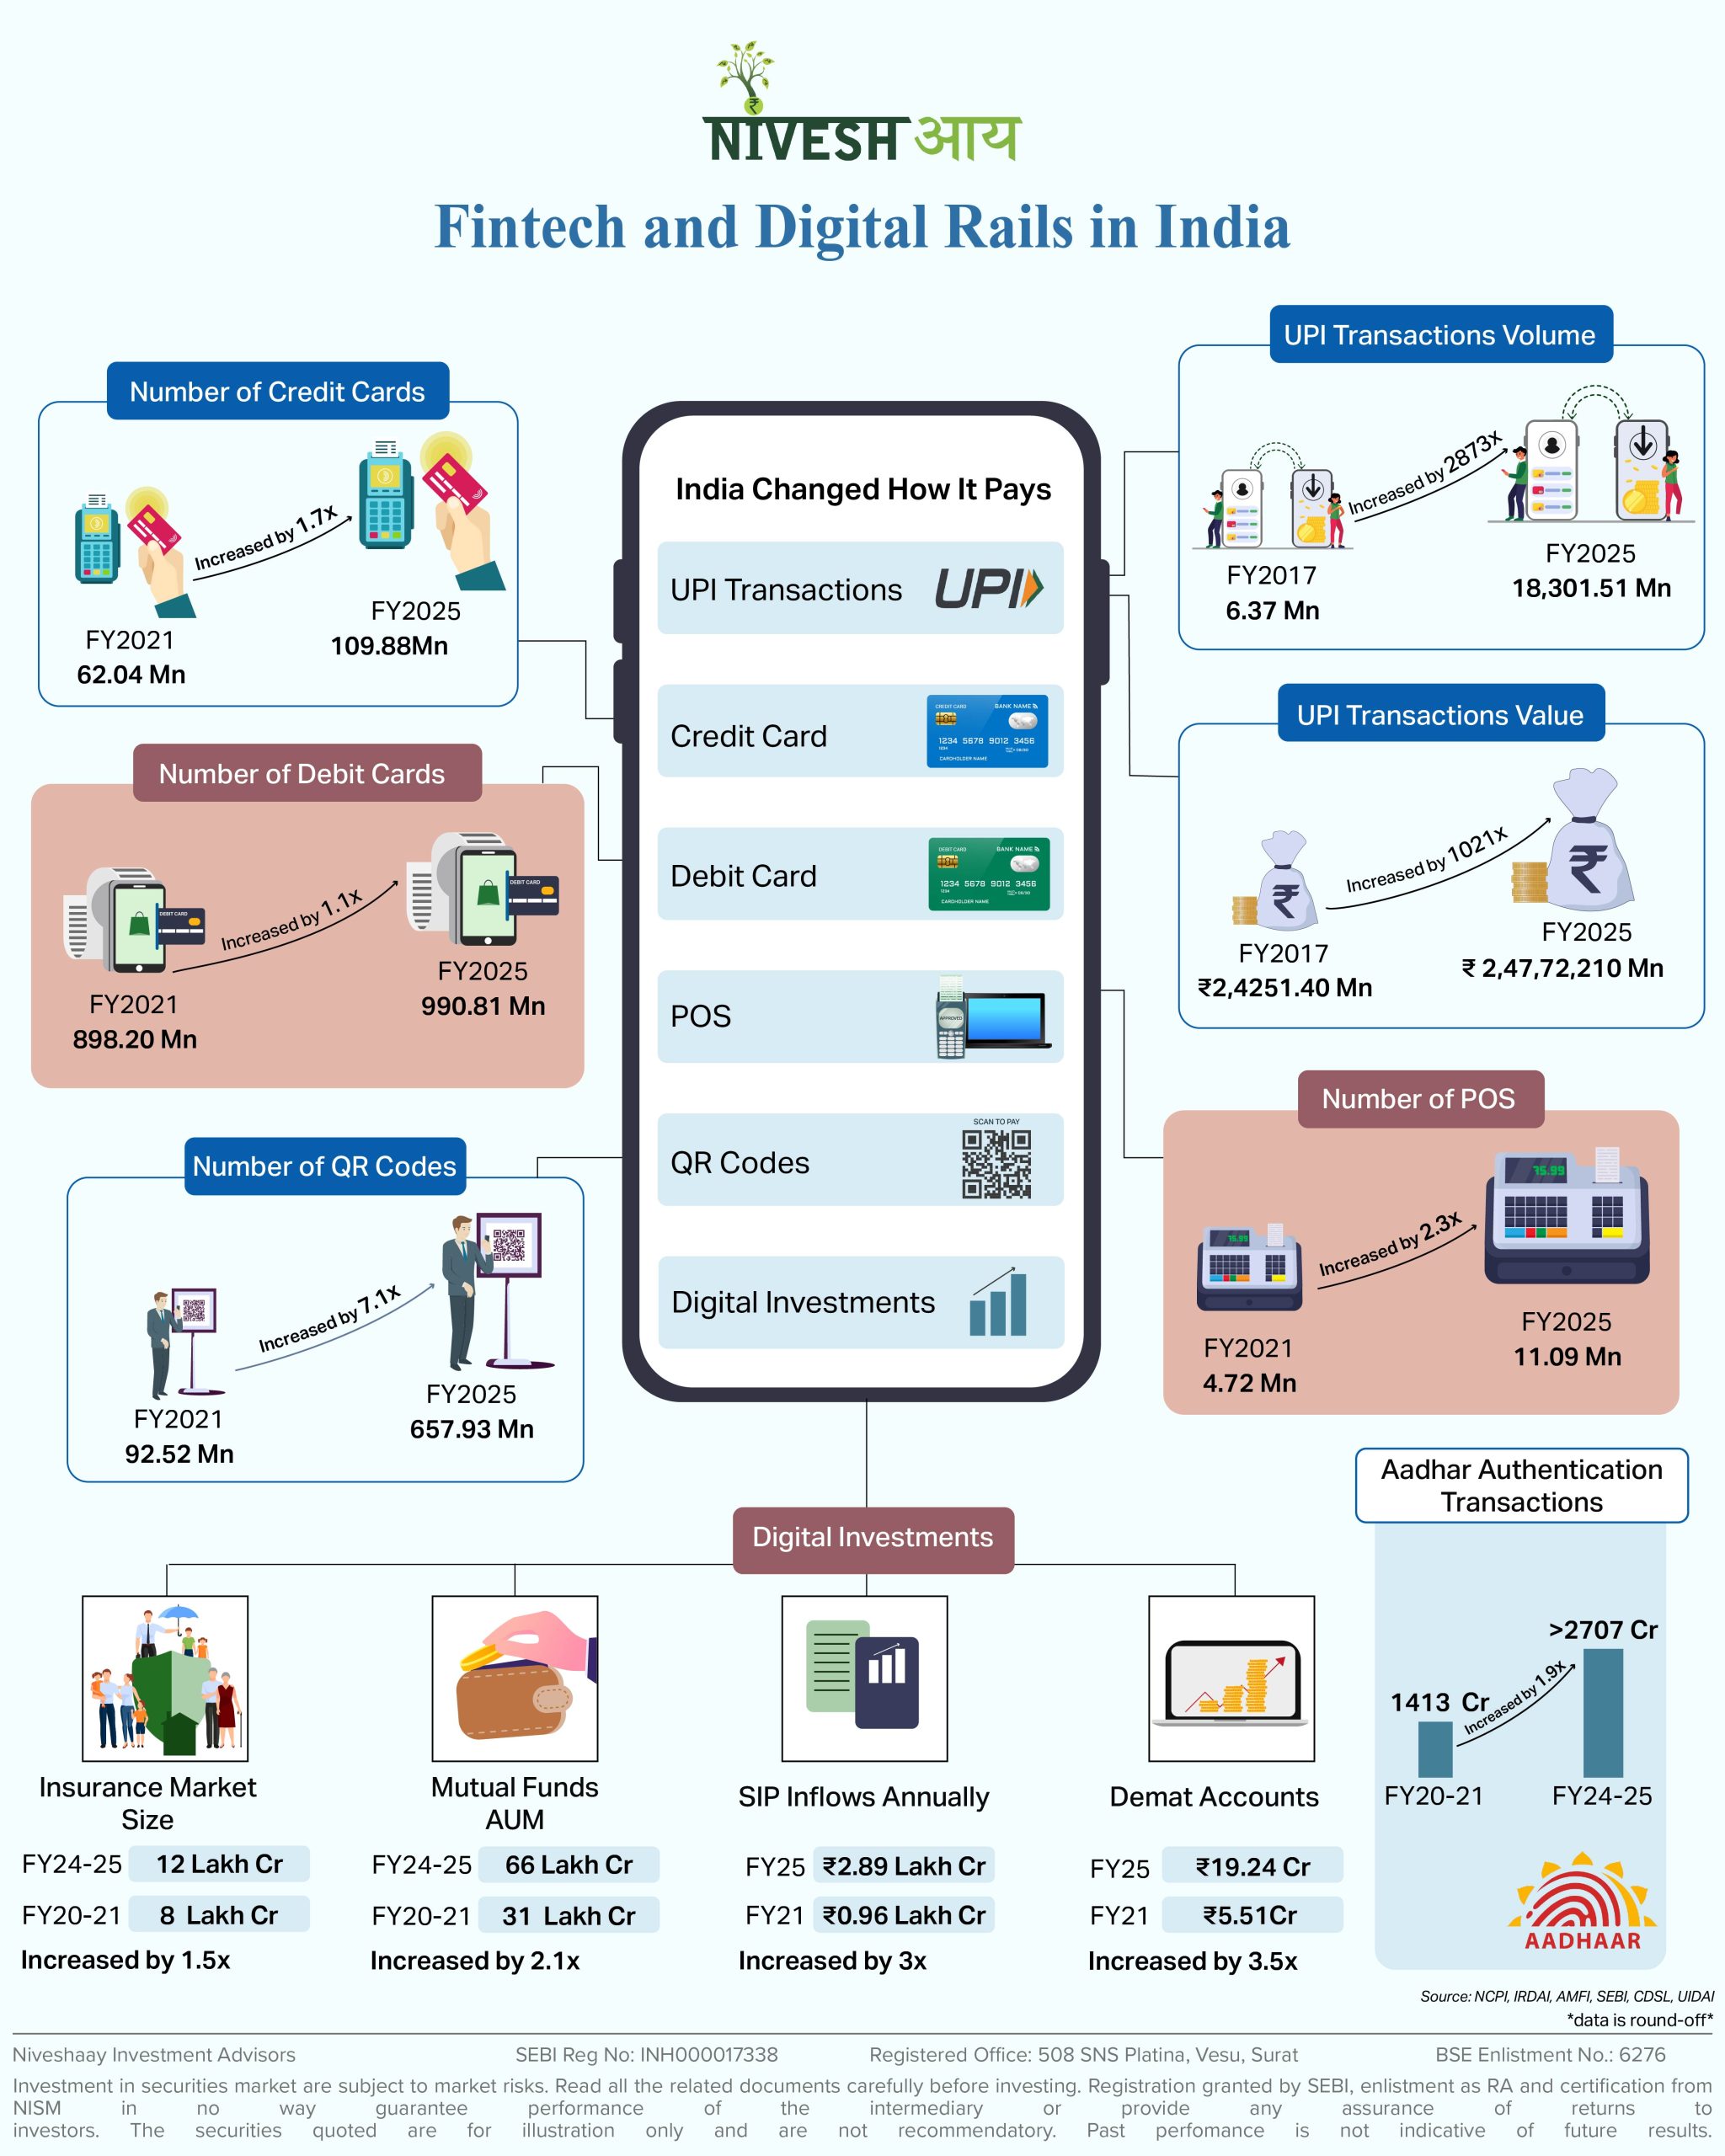
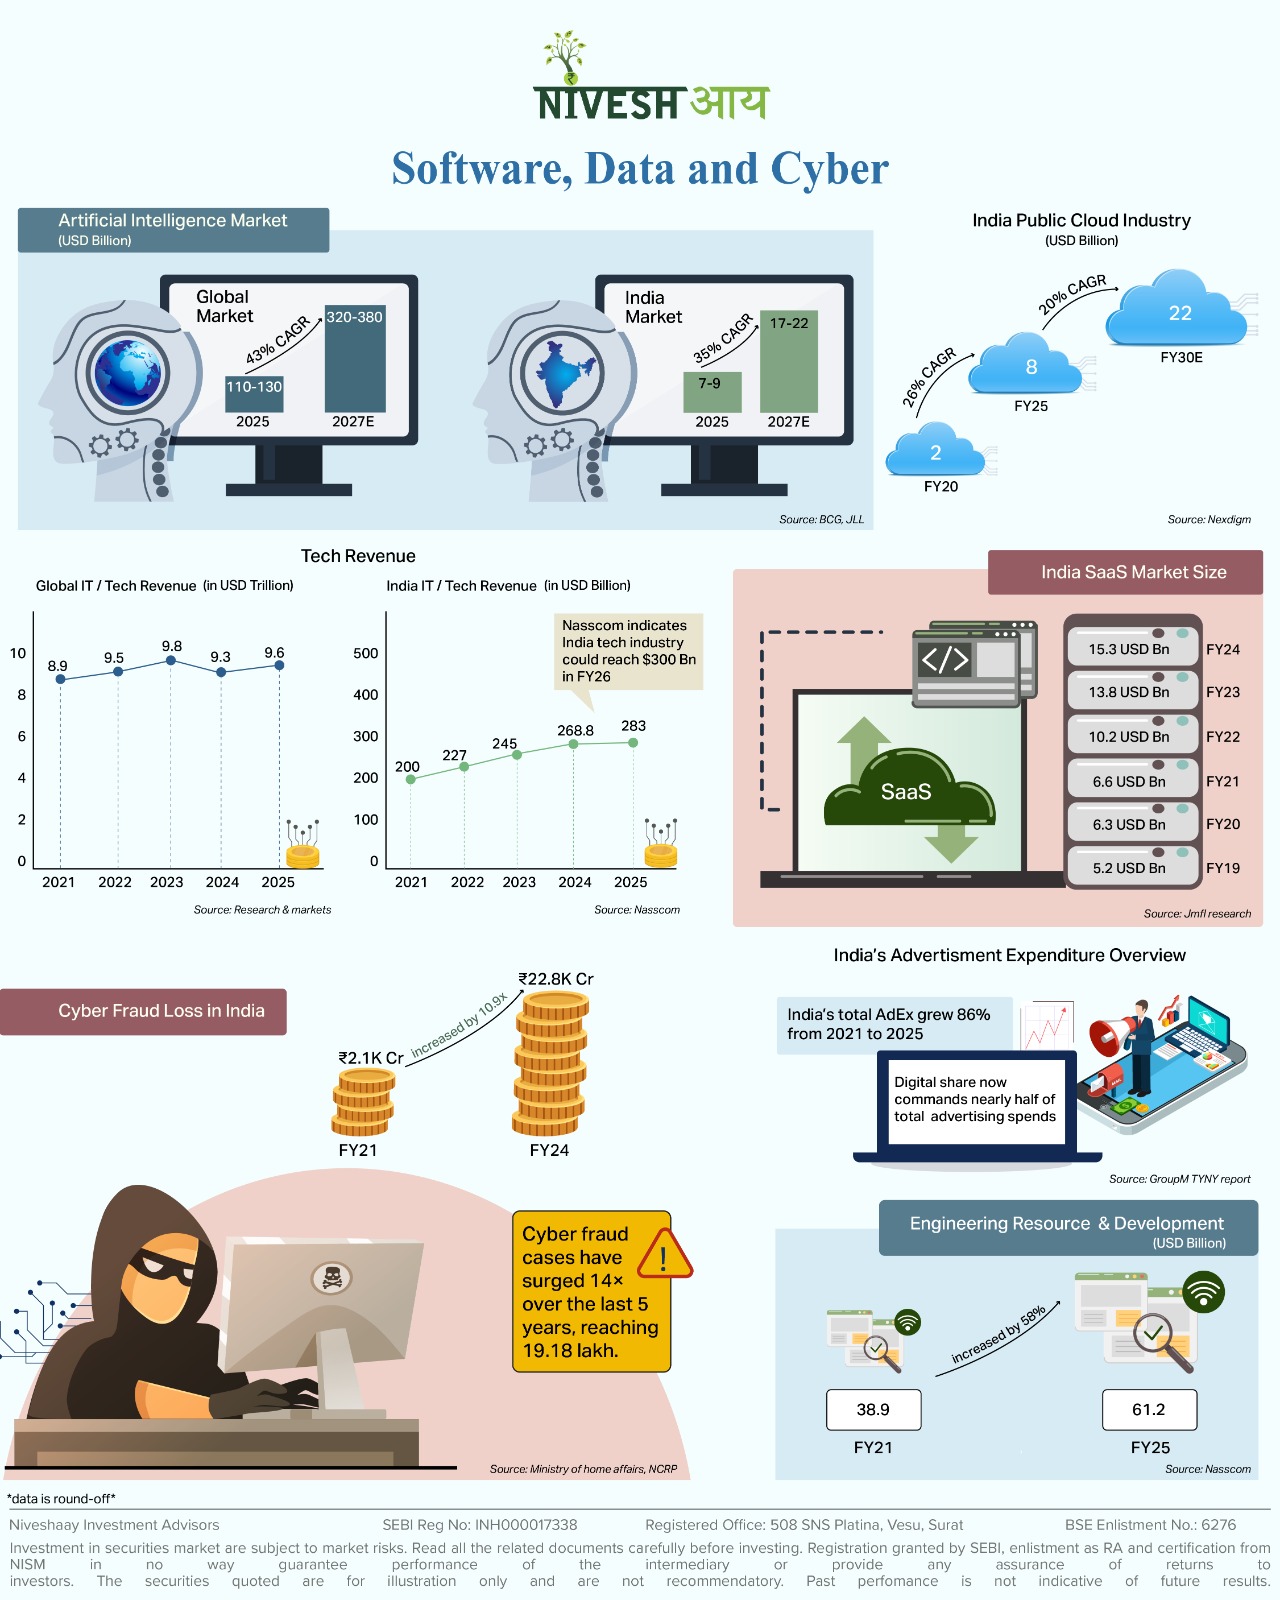
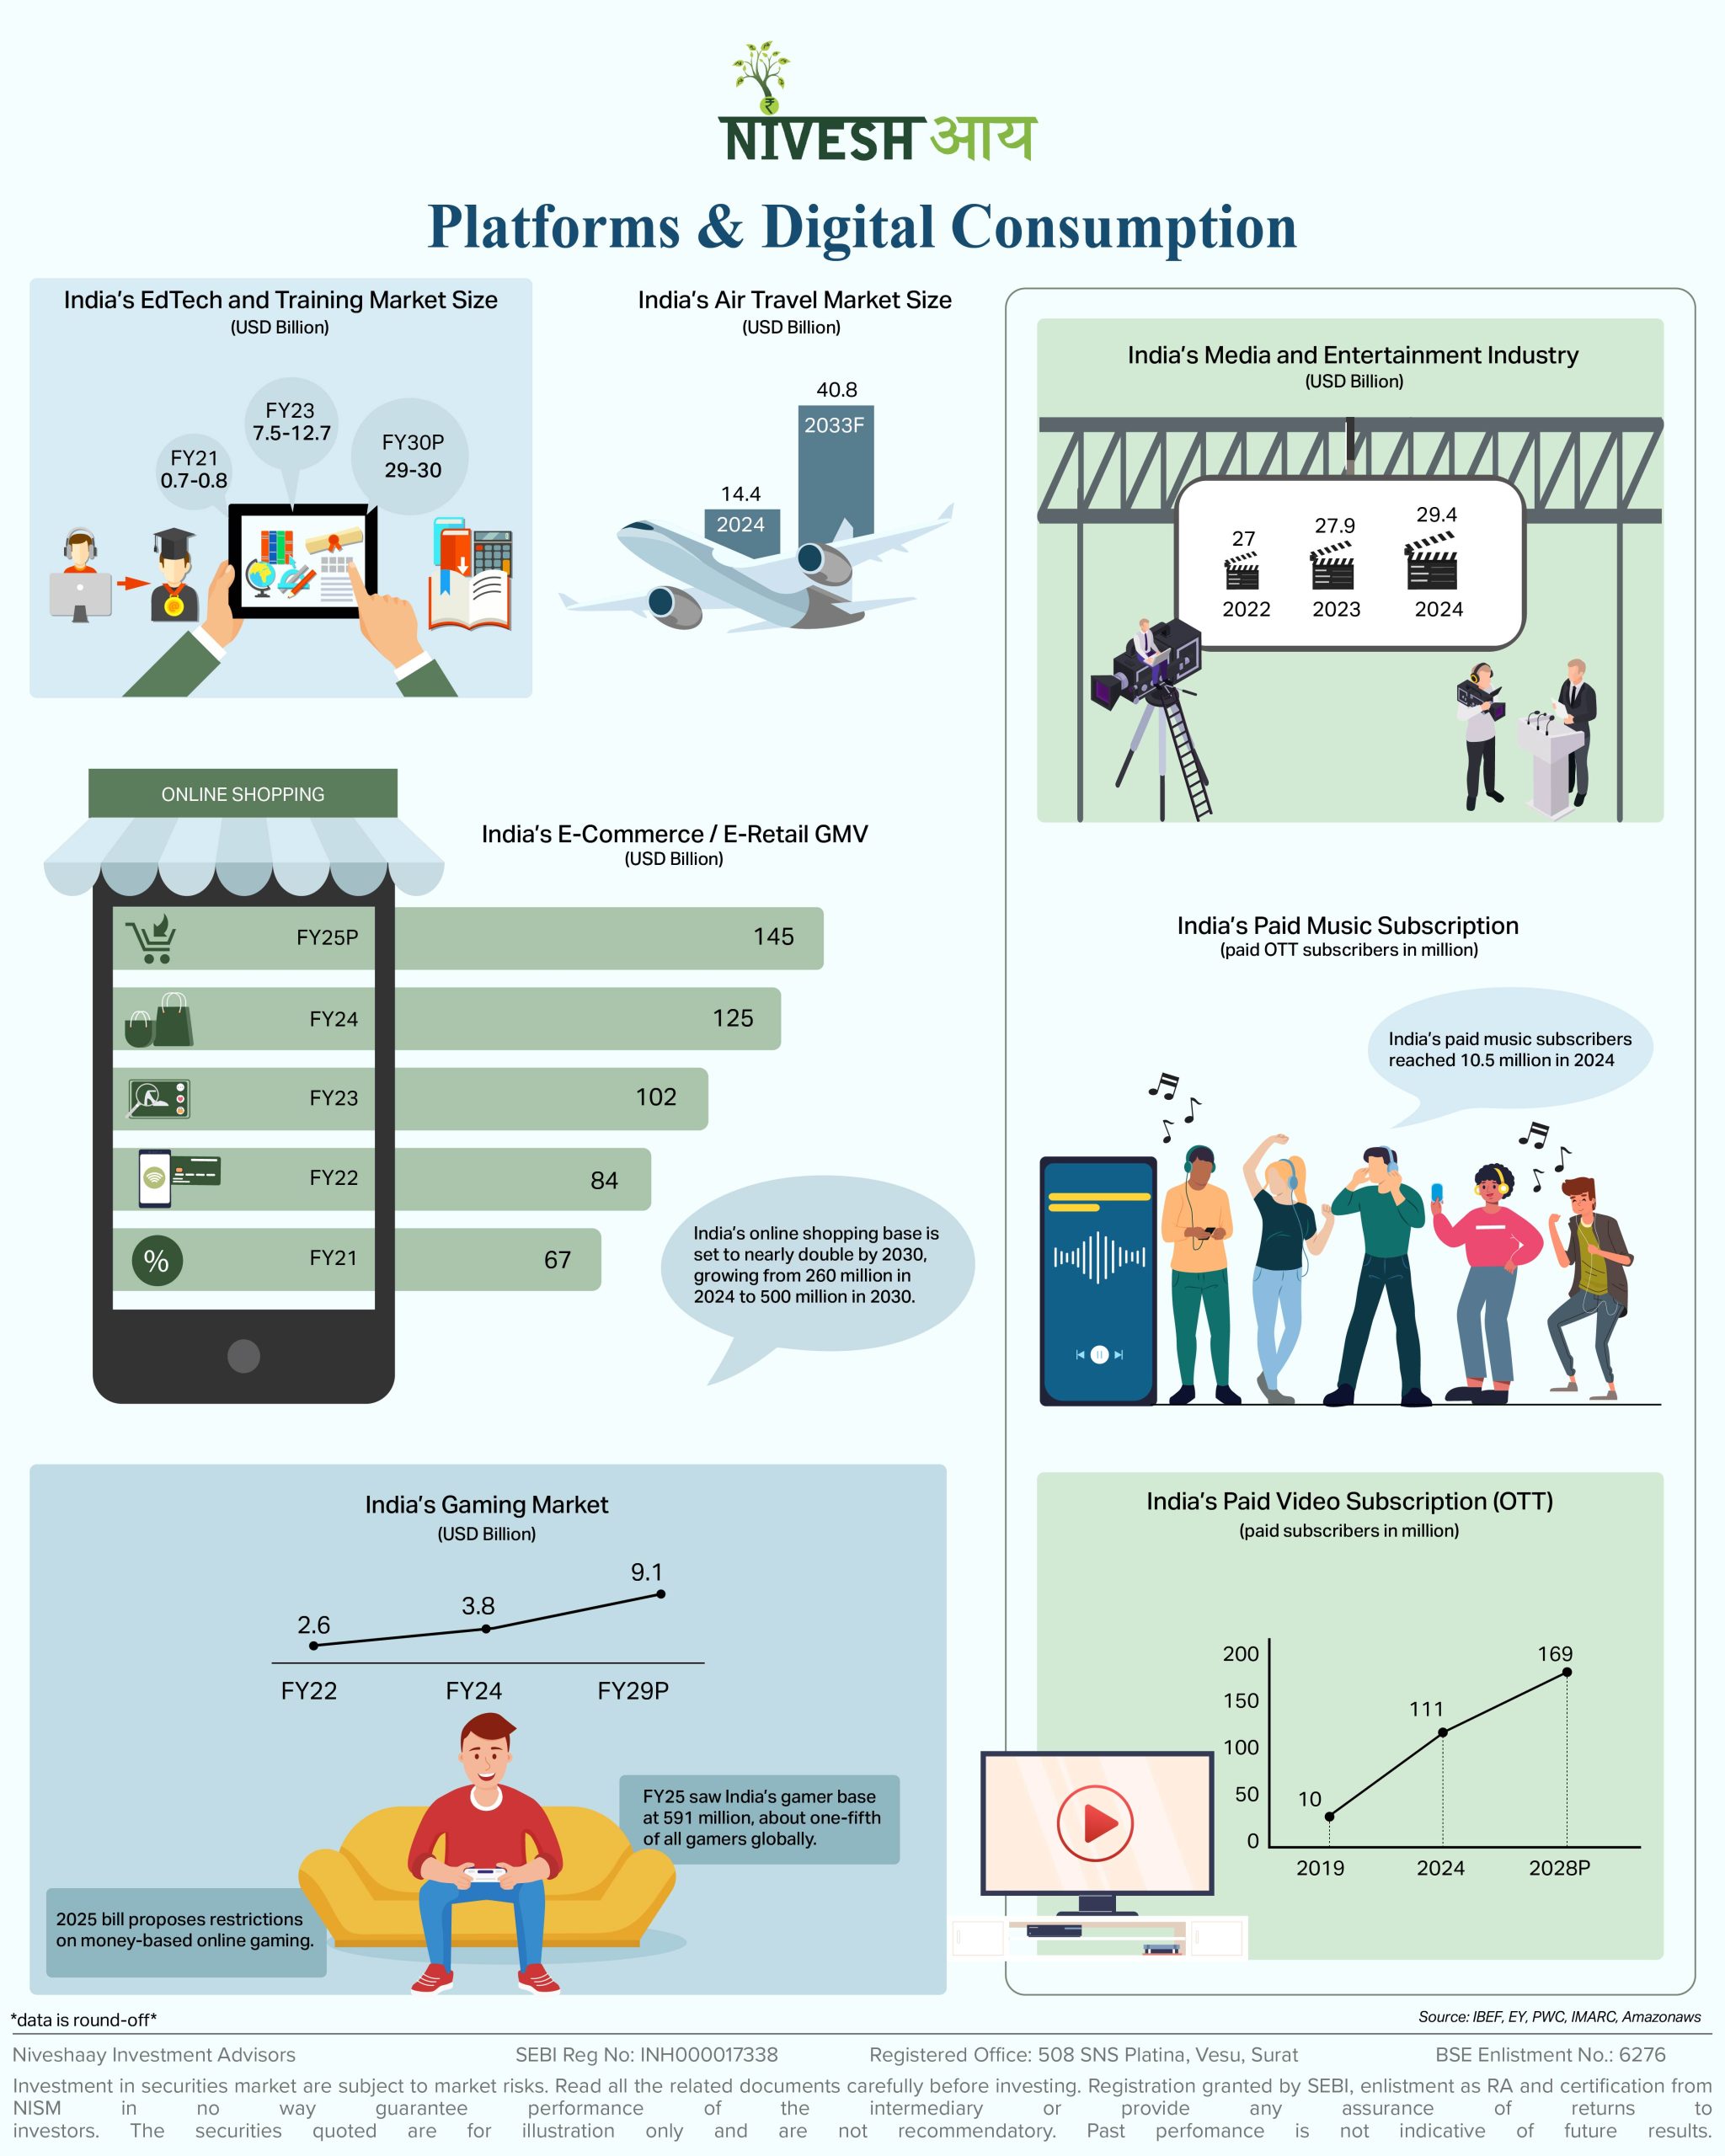
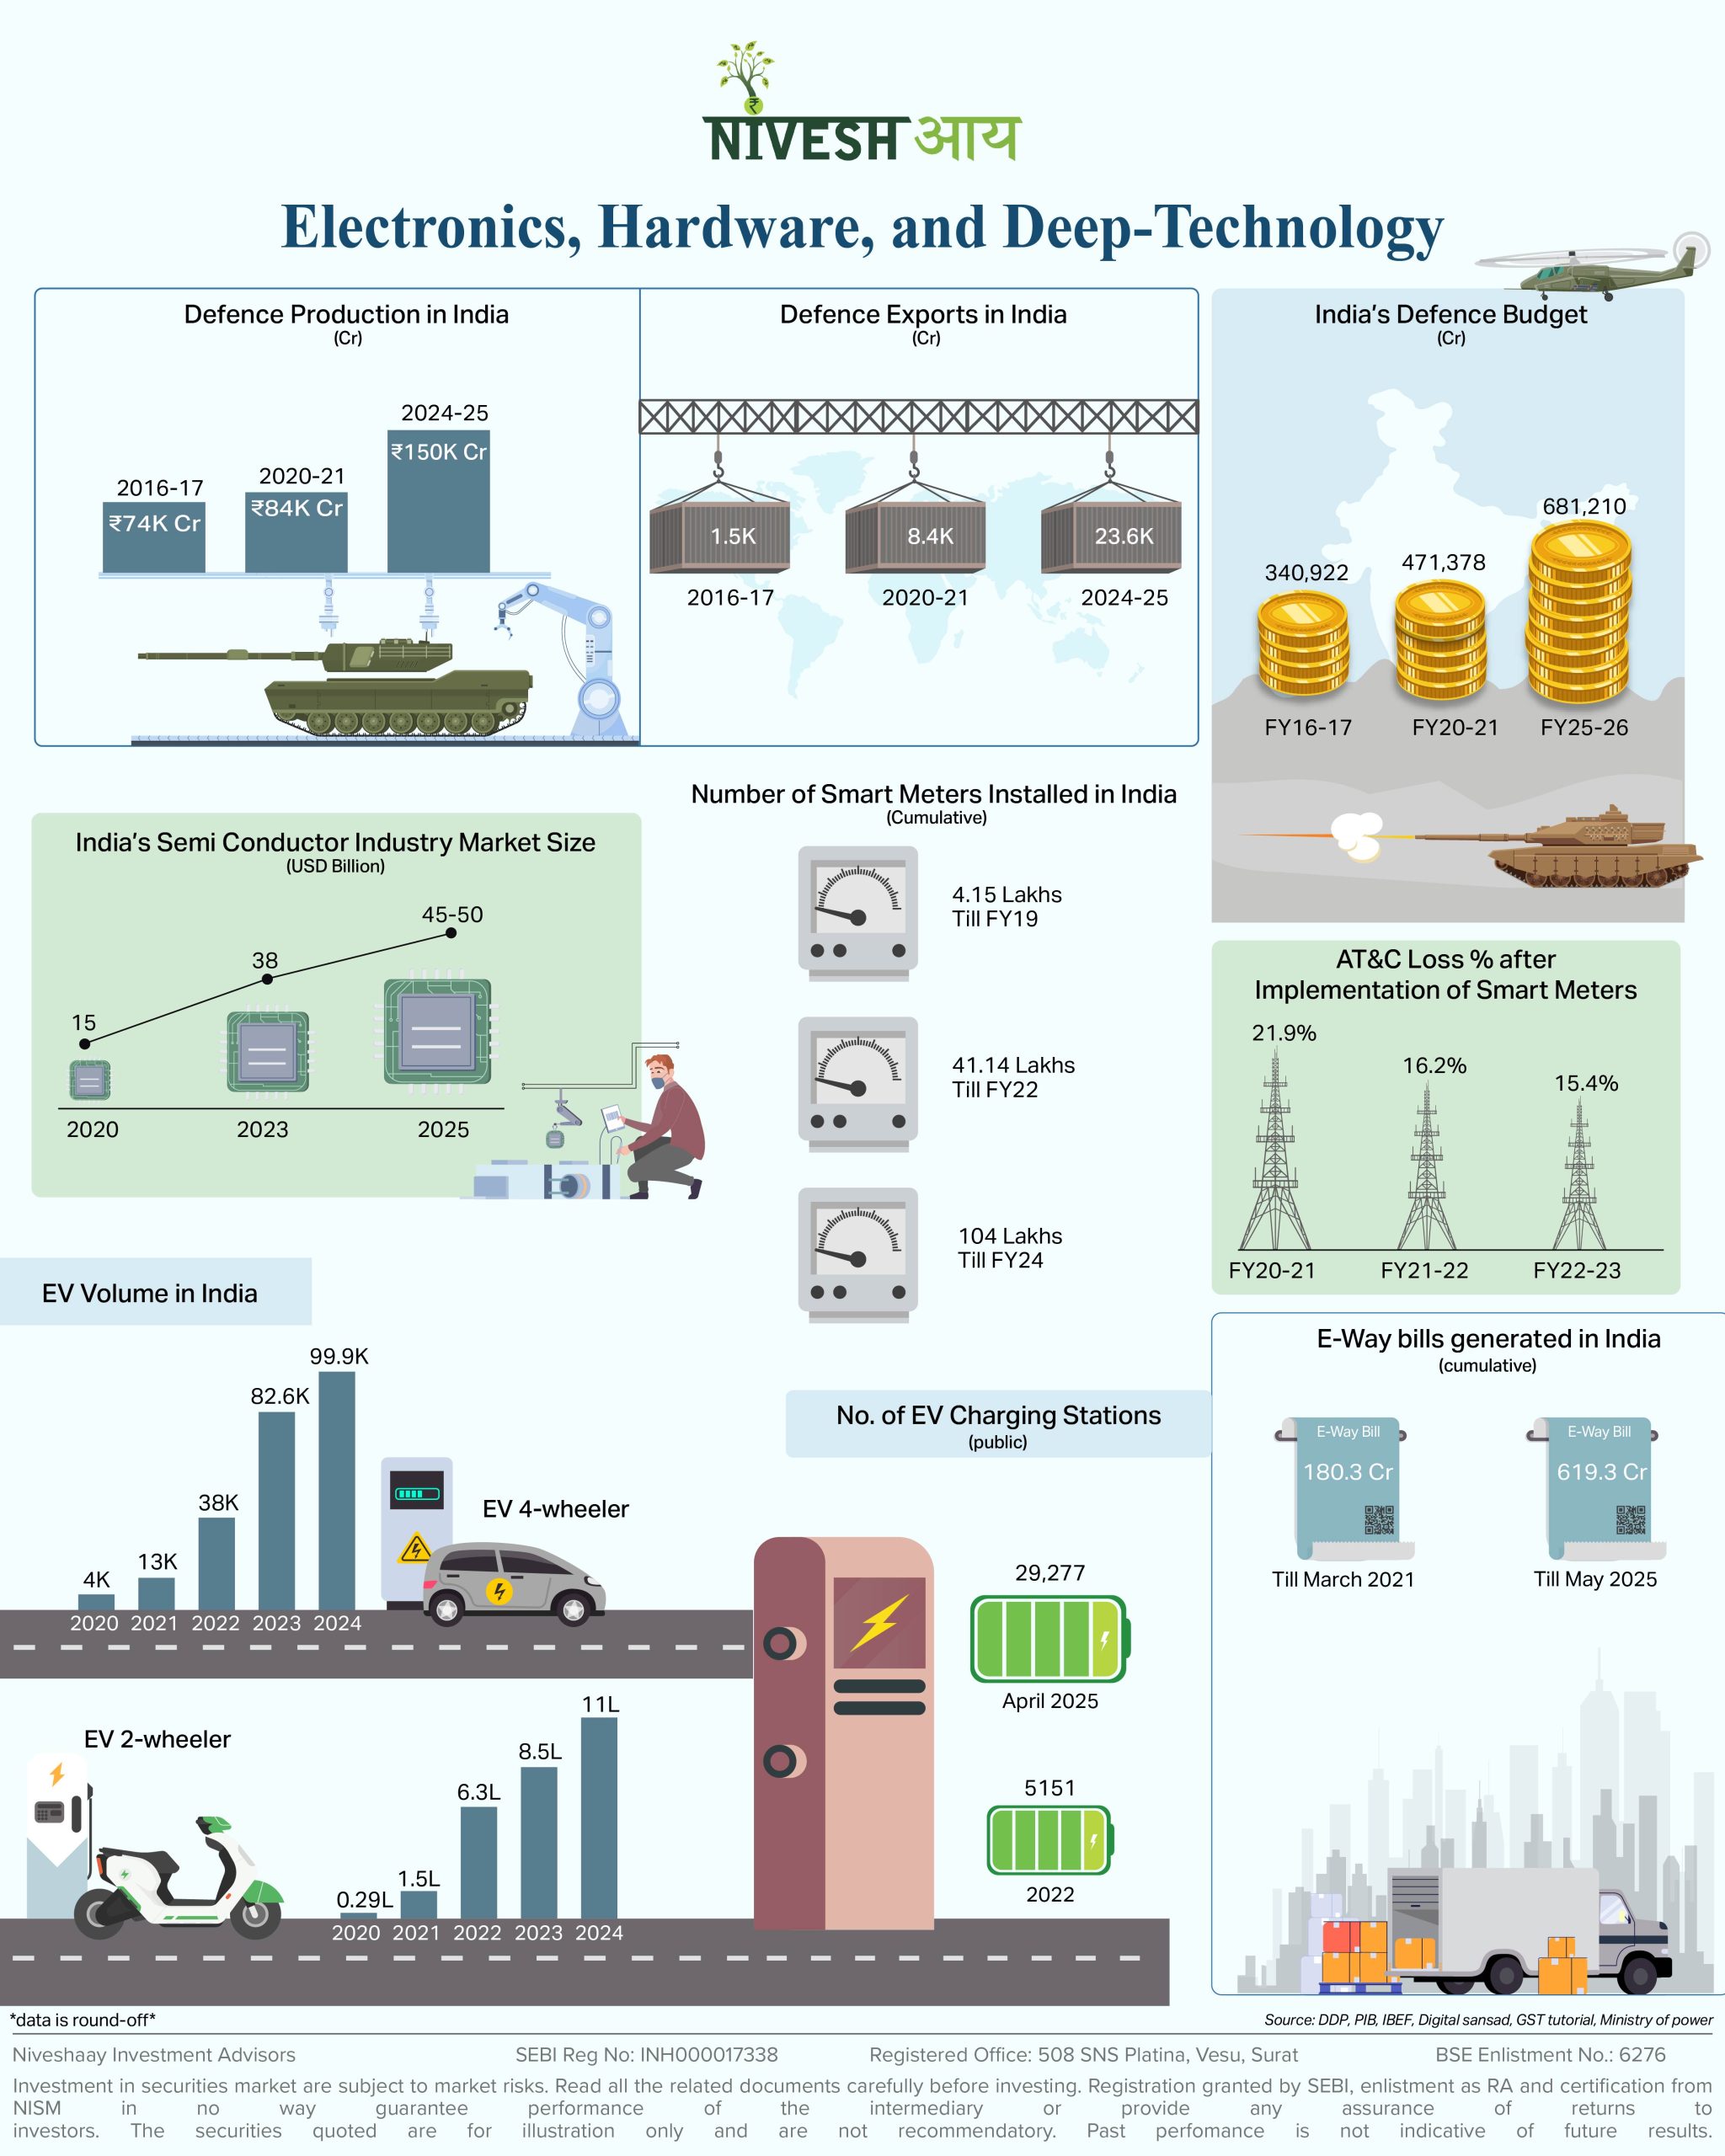
India’s tech story isn’t about one sector or one moment. It’s a full-stack compounding cycle—digital rails, physical infrastructure, software, platforms, and hardware working together to scale adoption and value creation.
That’s why the Niveshaay TechStack spans multiple complementary sub-sectors, designed to participate across each wave of India’s digital transformation—from IT and telecom to consumer internet, fintech, and now the India Stack & AI era.
You can swipe through each infographic to gain an understanding of sub-sector :
1) Digital Infrastructure & Connectivity
2) Fintech & Digital Public Rails
3) Software, Data & Cybersecurity
4) Platforms & Digital Consumption
5) Electronics, Hardware & Deep-Tech
👉 For deeper understanding of whole Technology Ecosystem read our Blog.

Space Ecosystem
From Cyber Cafes to AI: Four Waves of India’s Digital Revolution
Remember the era of cyber cafés with “Net ₹20 per hour” boards, the slow dial-up modems loading pages line by line, and the pride when you got your first internet-enabled phone? In less than 30 years, India has sprinted forward. We’ve gone from dial-up tones and SMS packs to UPI QR scans at the neighborhood
Today, that leap is visible everywhere. India had nearly 954 million internet subscribers as of March 2024 (up from 881 million a year prior), and internet usage soared from single-digit penetration in 2010 to well over half the country by 2022. The IMF even recognizes India’s UPI as the world’s largest real-time payments system by volume, with about 49% of global instant payment transactions running through this Indian platform.
But this story isn’t just about flashy apps or one visionary founder. It’s about a full-stack transformation – public digital rails (like UPI and Aadhaar), built on hard infrastructure (fiber-optic cables, mobile towers, data centers, power grids), and scaled through software that made digital services simple, cheap, and trustworthy for the everyday Indian. And at each wave of adoption, investors who spotted the shift early saw outsized wealth creation across IT services, telecom, internet platforms, fintech, and the infrastructure backbone that quietly powered it all.
In this blog, we’ll walk through four waves of India’s digital transformation – from the early IT outsourcing boom, to the telecom revolution, to the rise of consumer internet platforms, and now the India Stack & AI era. Along the way, we’ll see how infrastructure and software together created compounding value, and how a thematic investment approach (like the Niveshaay TechStack) aims to participate in this mega-trend — one wave at a time.
The first wave of India’s internet journey didn’t put a smartphone in every hand – it put Indian tech talent on the global map. In the late 1990s and 2000s, as the internet spread worldwide, India became the “back office of the world.” Companies like TCS, Infosys, and Wipro led an IT outsourcing boom, delivering software services and business-process support to global clients. They harnessed early internet connectivity (even when dial-up was painfully slow) to work remotely for Western firms, turning India into a technology outsourcing powerhouse. This era was about exporting tech services, not mass domestic internet usage – but it laid critical groundwork:

However, on the home front, internet access remained limited through the 2000s – often confined to urban cyber cafés and slow broadband for a privileged few. By 2010, only around 7–10% of Indians were online. The stage was set: India had proven tech companies and an emerging network infrastructure. The spark for mass domestic internet adoption would come next, igniting Wave 2.
Wave 2 was a turning point that made the internet a utility for hundreds of millions of Indians. In the 2010s, a perfect storm of factors — aggressive telecom investment, plummeting data prices, and affordable smartphones — brought mass connectivity to India’s doorstep.
It started with telecom operators pouring billions of dollars into spectrum and infrastructure. Companies built nationwide 4G networks, laid fiber-optic backbones, and installed thousands of cellular towers across the country. By 2023, over 95% of India’s population had access to a 4G signal, and 5G rollouts were reaching even remote areas. This dramatic expansion of coverage went hand-in-hand with a collapse in data costs.
Figure: Internet penetration vs. data cost. The average cost of mobile data in India plummeted from around ₹226 per GB in 2015 to under ₹10 per GB by 2019, making it one of the cheapest data markets in the world. This freefall, largely sparked by Reliance Jio’s entry in 2016 and the ensuing price wars, brought millions of new users online each month. India’s total internet connections surged from about 25 crore (250 million) in 2014 to over 83 crore (830 million) by 2021 – a 230% jump in seven years. Cheap data effectively democratized the internet in India, turning mobile broadband into a basic necessity on par with electricity or highways.
On the investment front, telecom and infrastructure players benefited enormously from this wave. The major telecom operators – Reliance Jio (via RIL), Bharti Airtel, and (earlier) Vodafone Idea – gained hundreds of millions of subscribers and saw data usage per user explode (from mere megabytes to many gigabytes per month). After a brutal price war, the surviving players saw average revenue per user (ARPU) stabilize and then start rising, rewarding those companies with stronger balance sheets. Over the full cycle, telecom stocks delivered exceptional long-term returns as they transformed from voice-call providers into data utilities (though not without bouts of volatility due to fierce competition and regulatory twists).

Importantly, it wasn’t just the mobile operators that prospered. A whole ecosystem of physical infrastructure companies scaled up alongside them: tower leasing firms, fiber network owners, and data center providers. Many of these were part of listed telecom groups or infrastructure trusts. Investors who recognized that the “Digital India” story rested as much on concrete, steel, and spectrum as on apps profited from steady, long-term plays in this space. Wave 2’s big lesson was that building the pipes and power for the internet could be just as lucrative as building the apps. With the highways of cheap data now laid, what followed was an onrush of online services riding on them.
Once affordable 4G and smartphones became ubiquitous, the front-end of India’s internet economy – consumer apps and digital platforms – took center stage. If Wave 2 built the highways, Wave 3 saw all kinds of vehicles zooming down them, delivering everything from meals and groceries to jobs and entertainment. This was the era when “there’s an app for that” became reality for India’s masses, and the way Indians shopped, traveled, and amused themselves changed forever.
Some of the biggest winners of this wave were the online platforms that became part of daily life. For example, in the late 2010s:

In most categories, one or two players emerged as market leaders – often scaling up thanks to network effects, brand recognition, and troves of user data. Several of these pioneers eventually listed on the stock markets, turning into household names for investors. Others remain private unicorns, but all of them rode the foundational fact that by 2020, 600–700 million Indians were browsing and transacting online, compared to barely tens of millions a decade prior.
Yet behind every “digital” experience in Wave 3 lurked a formidable physical backbone. E-commerce wouldn’t work without massive warehouses, fulfillment centers, and last-mile delivery fleets. Food and grocery apps rely on complex logistics, cold storage, and armies of delivery riders on bikes. Even digital content requires data centers and content delivery networks quietly humming in the background. This wave taught investors that the multi-baggers aren’t only the flashy consumer-facing apps you see on your screen – they’re also the less-glamorous logistics, retail, and infrastructure firms enabling the digital economy. Indeed, some of India’s listed logistics companies, warehouse REITs (Real Estate Investment Trusts), and tech-driven retailers saw strong growth and compounding in this period, fueled by rising e-commerce penetration and the formalization of supply chains.
A key example of this digital-meets-physical synergy was the rise of UPI (Unified Payments Interface) during this time. Launched in 2016, UPI removed the friction from everyday transactions, allowing even a street vendor to accept a smartphone payment in seconds. This turbocharged online consumption and brought millions of small businesses into the formal digital payments network.
Figure: The explosive growth of UPI. UPI’s adoption has been nothing short of spectacular – from just 6.3 million transactions in FY2017 to 13.4 billion in FY2024. By 2023, this real-time payments network was processing ₹14–20 lakh crore (i.e. trillions of rupees) in payments annually. The IMF and World Bank hail UPI as the world’s largest fast-payments system, carrying nearly half of all global instant payment transactions. Crucially, UPI made digital payments nearly ubiquitous and cost-free, fundamentally changing consumer behavior – people who once hesitated to enter their card details online now seamlessly scan QR codes to pay ₹50 for a chai. In turn, this has opened up new opportunities for fintech platforms, payment banks, and even traditional banks (thanks to increased transaction flows), many of which have rewarded investors with strong growth.
Wave 3, therefore, was about platforms and digital consumption – and it proved that India’s digital gold rush would have multiple winners. Yes, some app-based companies struggled or failed to monetize, but those that cracked the code (or dominated their niche) created immense value. Often, for every famous app you heard about, there was a less-heralded infrastructure or service company also profiting in the shadows.
We are now in the midst of Wave 4, where India’s digital journey is entering an advanced phase powered by public digital infrastructure and emerging technologies. On one hand, the India Stack – a set of government-enabled digital public goods – has matured. On the other, new trends like AI and cloud computing are triggering another investment cycle in tech infrastructure. Let’s break down this wave:

In Wave 4, the synergy of public digital rails and cutting-edge tech is once again unique to India’s story. Few countries have anything comparable to the India Stack (the UPI+Aadhaar-enabled ecosystem) that seamlessly connects government, businesses, and citizens. And few large economies still have so much headroom for internet growth – even at roughly 70% internet penetration, India’s per capita data consumption and digital service usage can grow for years to reach developed-market levels. This suggests that the opportunity for investors is far from over – in fact, it may be entering a new phase with a different set of winners. Wave 4 is already creating its own next generation of growth companies, and will likely continue to do so as AI adoption and digital public goods reshape the market.
Looking across these four waves, a few clear lessons emerge for investors:
These insights shape how we think about investing in the Digital India theme. Instead of chasing one-off fads or the newest hot IPO, a smarter approach is to map the entire value chain of the internet economy and invest in a basket that covers all the key layers. This is where the idea of the Niveshaay TechStack comes in.
India’s tech adoption is not a single-sector story. It’s a full-stack compounding cycle – from the pipes that carry data, to the rails that move money and identity, to the software that secures and orchestrates digital activity, to the platforms that convert attention into transactions, and finally to the hardware that powers the next wave of computing.
That’s exactly why the Niveshaay TechStack is structured around five complementary sub-sectors. You’re not “betting on one trend” – you’re participating in the entire ecosystem that benefits from Digital India. The five pillars of this basket are:

By investing in the Niveshaay TechStack, you essentially get a strategic slice of all the key drivers of India’s digital economy, rather than placing all your chips on one segment. This diversification is crucial because, as history shows, digital themes can be volatile – a policy change or technological disruption can suddenly shuffle the winners and losers. A basket approach allows us to express a high-conviction view (that India’s digital trajectory will continue upward) while mitigating single-stock risk. In essence, instead of trying to predict the one next giant, the basket lets you own the wave itself.
Another important aspect is how we construct and manage this basket. We follow a disciplined, rules-driven process:
In practice, this strategy delivers three key benefits:
This is why the Niveshaay TechStack is designed with a multi-year horizon (around 3–5 years or more). India’s digital buildout moves in waves, and the most meaningful returns tend to accrue to investors who remain positioned through the adoption curves, rather than jumping in and out based on short-term cycles.
What started in the dial-up days as a curiosity has evolved into a multi-layered ecosystem that’s driving India’s economy, creating jobs, and reshaping daily life. As we look ahead, it’s clear that India’s digital transformation is still in its early days of compounding. The country’s digital stack – from telecom networks to AI-powered services – will continue to be a game-changer for businesses and consumers alike. Each of the four waves we discussed has already created tremendous investment opportunities, and new waves will undoubtedly emerge as technology advances.
For investors, the message is simple: don’t miss out on India’s digital revolution. Just as the last decade rewarded those who bet on India’s rising consumer class, the coming decade could belong to those who bet on India’s digital and technological prowess. The Niveshaay TechStack offers an exciting, convenient way to get on board with this theme – it lets you own the pillars of India’s digital future in one portfolio. By investing in the key drivers of the digital economy, you position yourself to benefit from long-term growth as the nation scales its digital infrastructure and services.
The momentum is building – from the days of cyber cafés and missed calls to today’s AI-powered apps, India has leapfrogged into an era of unprecedented connectivity and innovation. The opportunity to participate in this growth story is here and now. The train is leaving the station, and with a thoughtful investment approach, you can be on it rather than watching from the sidelines. In investing, as in the internet, catching an S-curve early can make all the difference. India’s digital S-curve is underway – make sure your portfolio isn’t logging in late!
BSE Approval No : BSE/RA/ADVT/04022026-6276/01
Disclaimer:
Investment in securities market is subject to market risks. Read all the related documents carefully before investing.
Registration granted by SEBI, enlistment as RA and certification from NISM in no way guarantee performance of the intermediary or provide any assurance of returns to investors.
The securities quoted are for illustration only and are not recommendatory.
NIVESHAAY INVESTMENT ADVISORS
Trade Name: NIVESHAAY INVESTMENT ADVISORS
SEBI Registered Research Analyst Registration No. INH000017338, BSE Enlistment No. 6276 (Type of Registration- Non-Individual, Validity of Registration- Perpetual)
Website: https://niveshaay.com/
Address: Office no. 508, 5th floor, SNS platina opposite shrenik residency, Near OM Sai Row house Vesu Surat Gujarat 39500
Contact No: 7859870559, Email: research@niveshaay.com
SEBI regional/local office address – SEBI Bhavan, Western Regional Office, Panchvati 1st Lane, Gulbai Tekra Road, Ahmedabad – 380006, Gujarat
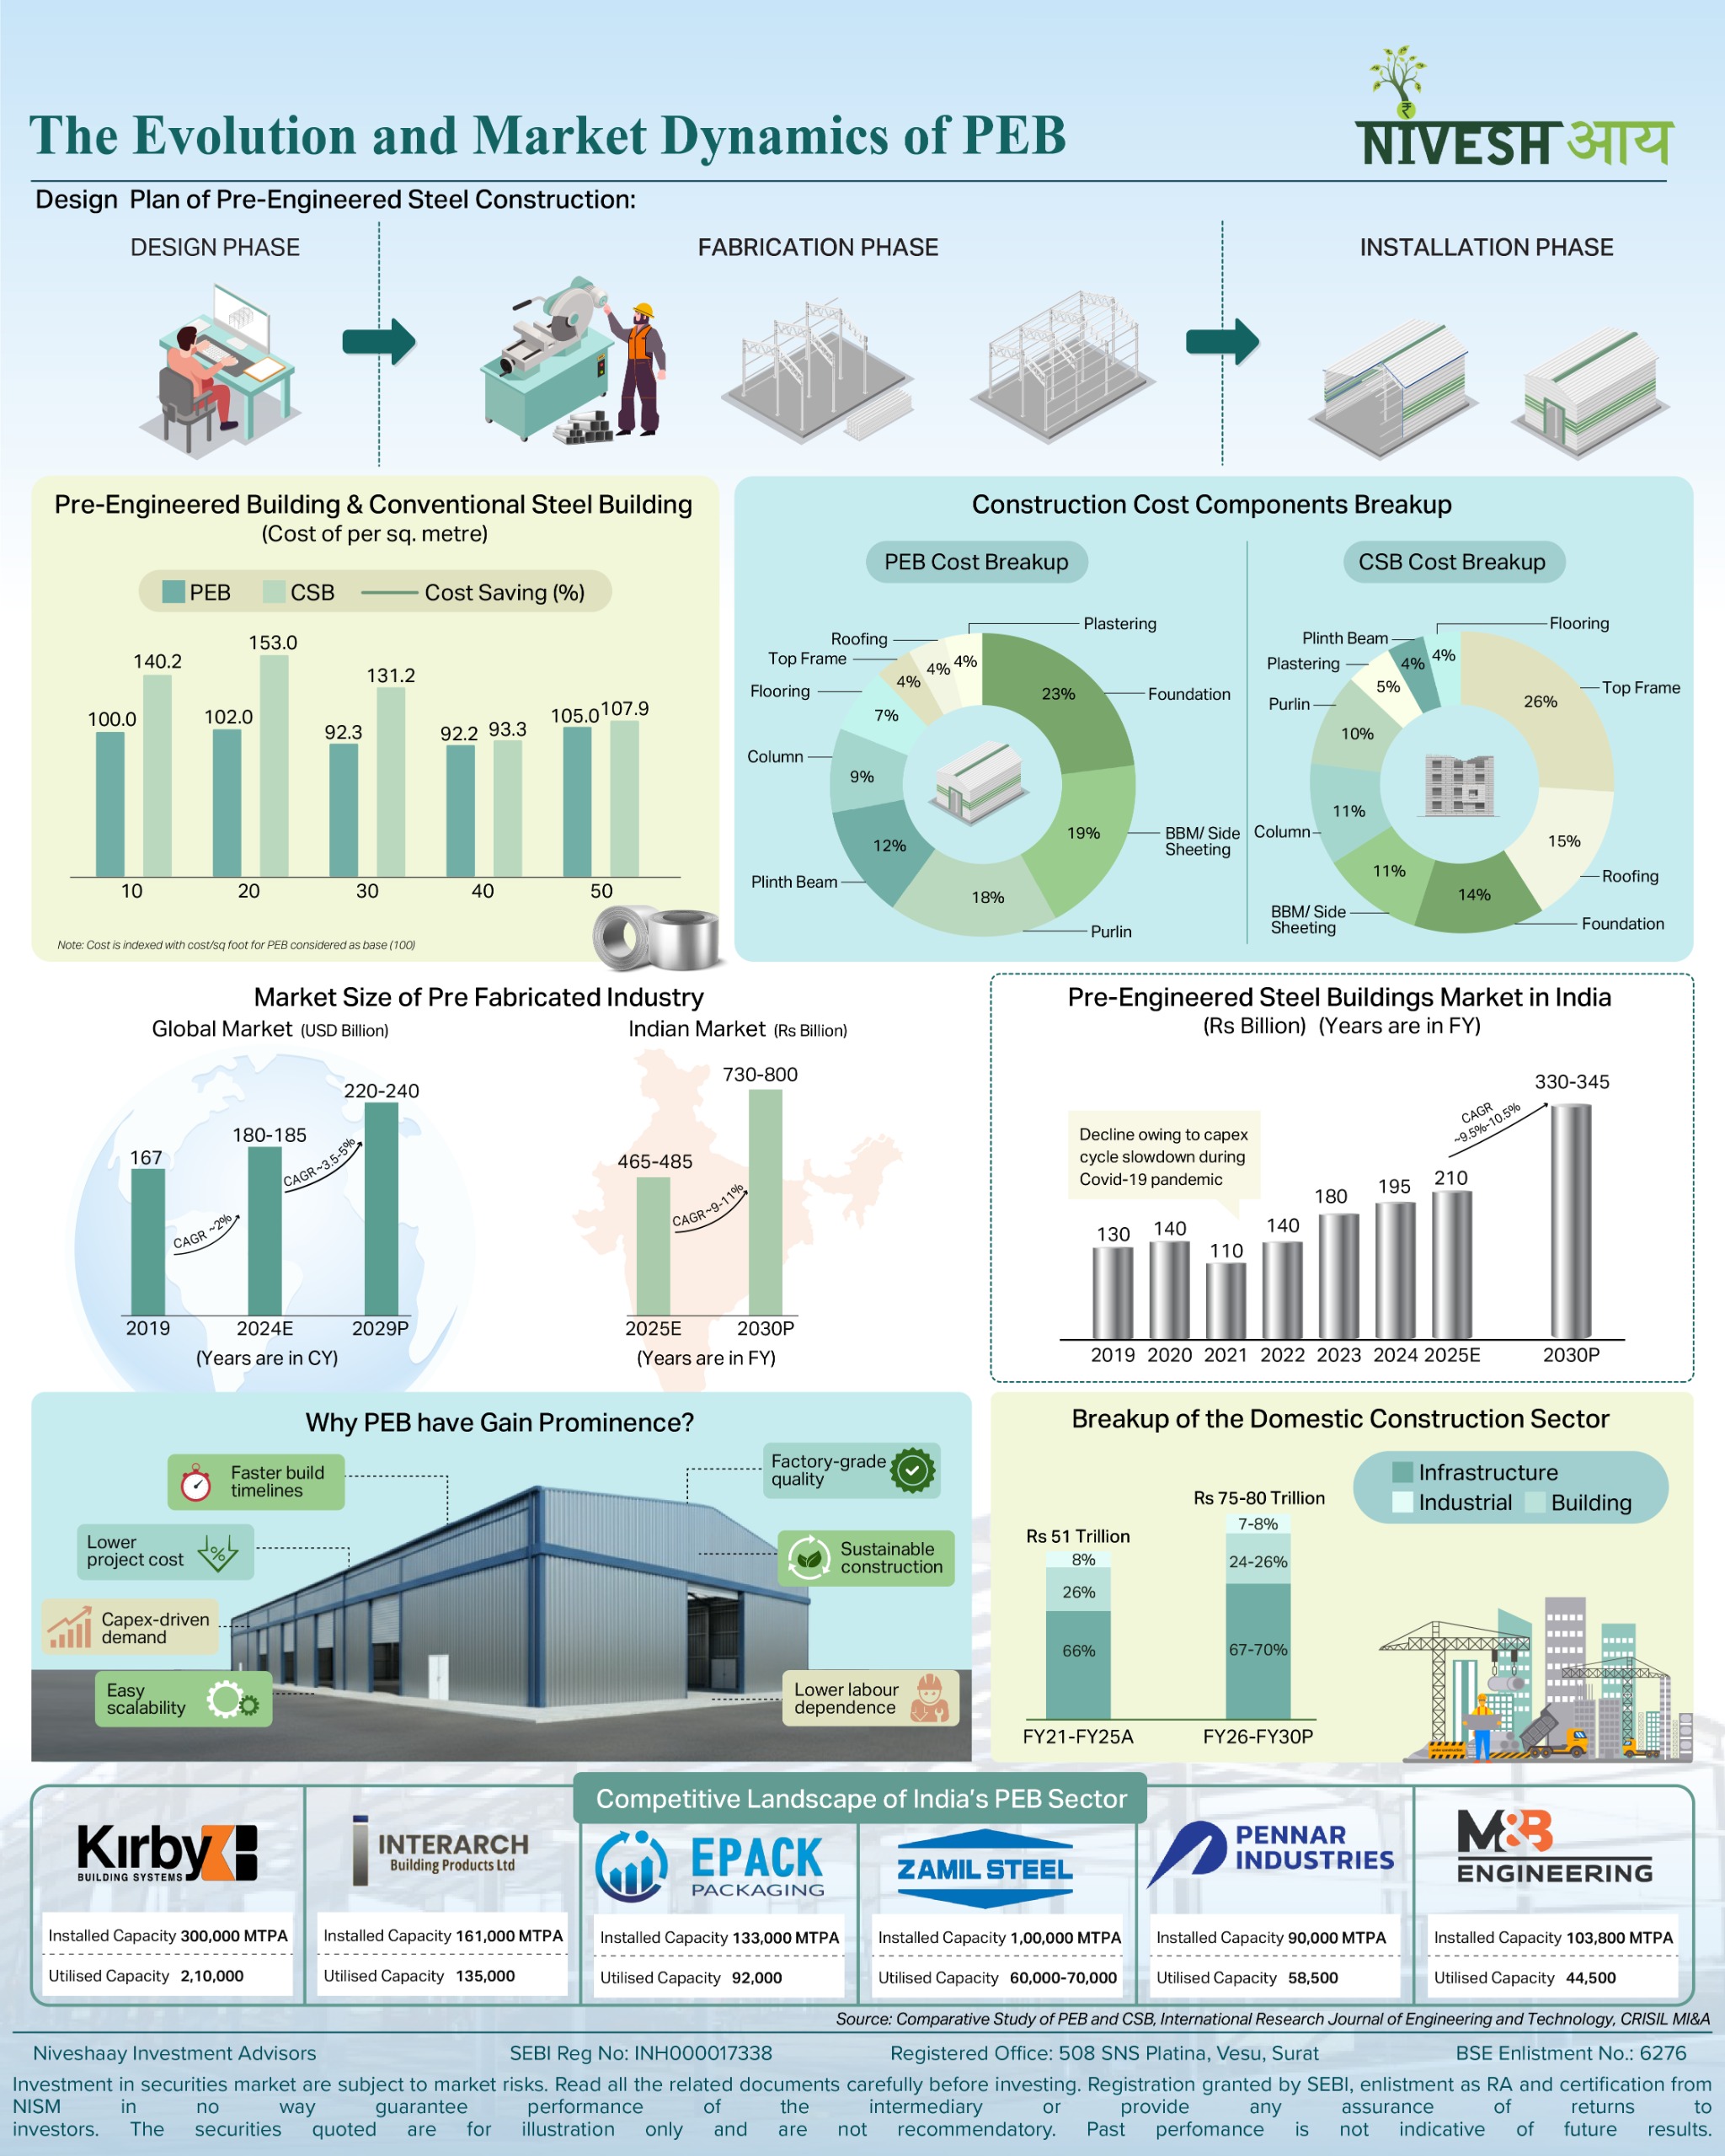
Capital Goods & Engineering
The Evolution and Market Dynamics of PEB
Pre-Engineered Buildings (PEB) are quietly reshaping how India builds its industrial backbone. By shifting construction from the site to the factory floor, PEB brings speed, precision, and predictability to a process that was once slow and capital-heavy 🏗️⚙️
Pre-Engineered Buildings (PEB) are quietly reshaping how India builds its industrial backbone. By shifting construction from the site to the factory floor, PEB brings speed, precision, and predictability to a process that was once slow and capital-heavy 🏗️⚙️
The Indian PEB market is projected to grow by ₹800 billion by FY 2030, driven by rapid expansion across warehousing, manufacturing, and logistics — sectors where time-to-operational readiness directly impacts competitiveness 📦📈
In a country racing to modernise its supply chains, PEB isn’t just a construction upgrade. It’s a structural advantage.
👉To know more about how PEB is reshaping industrial India, explore our blog —https://niveshaay.com/blog/building-fast-scaling-faster-indias-peb-multi-billion-dollar-opportunity/

Electronic Manufacturing Services
Building Fast, Scaling Faster: India’s PEB Multi-Billion Dollar Opportunity
The future of India’s heavy infrastructure is no longer defined by the slow, unpredictable rhythm of conventional construction sites, but by the precise, controlled pace of the factory floor a fundamental revolution is sweeping through the sector, fueled by an aggressive national drive for industrial and logistical scale.
The future of India’s heavy infrastructure is no longer defined by the slow, unpredictable rhythm of conventional construction sites, but by the precise, controlled pace of the factory floor a fundamental revolution is sweeping through the sector, fuelled by an aggressive national drive for industrial and logistical scale.
Pre-Engineered Building systems represent this structural transition, offering asset owners a strategic imperative for speed, efficiency, and predictability by migrating the complexities of structural fabrication into a quality-controlled environment.
Product Overview
Pre-engineered steel construction has emerged as an innovative building method due to the rapid growth of automation in the construction industry. Furthermore, a shortage of skilled labour, combined with the inherent advantages of these structures in terms of speed, cost-effectiveness, and environmental impact, is significantly propelling their popularity in the construction sector.
There are many different steel structures, to get a better understanding of this product and construction solution let us understand different types of steel structures:
Components of PEB
Global PEB Market Overview
The pre-engineered buildings market is to be valued at USD 23.75 Bn in 2025 and is expected to reach USD 48.08 Bn by 2032, growing at CAGR of 10.6% from 2025 to 2032 with increasing industrial and commercial construction activities across both developed and emerging economies, the demand for pre-engineered buildings is growing significantly.
This trajectory reflects rising demand for cost-effective construction models as organizations confront extended lead times and labour shortages. The sector’s momentum is driven by standardization of high-strength materials, rapid assembly methods, and the adoption of advanced digital tools that increase project accuracy and reduce waste.
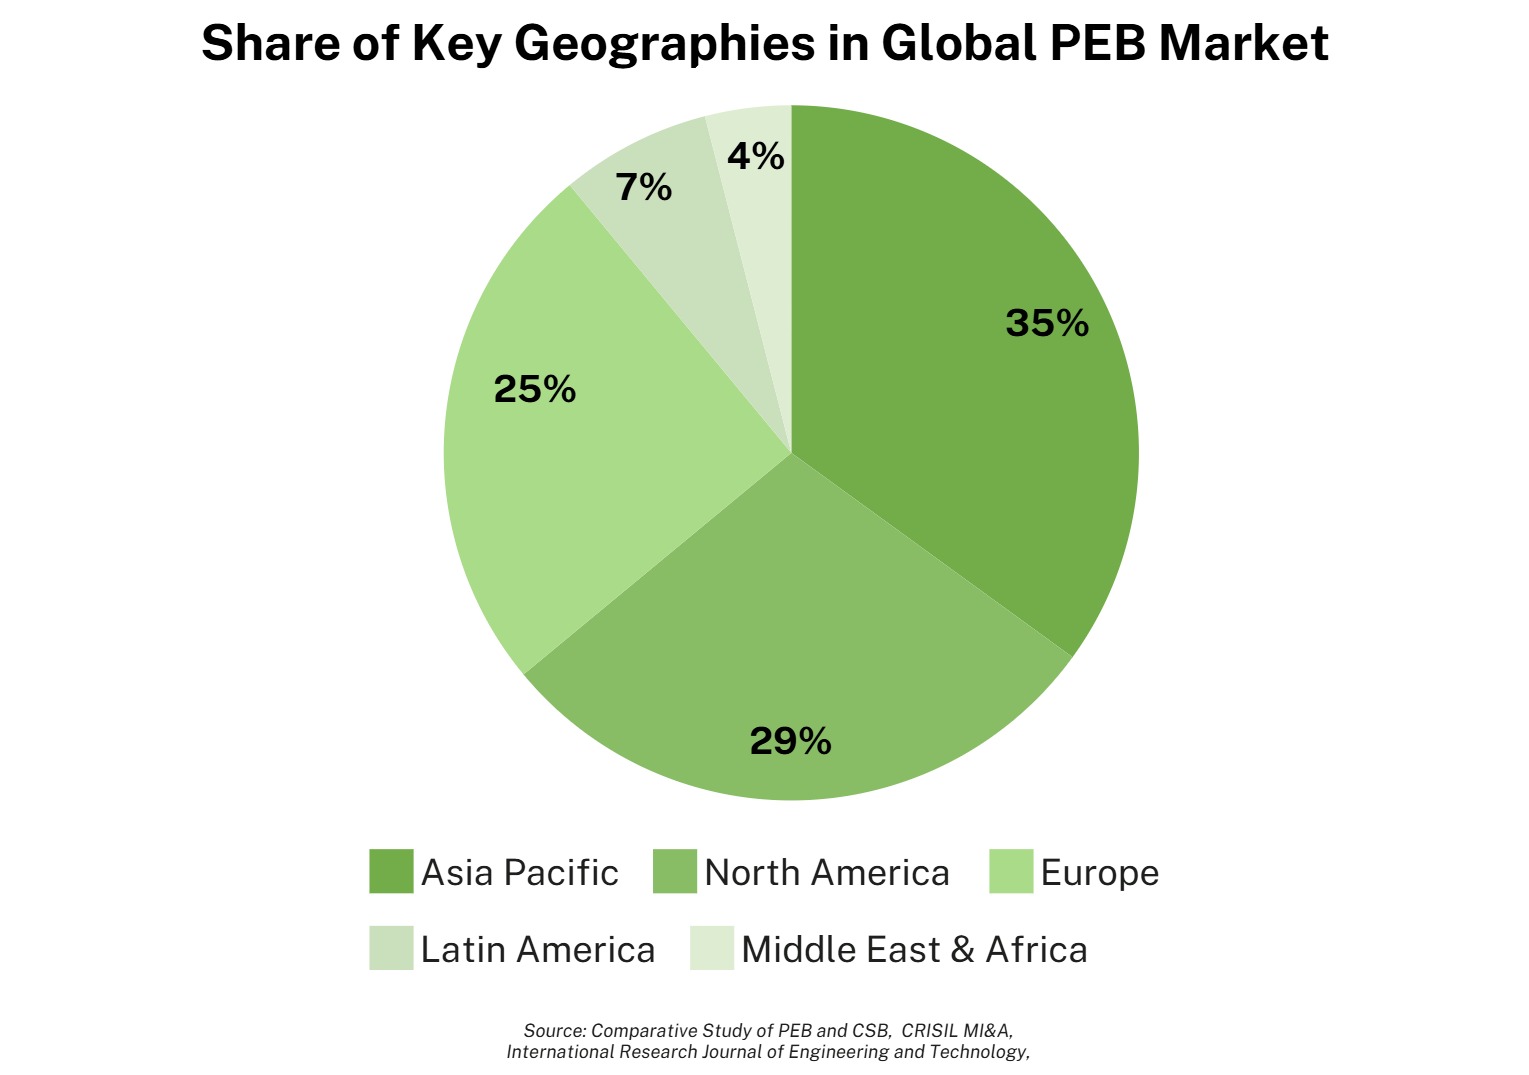
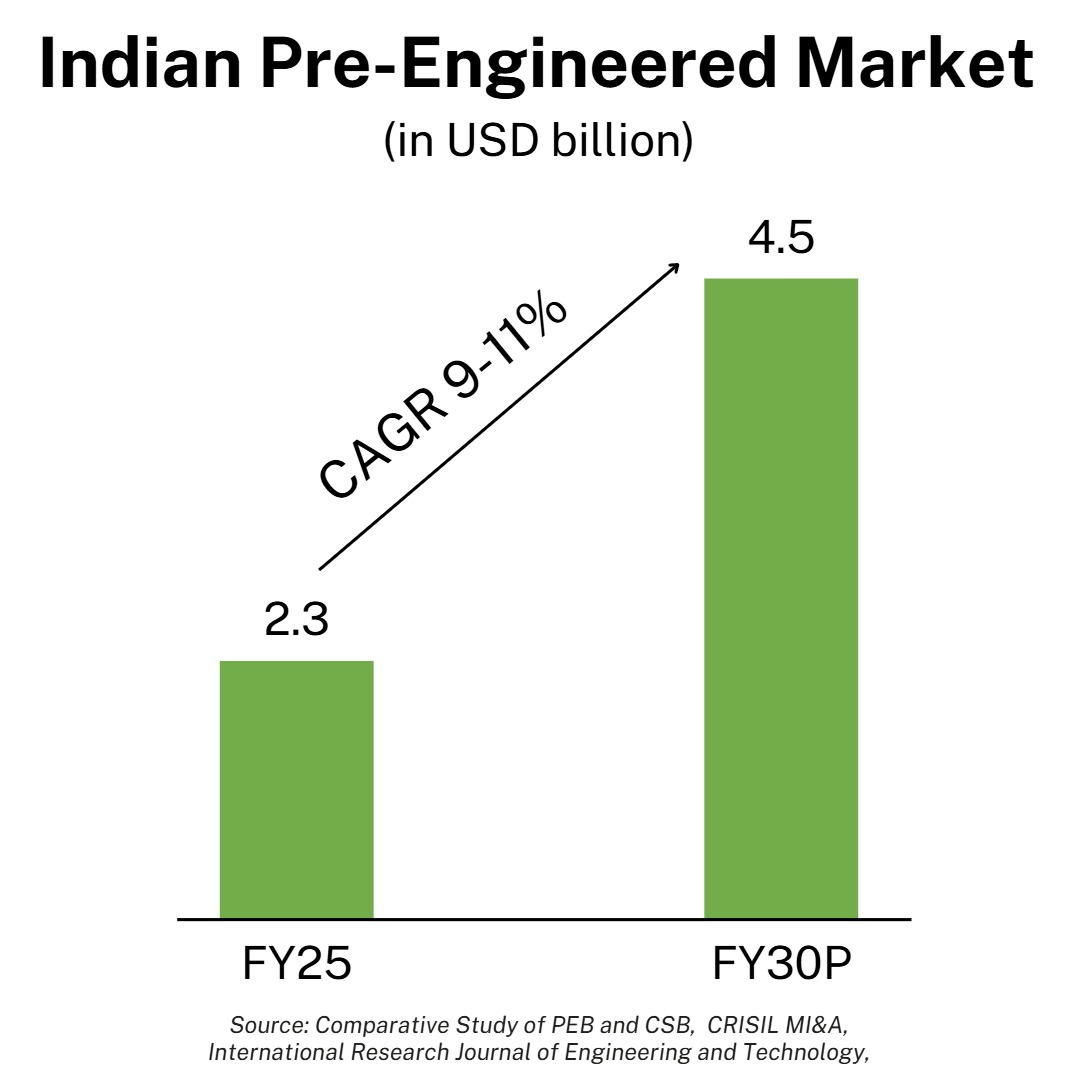
Indian PEB Market Snapshot
The Pre-Engineered Building (PEB) industry in India is transitioning from a niche construction alternative to a fundamental structural imperative, driven by an accelerating national capital capex cycle. The broader Indian construction sector is projected to grow robustly at 6–8% in fiscal year 2026, largely fuelled by aggressive infrastructure investments. As of FY25, the Indian prefabricated market is around USD 2.3 billion and moving forward, the industry is projected to register a CAGR of 9-11% between FY25-30 and value around 4.5 billion by FY30.
Organised players in India account for about 40-45% of the total PEB market, with the remaining share held by small, unorganised local players. The top six organised players contribute 80-85% of the organised sector’s market share.
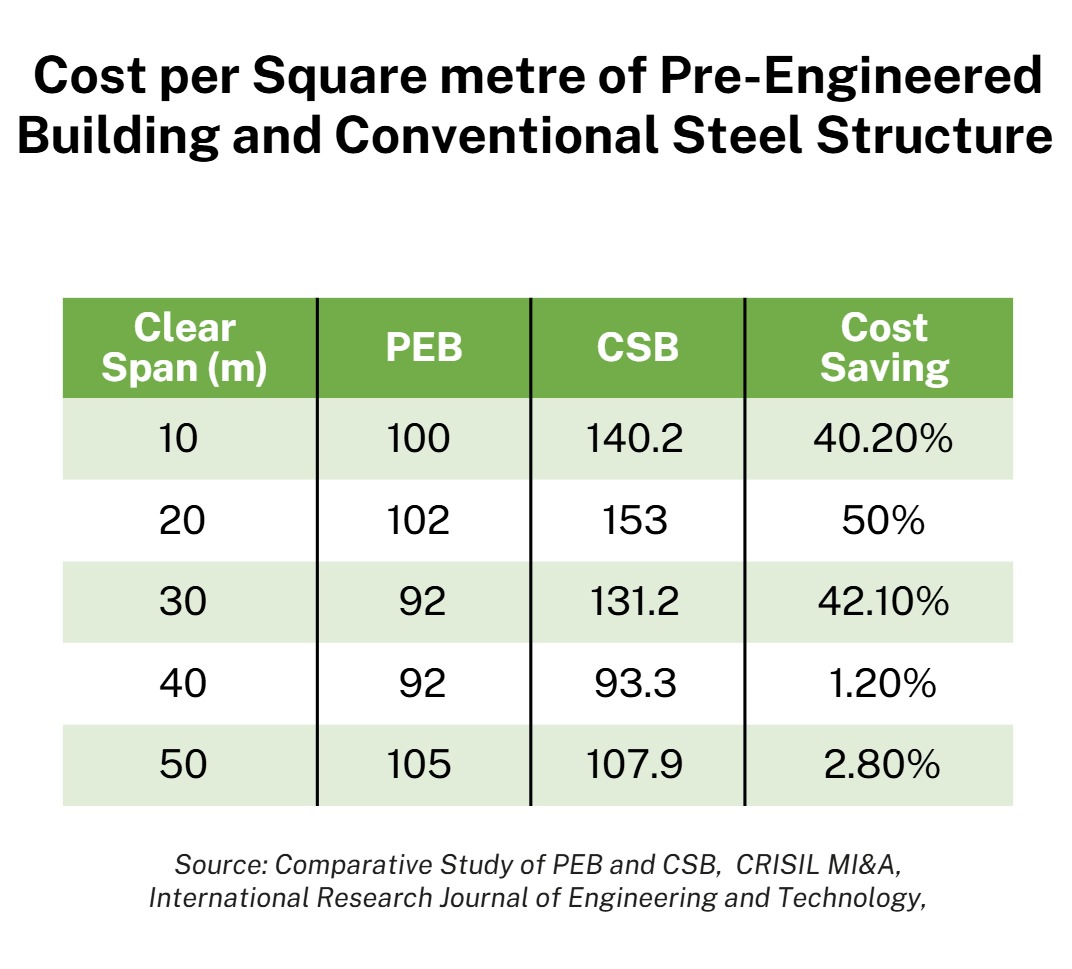
Quantifying the Speed and Initial Cost Advantage
PEB construction methods offer a substantial time-to-market advantage, generally enabling 30–50% faster project execution compared to equivalent RCC structures. For a standard 10,000 square foot warehouse, the PEB method can achieve completion in 2.5 to 3 months, whereas an RCC structure might require six to nine months. Furthermore, for large-scale, low-rise industrial and commercial structures, PEB is often 30–40% cheaper than traditional RCC methods.
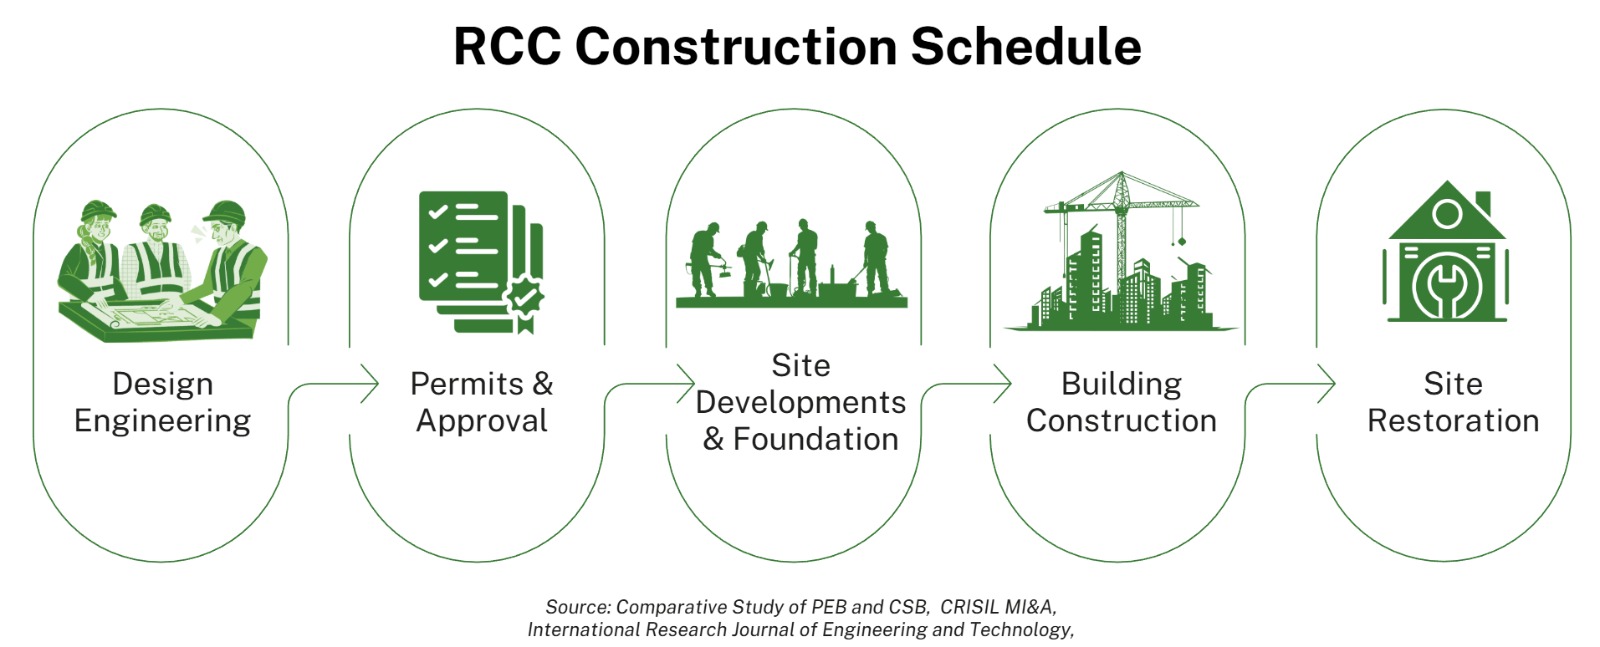
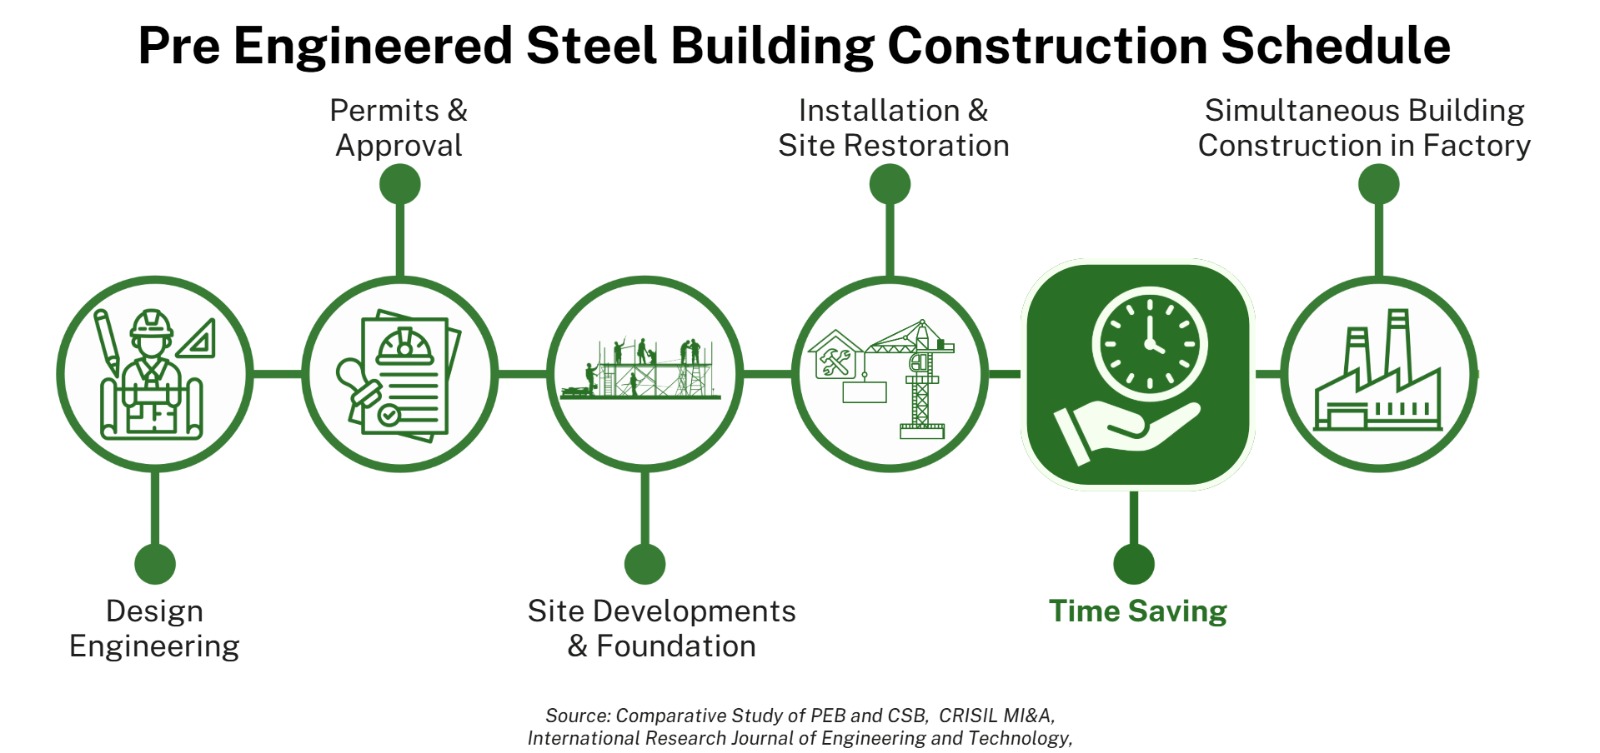
Growth Driver and Accelerator for PEB Industry
The rising adoption of green and sustainable buildings, combined with the need for faster project execution and lower material wastage, is accelerating the shift towards Pre-Engineered Buildings (PEBs). This trend is further reinforced by high-growth end-use sectors such as semiconductor fabrication units, hyperscale data centres, cold storage and quick-commerce warehousing, where speed of construction, design flexibility, and scalability are critical.
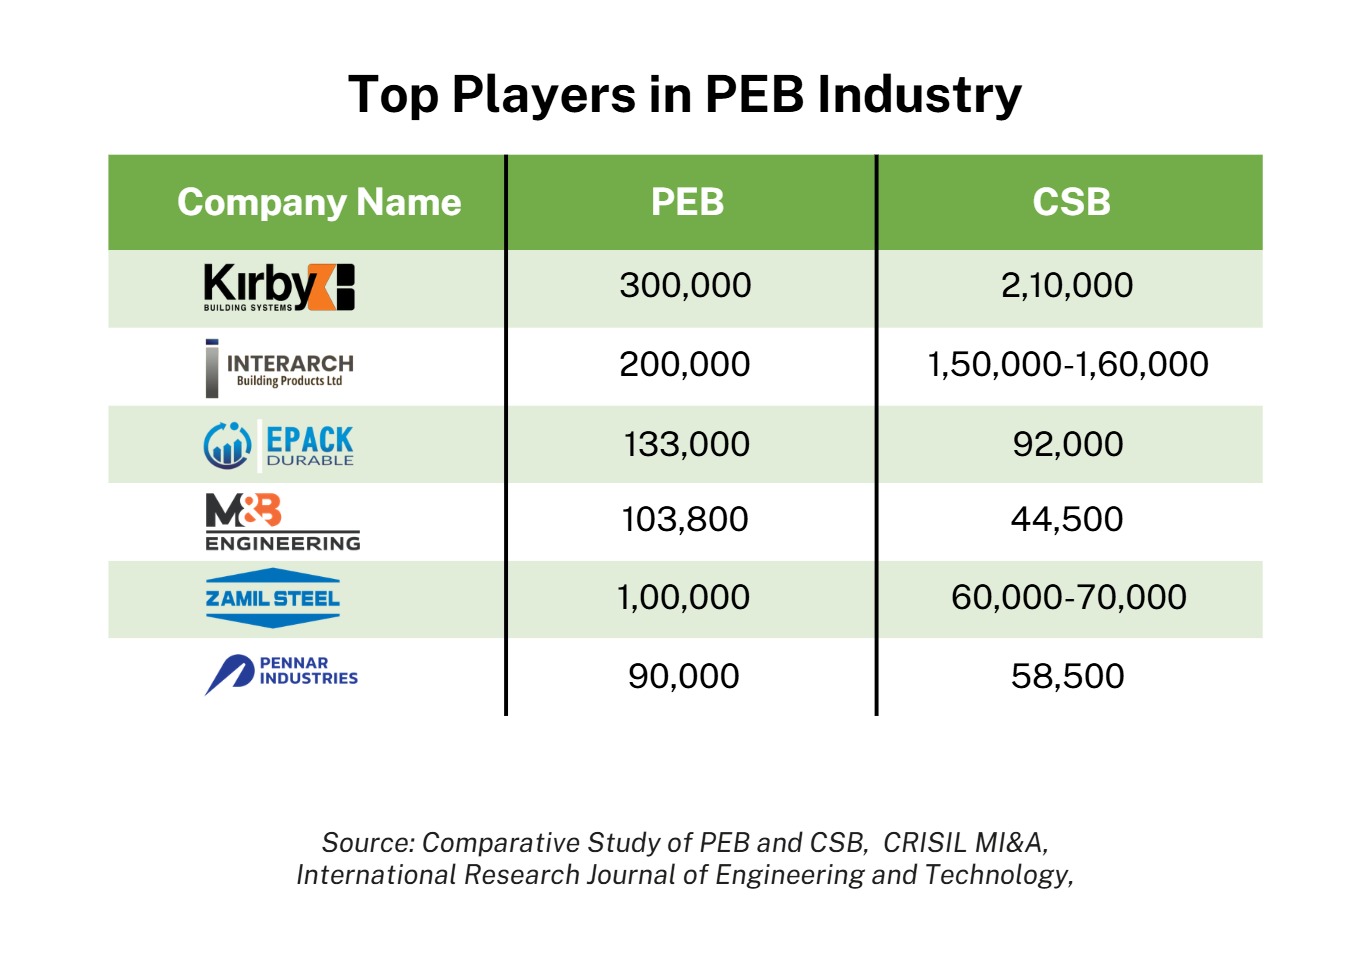
Conclusion
The structural factors driving the adoption of Pre-Engineered Buildings—namely the need for accelerated construction timelines, verifiable cost savings, and long-term economic superiority over RCC—suggest that the industry transition is largely irreversible. PEB is rapidly moving from an industrial niche to the default solution for logistics, data infrastructure, and large-scale manufacturing facilities.
The path toward the ambitious valuation will be defined by two strategic imperatives. First, organized players must continue strategic investment in advanced fabrication automation and capacity expansion, transforming current scale into a protective moat against competition. Second, success will hinge on the ability to integrate value-added, specialized services—such as smart building technology, advanced insulation, and hybrid structures—to meet the sophisticated, high-specification demands of fast-growing sectors like data centres and advanced manufacturing. The high-capacity, vertically integrated market leaders are optimally positioned to capture the exponential growth driven by India’s infrastructure ambitions.
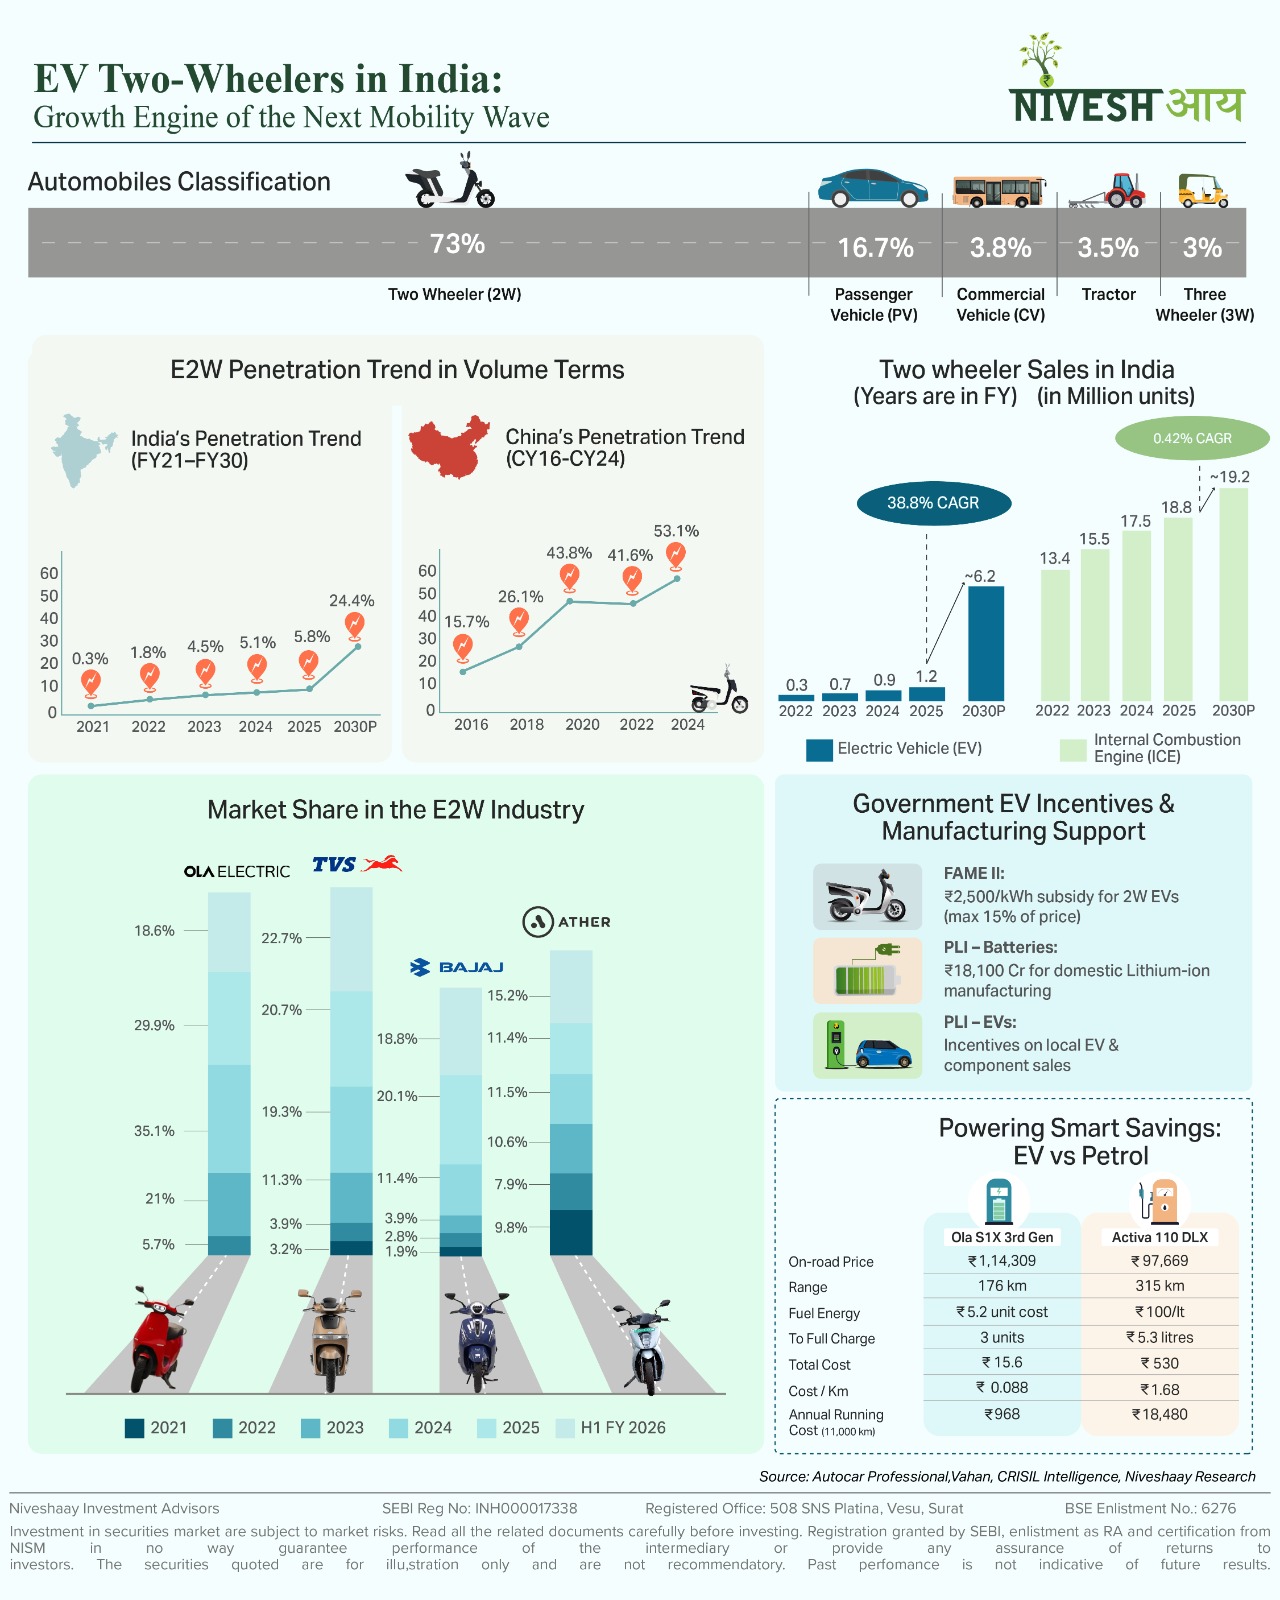
Electric Vehicle & Ancillaries
EV Two-Wheelers in India: Growth Engine of the Next Mobility Wave
India’s electric two-wheeler market is entering a structurally stronger phase of growth.⚡🛵 Penetration is rising steadily, supported by improving product quality and expanding distribution.🛠️Leading OEMs are scaling faster by strengthening execution and adding capacity, supported by policy tailwinds and domestic manufacturing.🏭
India’s electric two-wheeler market is entering a structurally stronger phase of growth.⚡🛵
Penetration is rising steadily, supported by improving product quality and expanding distribution.🛠️Leading OEMs are scaling faster by strengthening execution and adding capacity, supported by policy tailwinds and domestic manufacturing.🏭
With EV running costs meaningfully lower than petrol, adoption is becoming more “math” than “hype.”✅
For deeper insights, check out our detailed blog here.
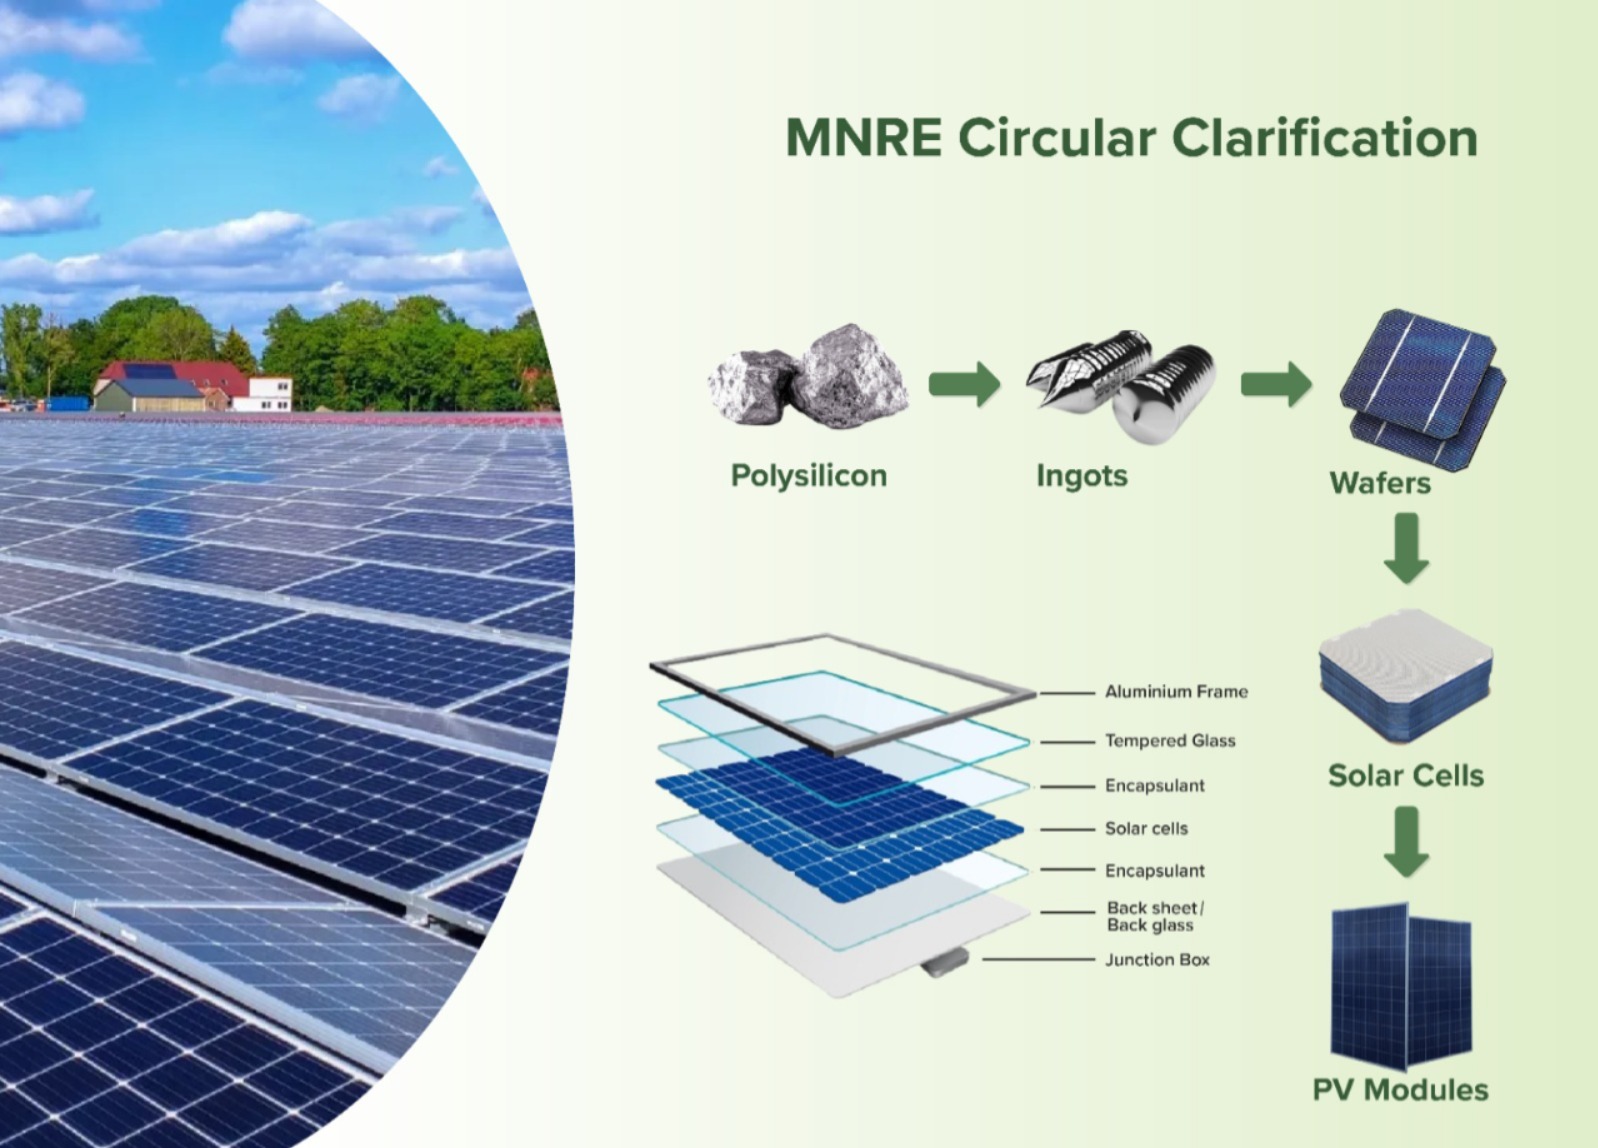
Electric Vehicle & Ancillaries
India’s Solar Manufacturing: Clarification on recent MNRE circular
The Extraordinary Growth Story: India's solar expansion over the past decade has been extraordinary. India had just 4 GW of installed solar capacity 10 year ago.
The Extraordinary Growth Story
India’s solar expansion over the past decade has been extraordinary. India had just 4 GW of installed solar capacity 10 year ago. Today, it stands at ~132.8 GW, making India the world’s third-largest solar nation after China and the United States. But manufacturing has grown even more aggressively. India’s module manufacturing capacity has risen from ~2.3 GW in 2014 to ~74 GW by March 2025. This is expected to cross ~110 GW by March 2026 and approach ~215-220 GW by 2028. This explosive capacity addition, while impressive on paper, could lead to a significant mismatch- expected to create distress in the market.
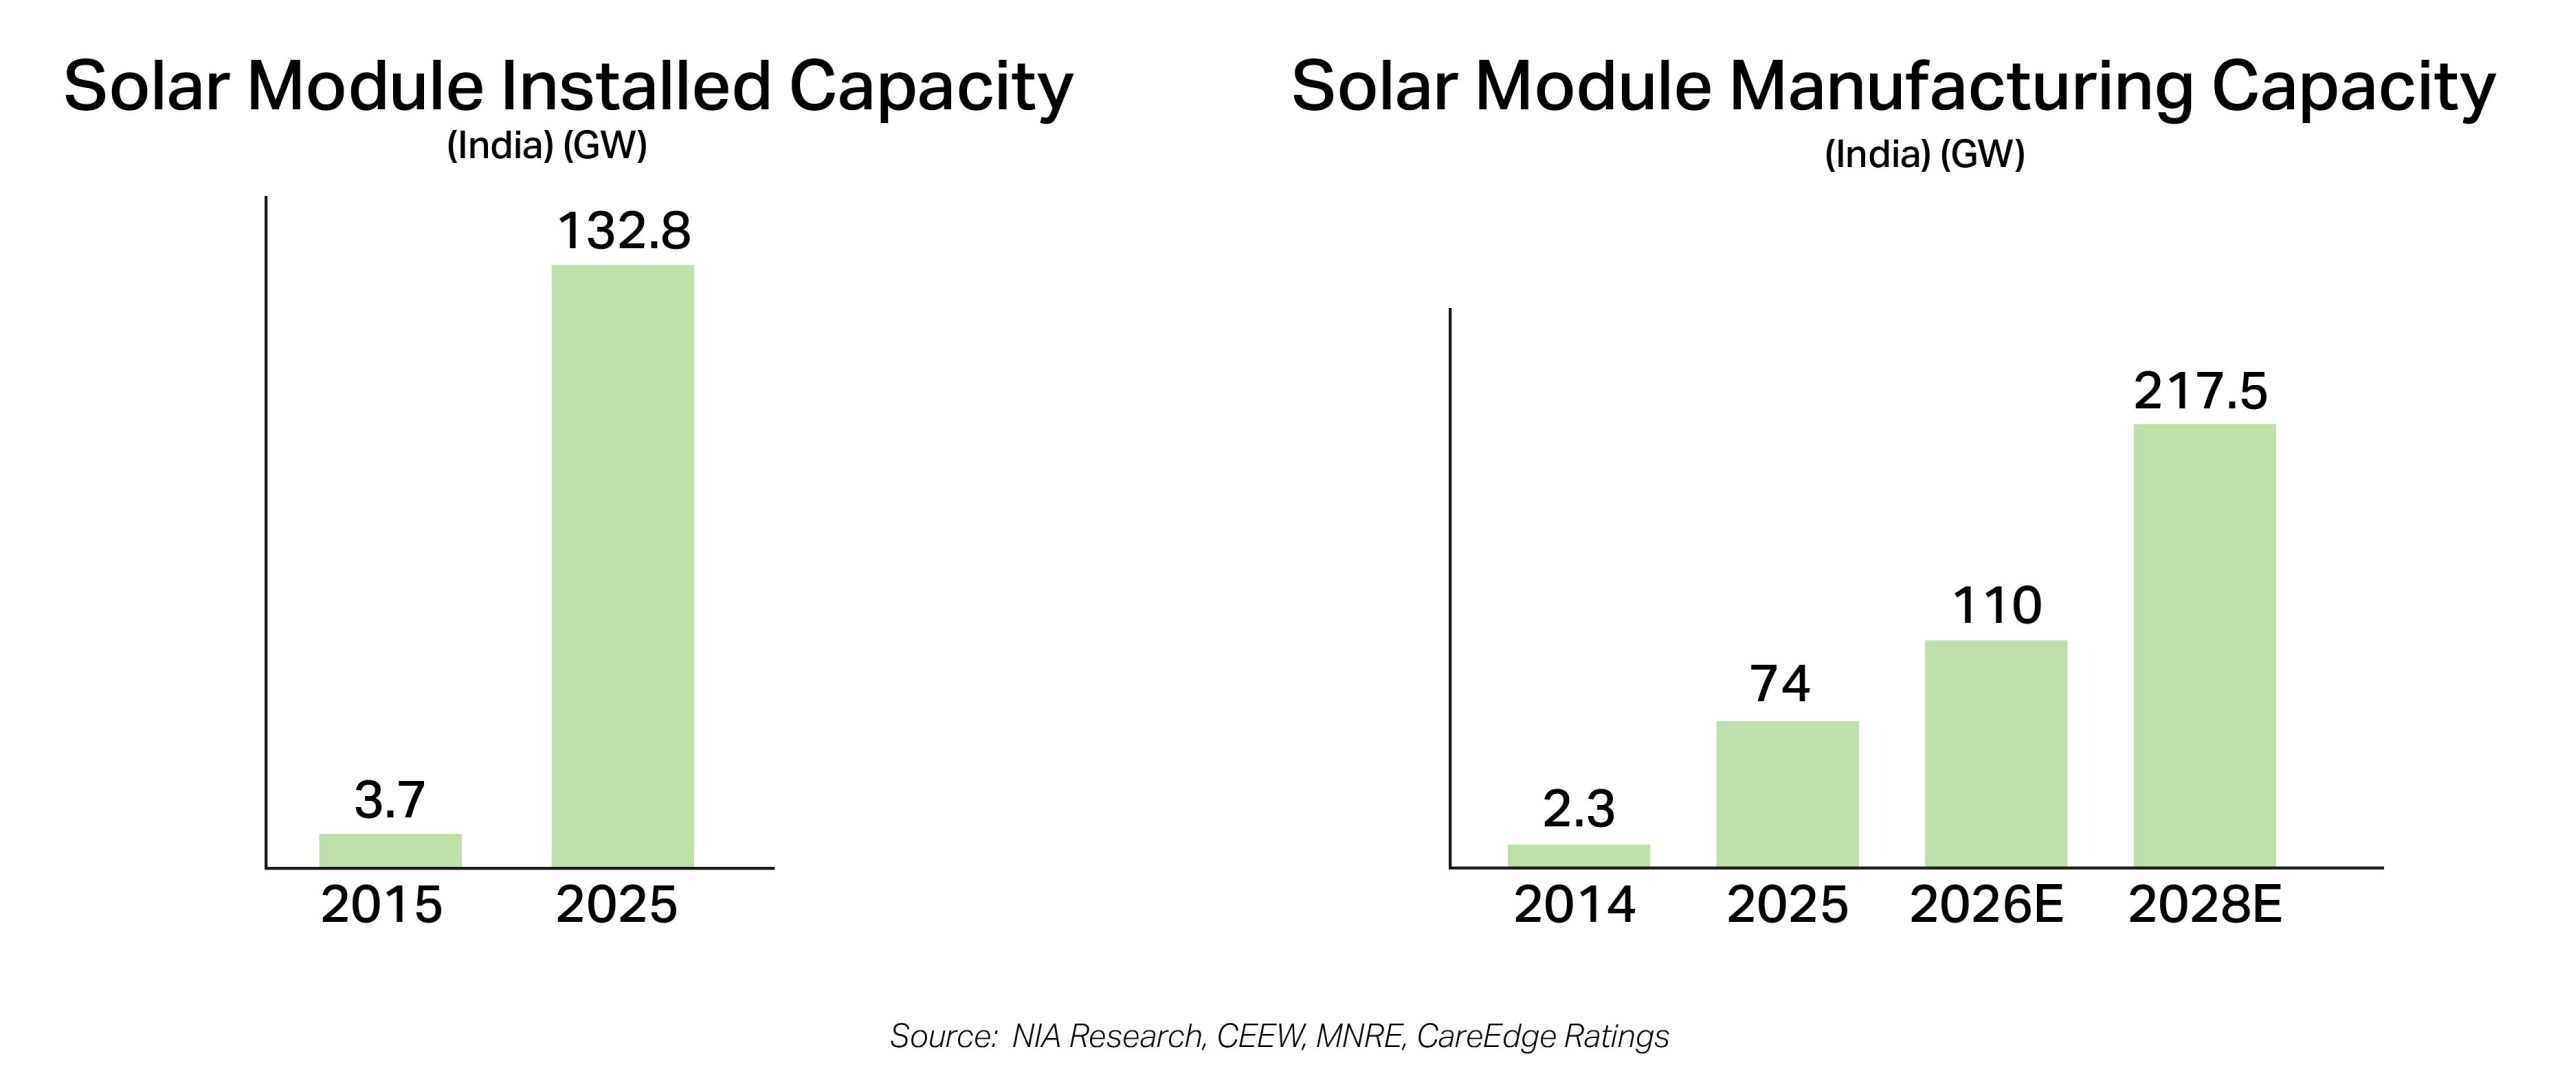
The solar journey for us has been equally exciting — particularly backing industry leaders during their ramp-up phase, where favourable policies and superior economics drove exponential growth. As with any high-growth sector, strong profitability inevitably invites capacity expansion. Over the past year, we have consistently highlighted that standalone module manufacturers will come under pressure as numerous smaller capacities enter the market, intensifying competition and setting the stage for industry consolidation.
In such a landscape, niche, lower-competition integrated and component players — notably solar glass manufacturers — are well positioned to benefit as module capacities expand and the ecosystem shifts toward grid stabilisation and energy storage. With robust cash flows, scale, and disciplined capital allocation, they are best placed to outperform and sustain leadership as the solar industry continues on its strong structural growth trajectory.
The Confusion: What Did MNRE Actually Say?
Recent weeks saw considerable confusion in the renewable market following reports that the MNRE had recommended NBFCs halt lending to the renewable energy sector due to overcapacity concerns. The ministry quickly issued a clarification, stating there has been no advisory to Financial Institutions for stopping lending to either renewable energy power projects or to renewable energy equipment manufacturing facilities.
However, the clarification revealed something more nuanced and strategically important for the industry as well as the investors. MNRE confirmed it had shared information about domestic manufacturing capacities with the Department of Financial Services and institutions like PFC, REC, and IREDA. It emphasized that it is not retreating from renewable energy—it is encouraging smarter capital deployment toward difficult-to-replicate parts of the value chain rather than being limited to financing solar module manufacturing alone.
This includes upstream manufacturing (cells, wafers, polysilicon) and critical components (solar glass, frames, backsheets, junction boxes) where India needs to build capability. This is not a blanket warning on solar—it is a targeted message about where overcapacity exists and where investment is still needed.
The Reality of Overcapacity: Uneven Impact
Large players like Waaree, Adani, Premier, Vikram, etc continue to run at about 80–85% capacity. But many smaller manufacturers are struggling to utilize even 20–25% as they face higher inventory losses and weaker margins. Clients of module-only players are leveraging the oversupply and minimum product differentiation to negotiate aggressively.
While modules face severe overcapacity, upstream segments present a fundamentally different picture. Manufacturers with strong balance sheets, and deeper integration spanning cells, ingots, and wafers, are relatively better placed as they can absorb volatility in any single segment. Integrated players are able to control costs, achieve economies of scale and invest in technological upgrades while smaller players struggle to keep plants running.
The Indian government’s push to backward integrate creates both pressure and opportunity—but these segments have not seen an aggressive capacity addition as modules. The reason is straightforward: capital intensity and technical complexity. CAPEX per GW for each integration can be Rs. 500-600cr versus Rs. 100cr for only-modules. Beyond the capital requirement, these are technically challenging, involving significant complexity that creates natural entry barriers. The supply-demand dynamics here remain far more balanced, protecting margins and creating sustainable business models for players with required technical capabilities.
We believe 6-7 large industry players who are able to vertically and horizontally integrate will ultimately hold scale advantages, with rest of the players expected to consolidate or shut down by end of the decade.
The Component Story: Strategic Chokepoints in the Value Chain
MNRE’s clarification specifically mentioned solar glass and aluminium frames as areas where lending should be expanded, recognizing these as strategic components were domestic capacity needs development. This is not coincidental—components represent the parts of the value chain where India still has significant import dependence and where technical barriers provide natural protection against overcapacity.
The consolidation in modules doesn’t eliminate component demand—it concentrates it among stronger, more creditworthy players. Consider Borosil renewables, one of our investee companies and a solar glass player. Unlike modules, solar glass manufacturing and stabilization take considerable time to set up. The technical challenges of preparing consistent quality glass mean capacities will not come online quickly despite increase in domestic demand. This barrier creates a natural protection against the kind of rapid overcapacity seen in modules.
The government’s push to protect domestic component manufacturers through anti-dumping duties would further strengthen their competitive position. Borosil supplies product to multiple customers maintaining bargaining power as compared to manufacturers competing in an oversupplied end-product market.
Our View
The module overcapacity will coexist with opportunities in upstream and specialised component manufacturers who occupy strategic, hard-to-replicate positions in the supply chain and will emerge stronger from this consolidation. Even these players will face near-term margin pressure as overcapacity works through the system but the long-term theme remains intact. Success requires differentiation—identifying players with technical moats, capital advantages, and positions in supply-constrained segments rather than commoditized, oversupplied ones.
The Indian solar manufacturing story is maturing. The module segment’s overcapacity is real and will drive painful consolidation, but this is a natural evolution, not a crisis. India’s solar story remains compelling, but returns will accrue only to those positioned in the right parts of the value chain—where sustainable economics prevail over structural headwinds.

Electric Vehicle & Ancillaries
E2W Industry Landscape: A Comparative Look at China and India
The global Electric Two-Wheeler (E2W) market is undergoing a transformation, driven by advances in technology, rising fuel costs, and environmental concerns. E2Ws offer an attractive solution for short-distance commuting, with lower operational costs, minimal emissions, and ease of maneuverability.
The global Electric Two-Wheeler (E2W) market is undergoing a transformation, driven by advances in technology, rising fuel costs, and environmental concerns. E2Ws offer an attractive solution for short-distance commuting, with lower operational costs, minimal emissions, and ease of maneuverability. The market’s expansion is further fueled by government policies and incentives focused on reducing carbon footprints and improving air quality in urban areas.
While China has already established itself as the global leader in electric two-wheelers, India is rapidly catching up, leveraging its vast population and rising middle class, combined with an increasing push for sustainable mobility.
China’s E2W Penetration
China leads the global E2W market, with an estimated 78% share of the world’s total E2W sales. The country’s success in the electric two-wheeler market is underpinned by its massive production base, government incentives, and widespread adoption of lithium-ion batteries. The rise in urbanization, tightening environmental regulations, and the growing demand for efficient urban mobility options have all contributed to China’s dominance in the E2W space.
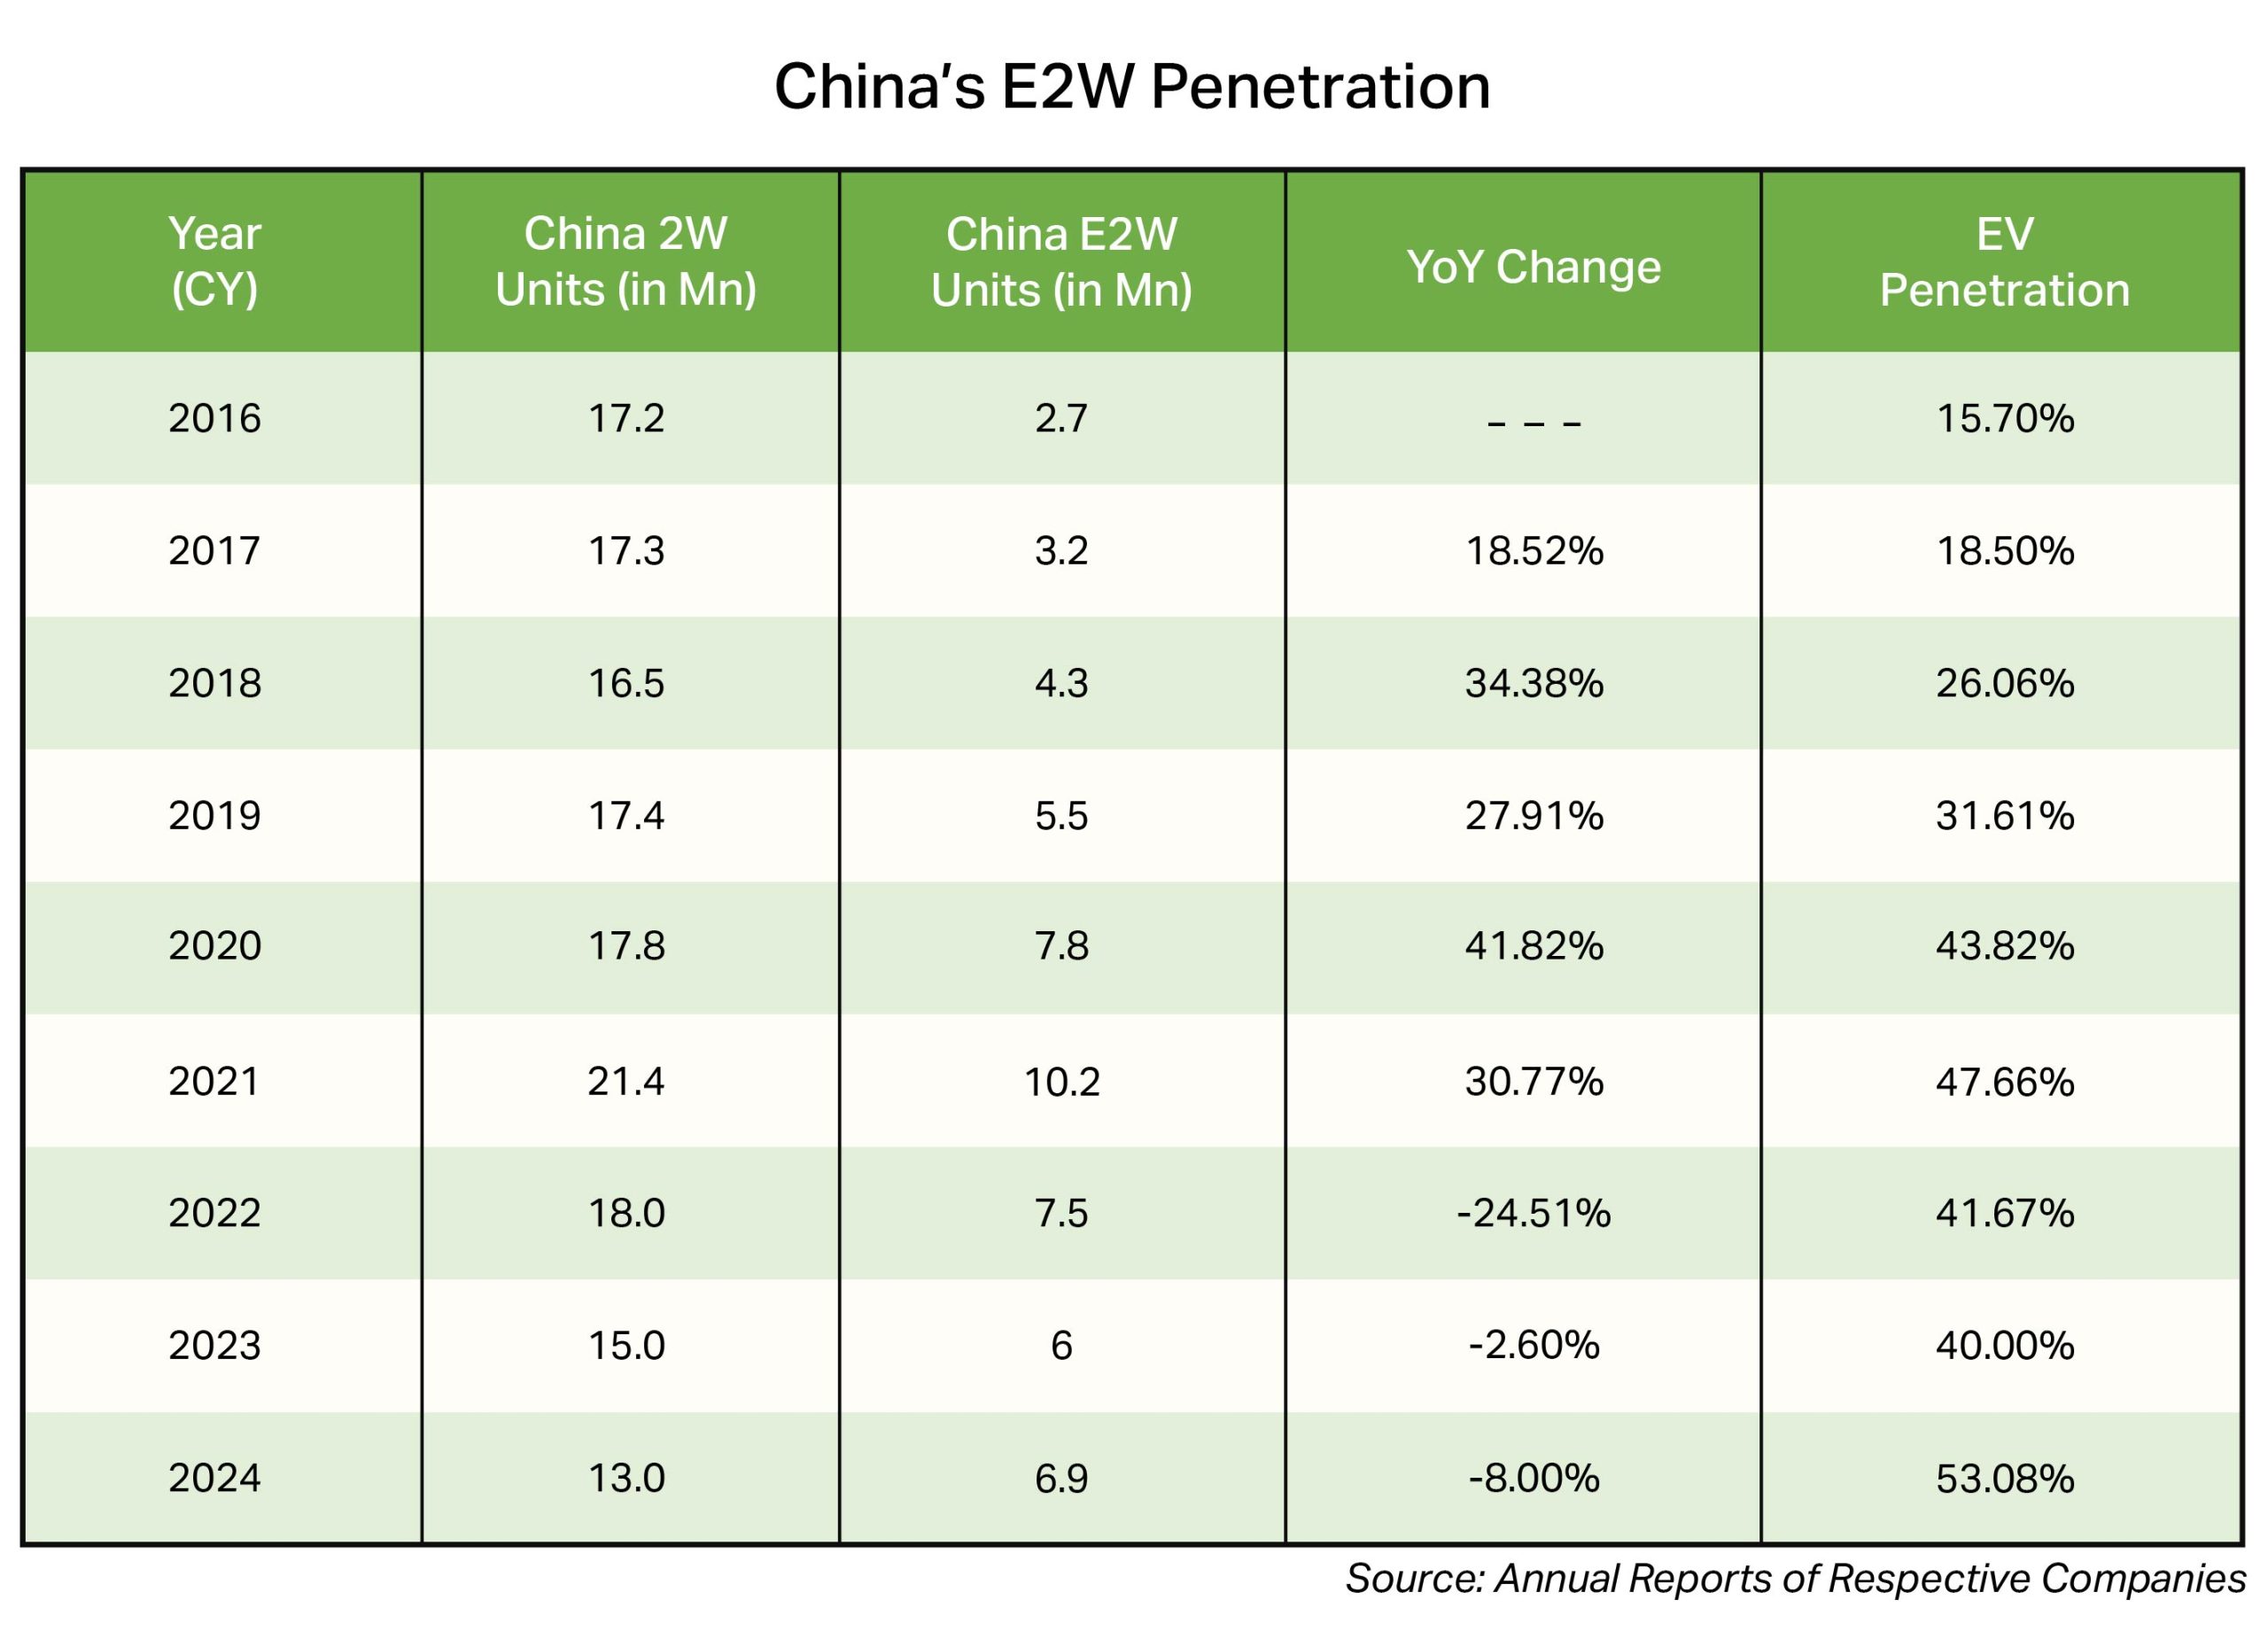
India’s E2W Landscape
India’s electric two-wheeler market is emerging rapidly, with sales growing from 28,000 units in FY19 to 1.15 million units in FY25. The country’s electric two-wheeler market penetration is expected to rise from ~5.8% in FY25 to ~25% by FY30, driven by government policy incentives, improved charging infrastructure, and the growing cost-efficiency of electric vehicles compared to internal combustion engine (ICE) vehicles.
Key Drivers for Growth:
Technology Backbone: Batteries, Chemistry Evolution & India’s Emerging Battery Ecosystem
At the heart of the E2W transition lies the battery, the single most important component that defines performance, cost, range, safety, and consumer confidence. Over the last 24 months, the industry has seen meaningful shifts in battery chemistry, manufacturing localisation, supply chain stability, and charging infrastructure—all of which are structurally accelerating adoption.
1) Battery Cost Reduction is the Biggest Driver of EV Adoption
Batteries comprise 35–40% of the cost of a two-wheeler EV. As battery prices fall globally and chemistries stabilise, OEMs (Original Equipment Manufacturers) can now build high-speed EVs at price points closer to ICE scooters.
Trends that matter are:
a) Sharp decline in global cell prices: Global lithium prices have corrected sharply since late 2023 due to higher supply from Australia, China & Africa. This has brought down cell prices from $135–140/kWh to $95–105/kWh, enabling OEMs to launch mid-range EVs in the ₹90,000–1,20,000 bracket—an important psychological threshold for Indian consumers.
b) Shift from NMC to LFP chemistry: India has begun transitioning from Nickel-Manganese-Cobalt (NMC) batteries to Lithium Iron Phosphate (LFP) for the mass-market segment.
The combination of lower cost + higher safety is removing the biggest buying hesitation for Indian consumers.
2) Technology Stability is Rebuilding Trust in EVs
The initial EV wave (2019–2022) was plagued with battery overheating, BMS issues, software failures, and inconsistent range. Over the last year:
Consumers are more confident buying EVs than two years ago. Technology stability is now a tailwind, not a barrier.
3) India’s Battery Ecosystem is Gradually Being Built: India has long depended on imported battery cells (mainly from China & Korea), this is now changing.
a) Cell manufacturing investments in India:
Within 3–5 years, India will have meaningful local capacity, reducing dependence on China.
b) Localisation of battery pack assembly:
Almost every major OEM (Ather, Ola, TVS, Bajaj, Hero) is now Assembling battery packs locally, Designing their own BMS and Signing long-term supply partnerships with cell supplier. This is improving unit economics and giving OEMs tighter control over quality.
The overall ecosystem is shifting from import + assembly to local design + partial localisation, and will move toward full-scale localisation in the next decade.
4) Charging Infrastructure Is Improving, Though Still Behind China
Charging remains a bottleneck, but India is progressing:
China remains the global benchmark, with dense, ultra-fast charging networks, but India is closing the gap faster than expected.
Why All This Matters: Faster Adoption Curve
The convergence of all the above factors – lower battery cost + more stable technology + emerging local ecosystem + improving charging infra is accelerating the adoption of electric two-wheelers.
This is particularly visible in mid-speed EVs around ₹1 lakh, where:
Competitive Landscape & Key Players
The Indian E2W market is competitive, with new players and established automotive giants investing heavily to capture market share. Key players in the Indian market include:
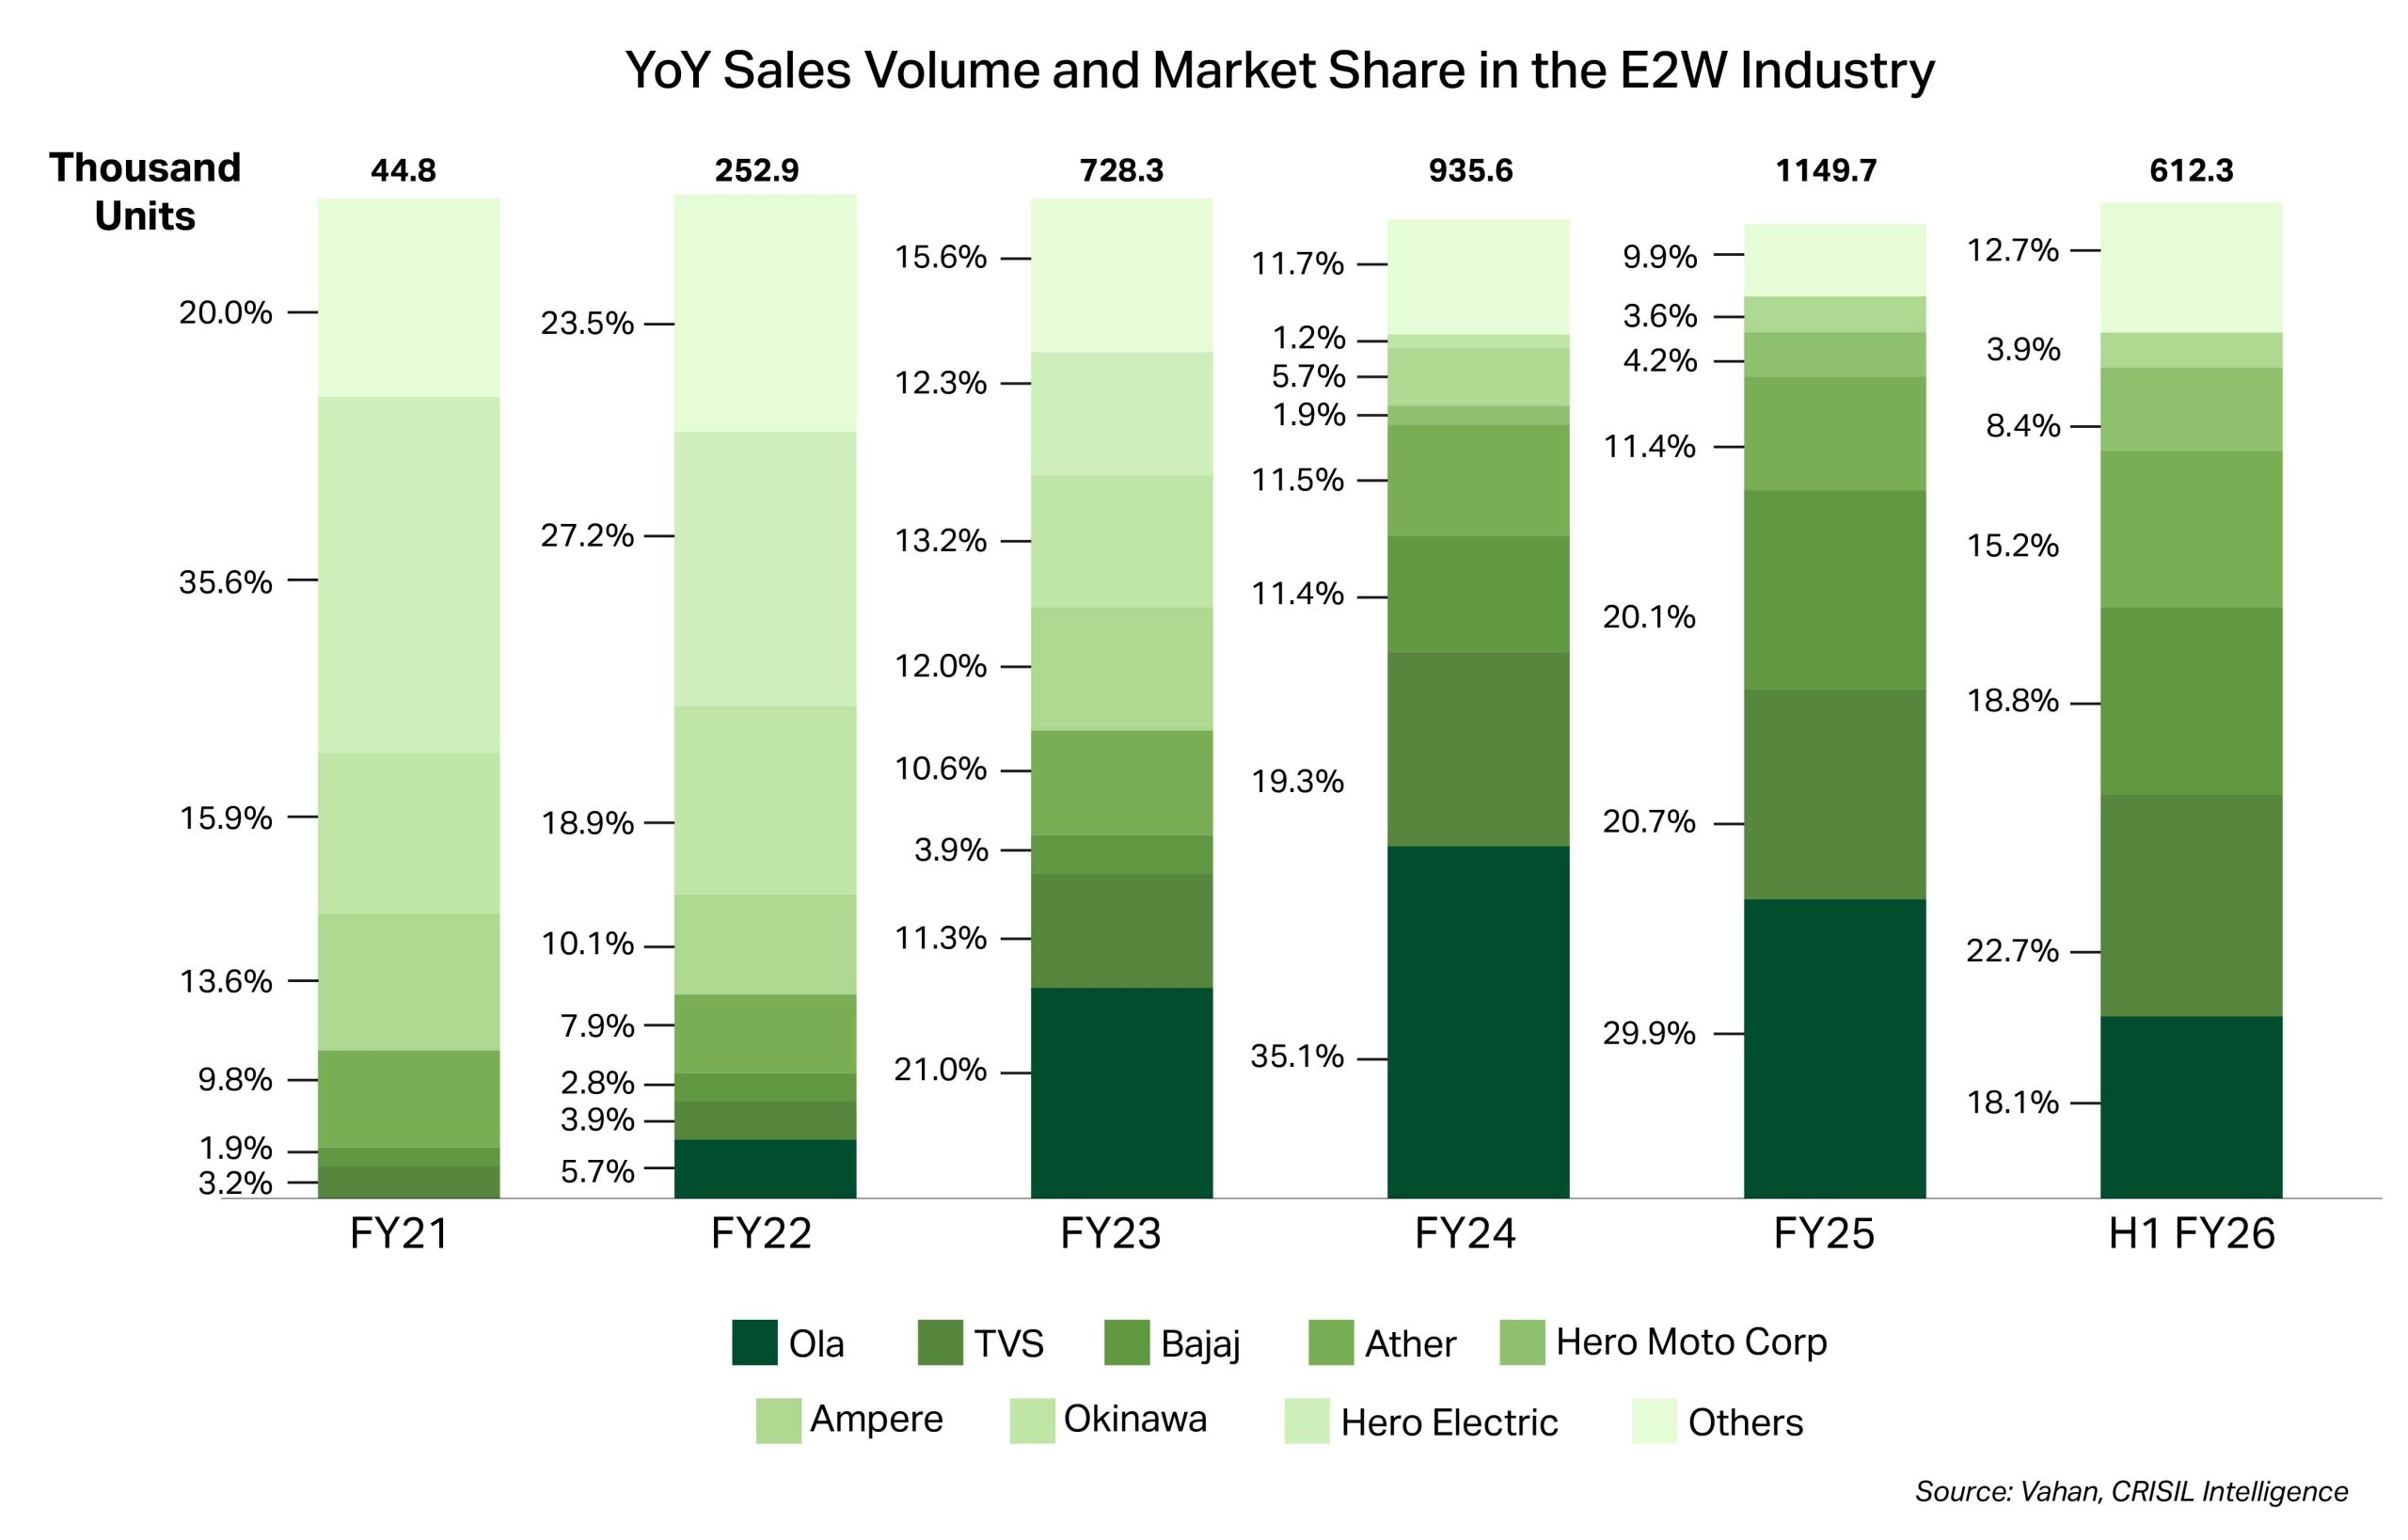
India vs China: A Comparative Perspective
While China’s E2W market is mature, India is on a similar trajectory. India’s rapid urbanization, growing middle class, and strong government support make it an attractive market for E2Ws, particularly as consumer demand for clean, affordable mobility solutions continues to rise.
Conclusion
The E2W market in India is poised for significant growth, with rising government incentives, falling costs, and improving infrastructure. While China continues to dominate the E2W sector, India’s fast-evolving market and rapid adoption offer a promising future for investors. As Ola Electric, Ather Energy, and other key players scale their operations, the Indian E2W market could mirror the success seen in China, making it a high-potential market for electric mobility in the coming years.
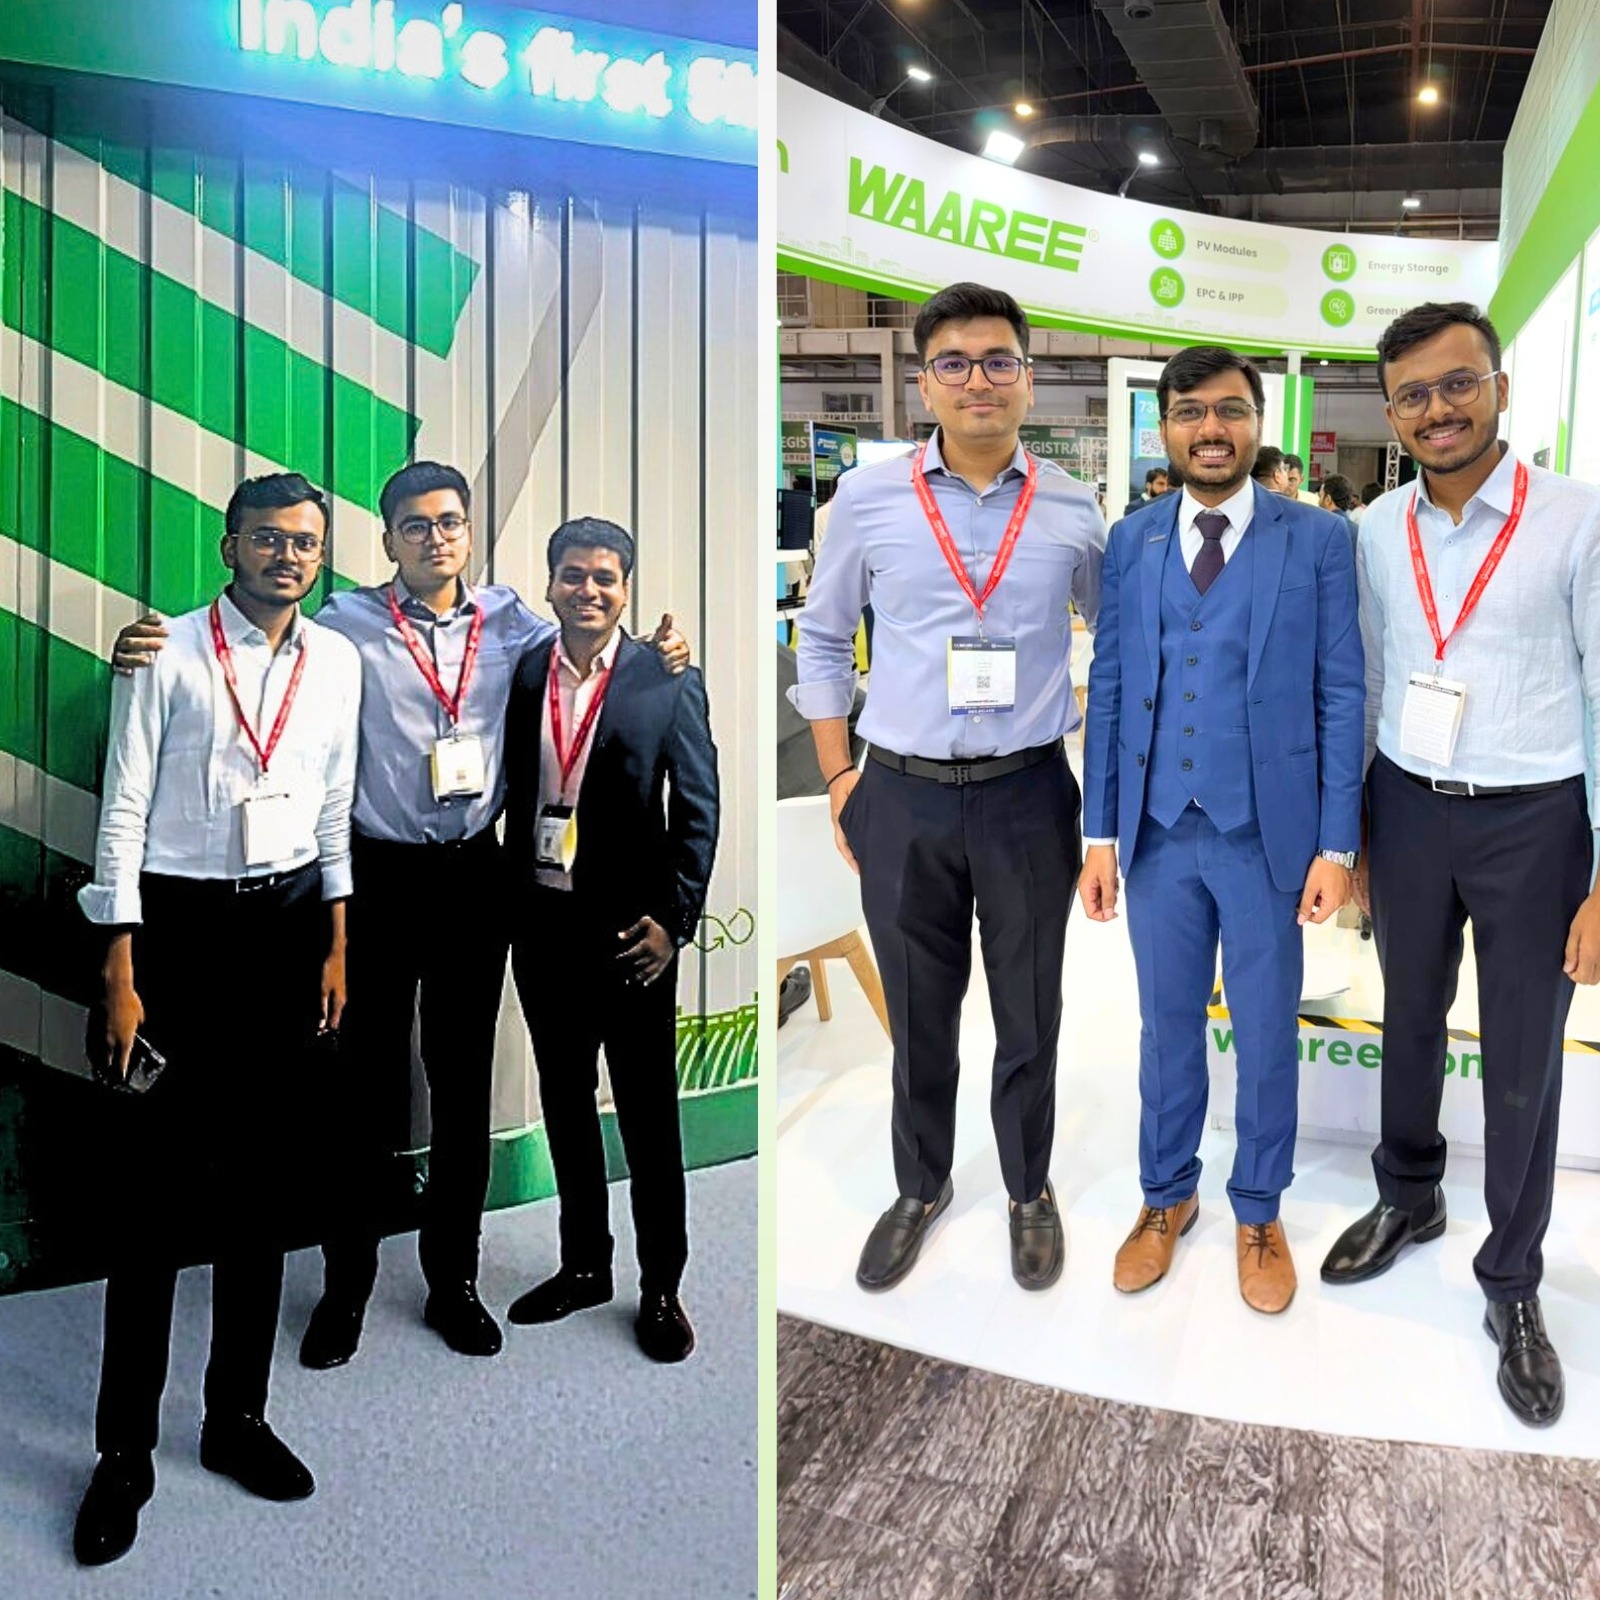
Space Ecosystem
The Battery Show Expo
This year, we had the opportunity to attend The Battery Show Expo, where the entire battery value chain—from cell and pack makers to chemical suppliers and equipment vendors—came together to talk about how India will build its own energy-storage ecosystem. One clear message emerged: India is rapidly moving from being a pure demand market to
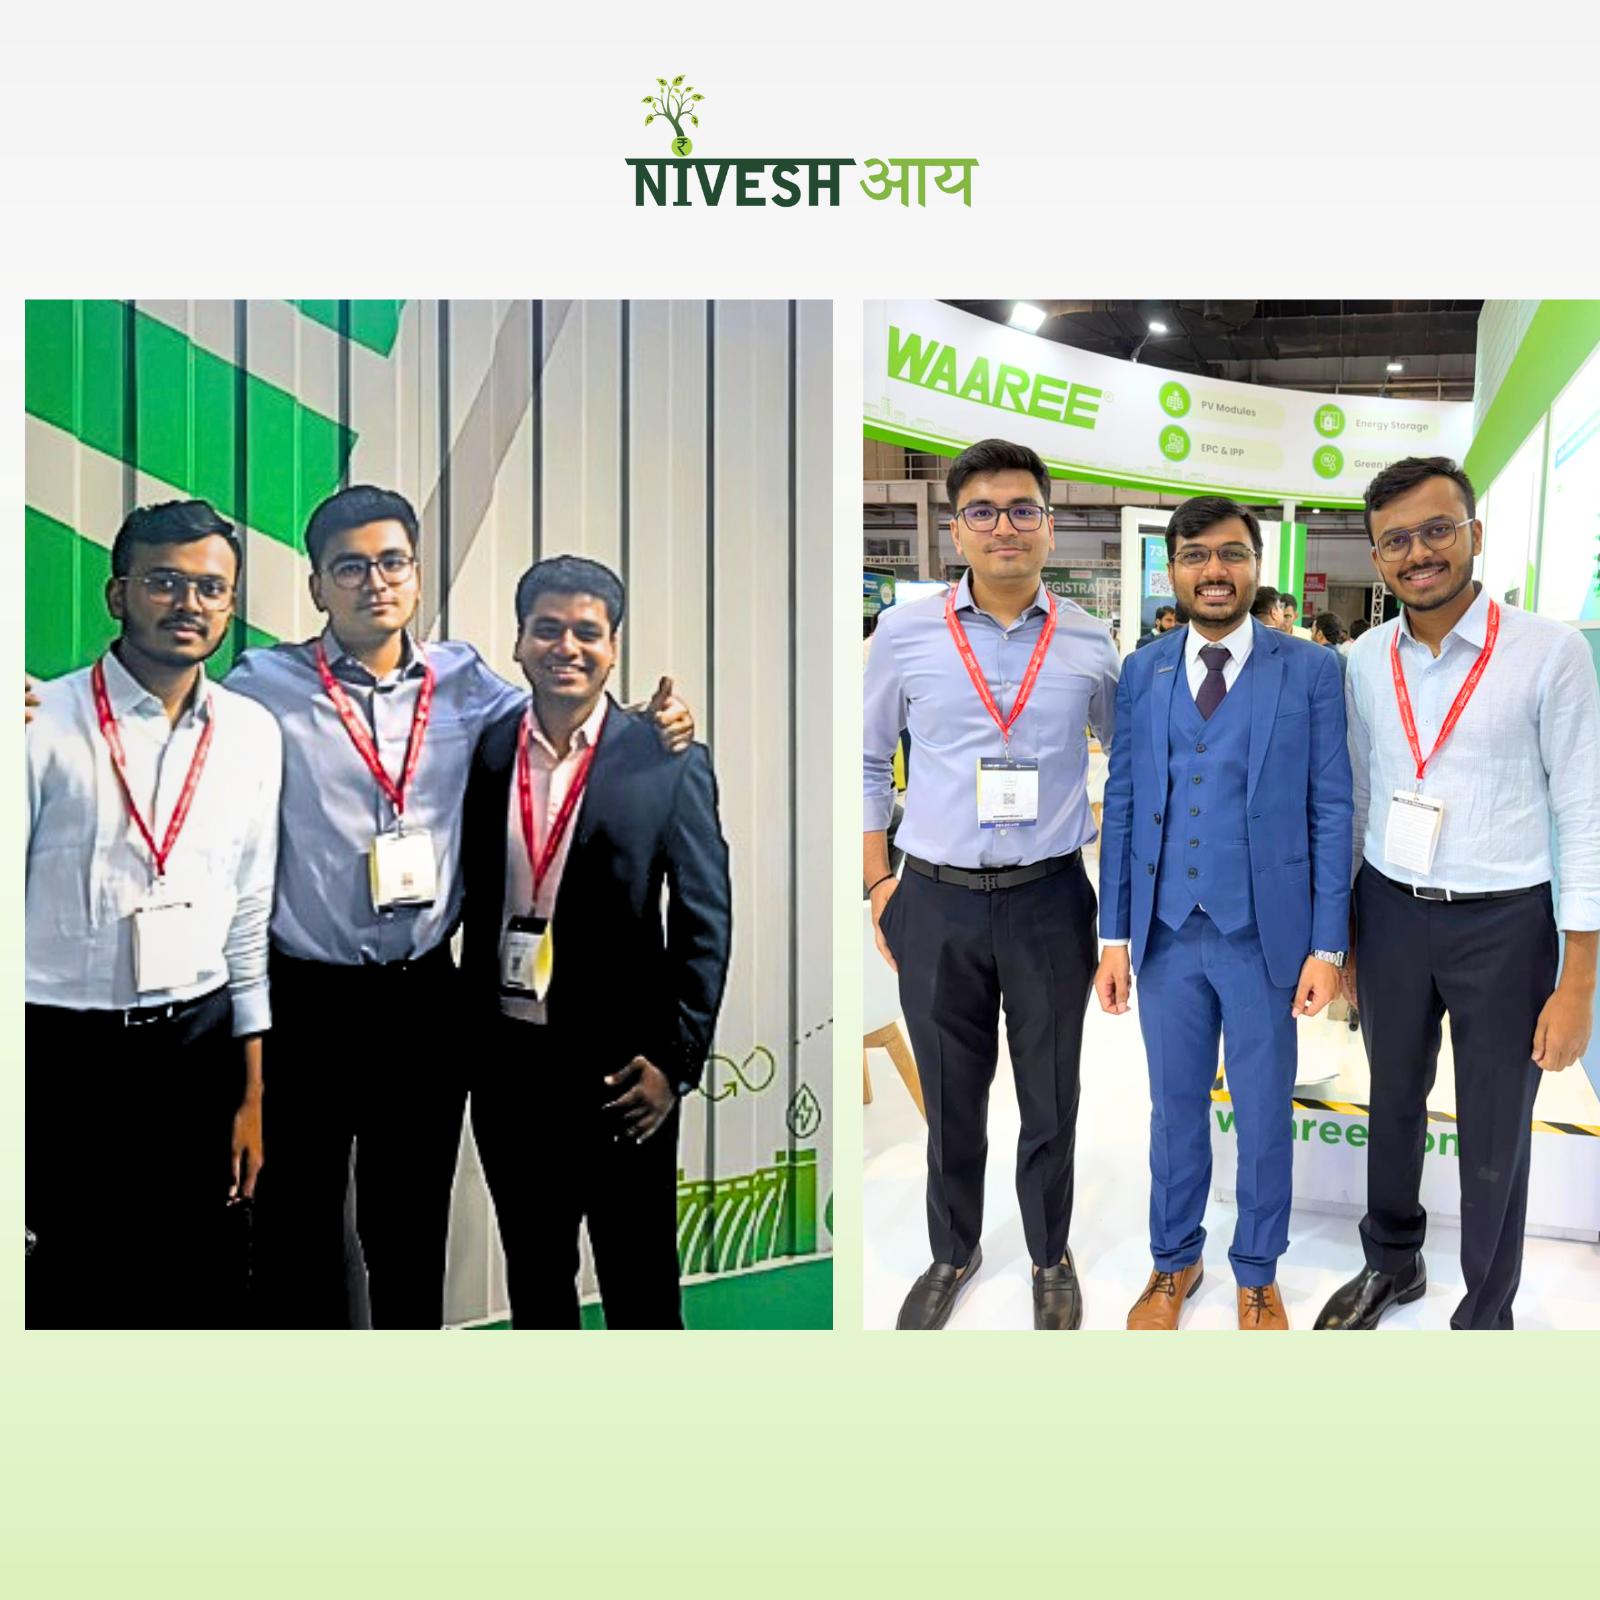
This year, we had the opportunity to attend The Battery Show Expo, where the entire battery value chain—from cell and pack makers to chemical suppliers and equipment vendors—came together to talk about how India will build its own energy-storage ecosystem. One clear message emerged: India is rapidly moving from being a pure demand market to building serious domestic capacity across BESS assembly, cells and critical materials.
From the shop floor to the chemistry lab, everyone is gearing up for scale. BESS pack assembly lines of ~35 GWh are already installed and expected to more than double in the next 12 months, while large Chinese and global players are anticipating significant annual demand from India.
At the same time, Indian electrolyte and precursor manufacturers are stepping in to solve shelf life, logistics and supply-chain risks that come with relying on imports. This note captures our key takeaways from the Expo—covering assembly players, cell manufacturers, chemical suppliers and emerging long-duration storage technologies—and what they imply for India’s battery manufacturing opportunity over the next few years.
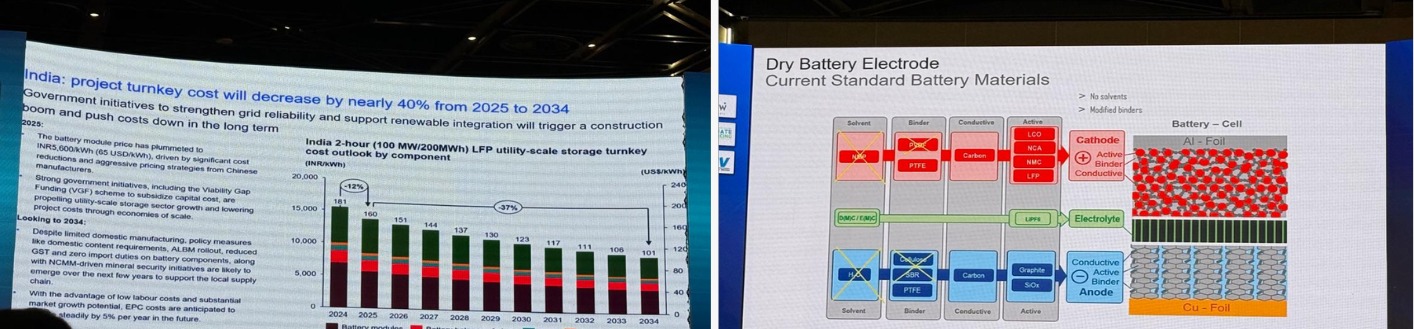
Key Takeaways:
A) Assembly players
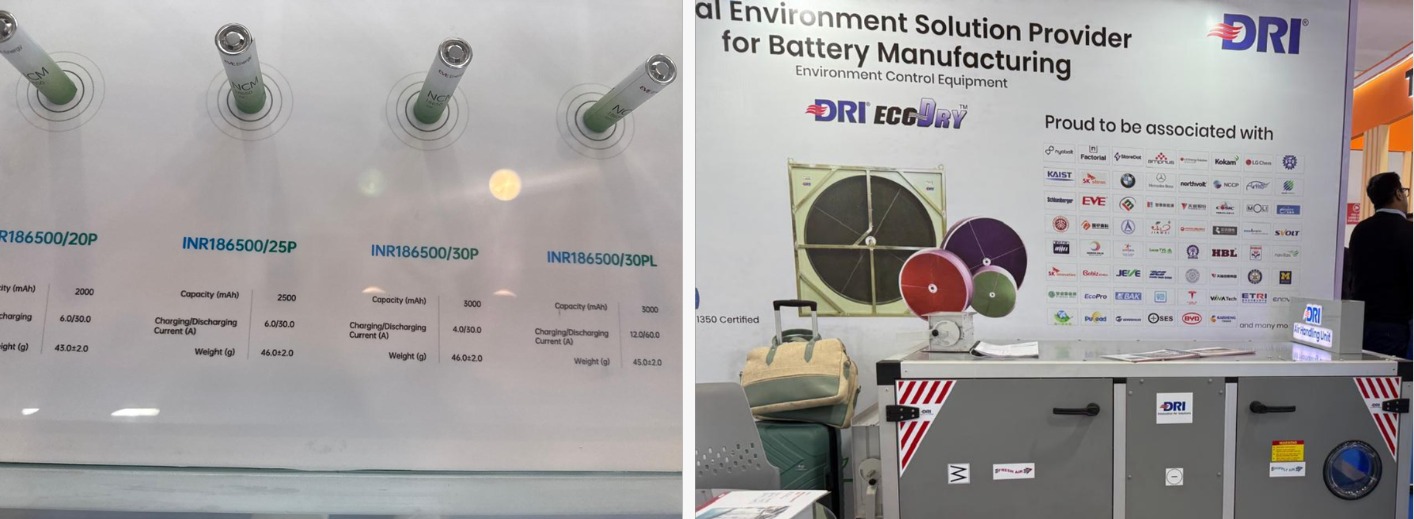
B) Cell players
C) Chemicals
A key advantage for Indian electrolyte manufacturers is shelf life and logistics:
Others
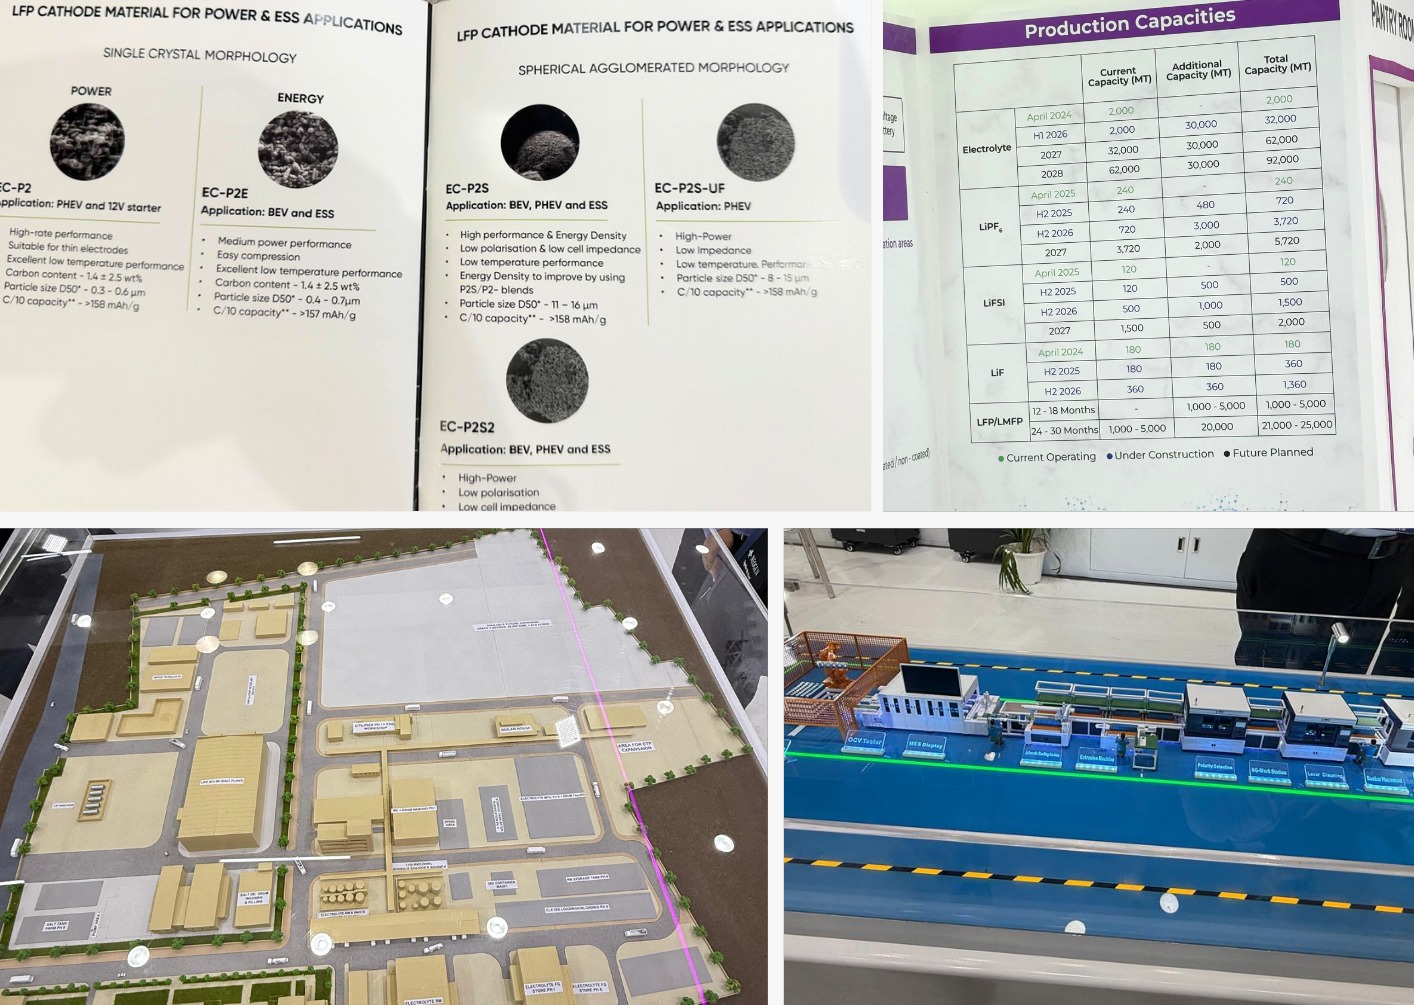
Electronic Manufacturing Services
Building the Battery behind the Grid with Waaree Energy Storage System
We’re happy to share that Niveshaay has led a ₹1,000 crore funding round in Waaree Energy Storage Systems (WESS) — syndicating ₹325 crore through the Sambhav Fund, Hedgehogs Fund, and Niveshaay WESS Fund, alongside our co-investors.
We’re happy to share that Niveshaay has led a ₹1,000 crore funding round in Waaree Energy Storage Systems syndicating ₹325 crore through the Sambhav Fund, Hedgehogs Fund, and Niveshaay WESS Fund, alongside our co-investors.⚡
This marks a pivotal step toward strengthening India’s clean energy infrastructure where scalable storage solutions become the backbone of a sustainable grid.
Niveshaay featured on:
1) Press Trust of India- https://shorturl.at/KcxGT
2) YOURSTORY- https://shorturl.at/nR2h5
3) Economic Times – https://shorturl.at/Nec6y
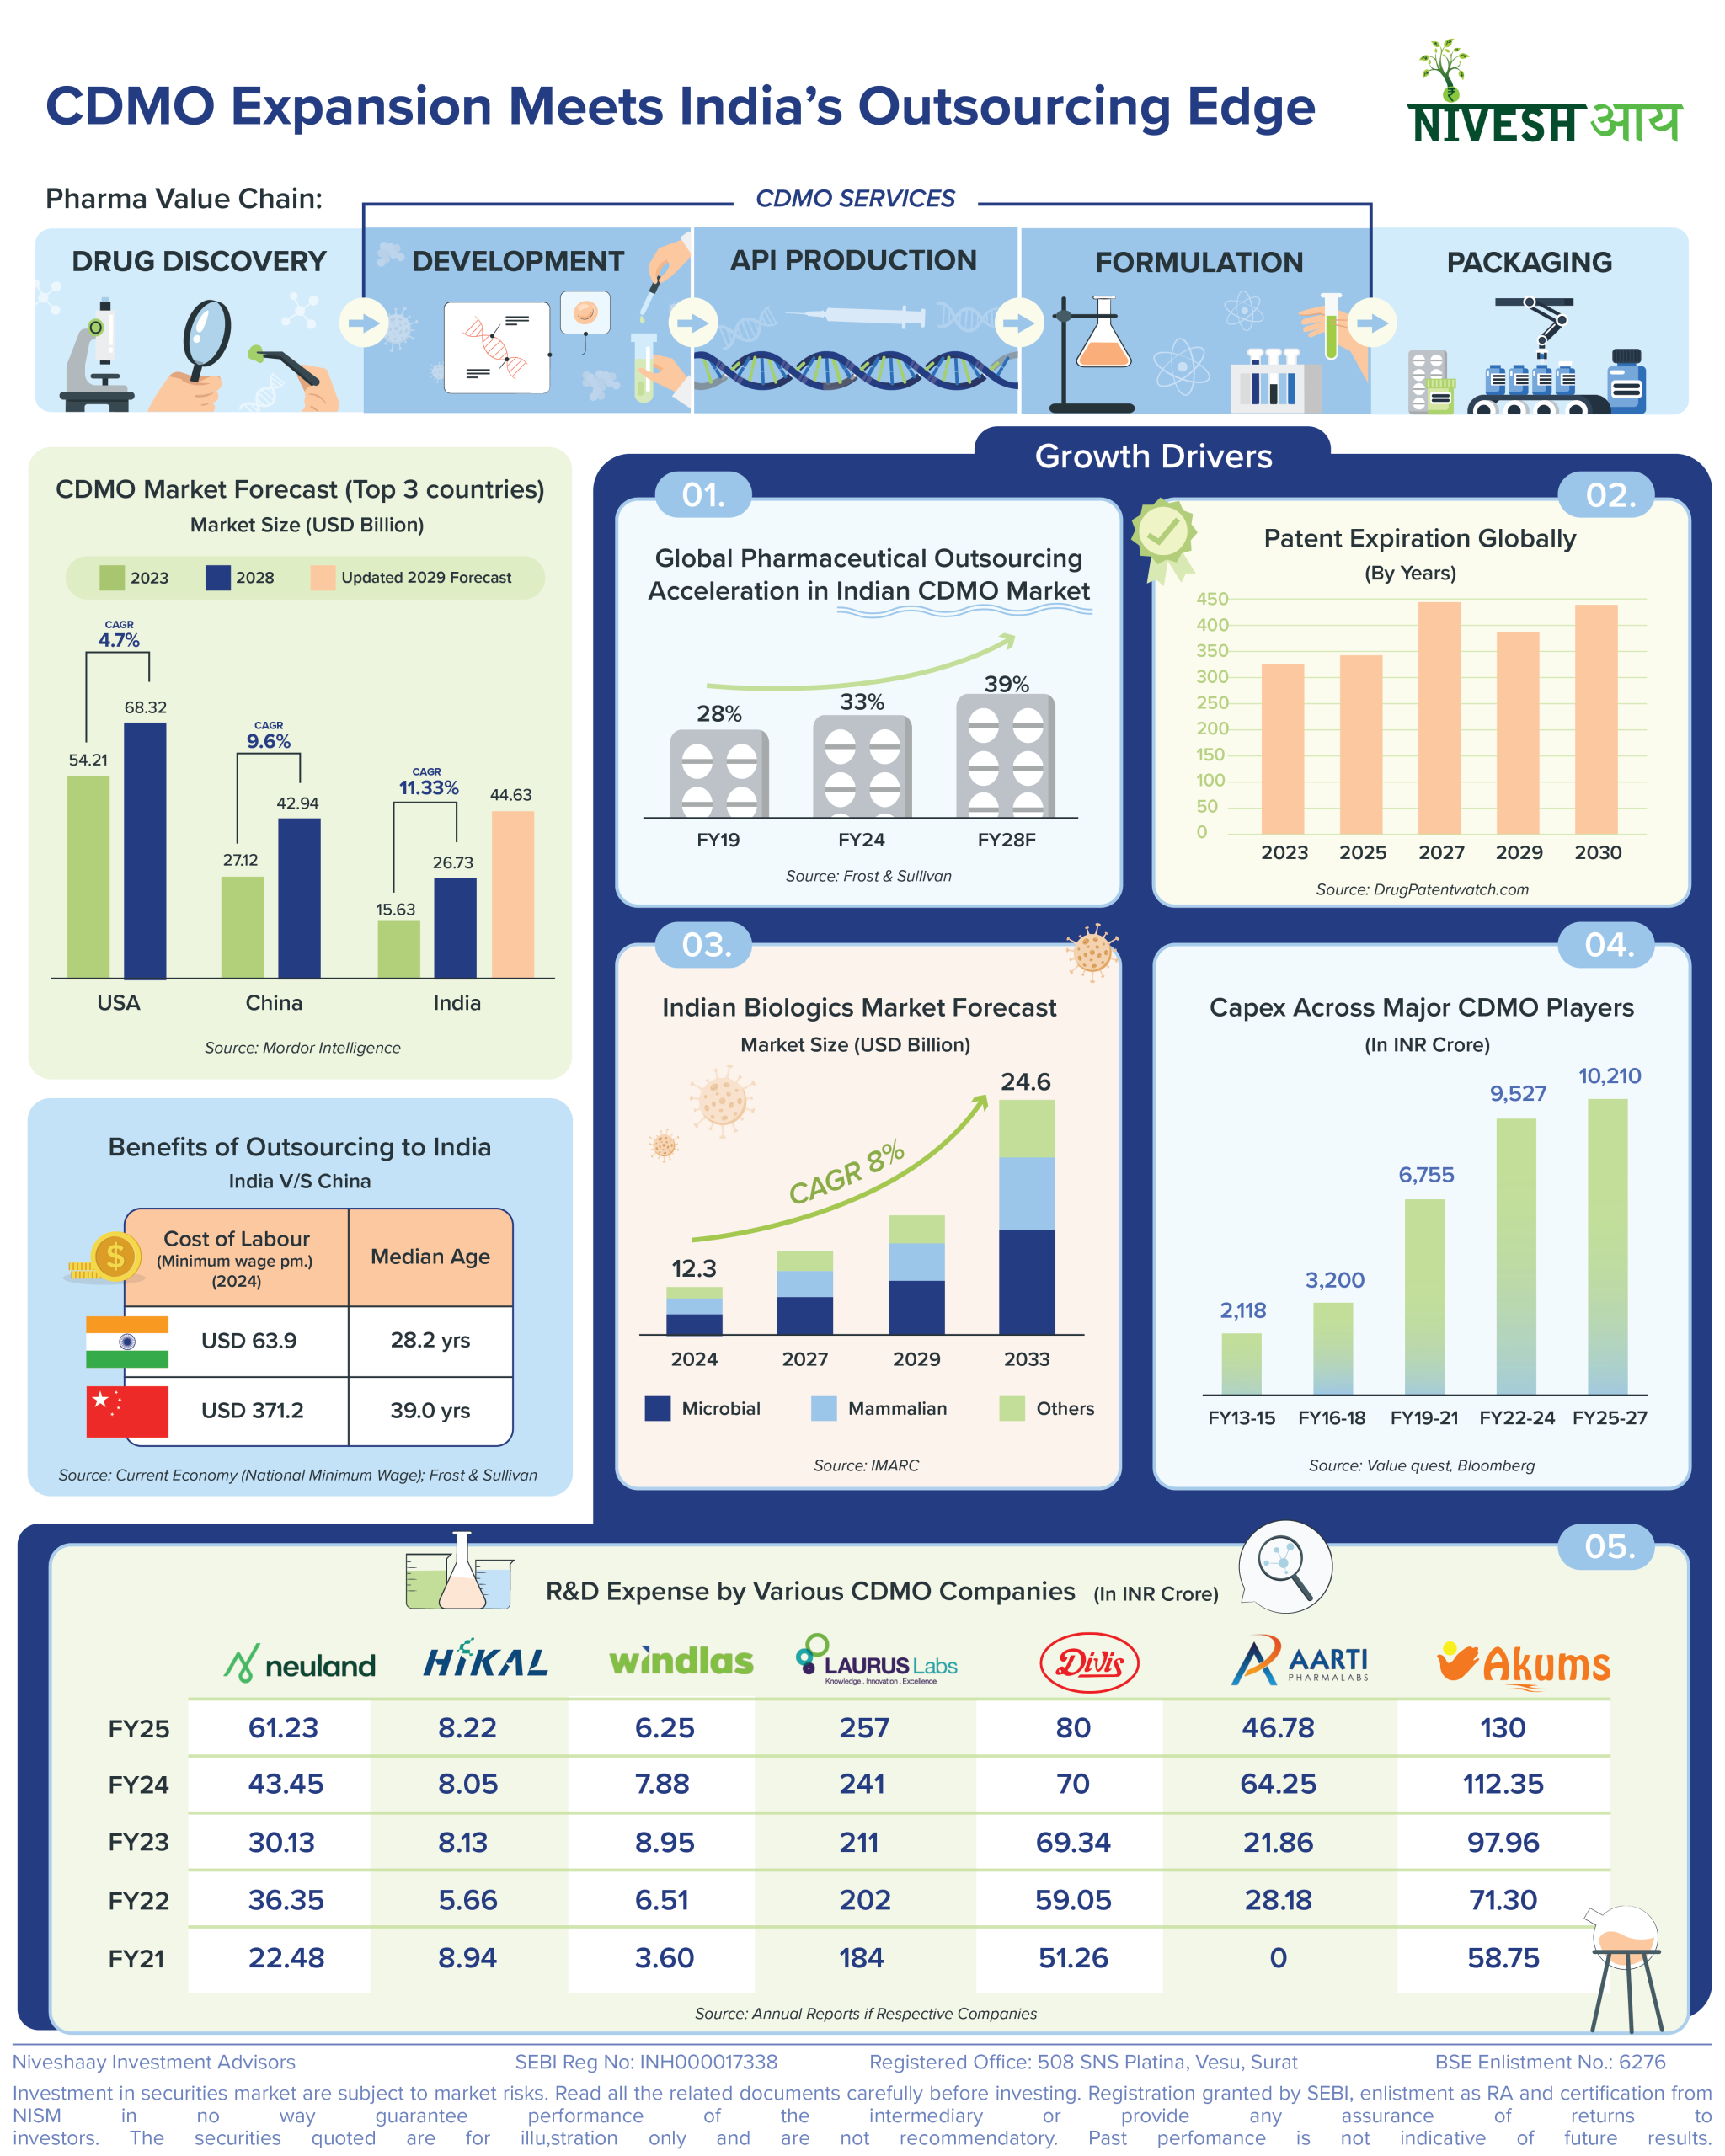
Pharmaceuticals
CDMOs: Powering India’s Pharma Edge in the Global Supply Chain🌍💊
By combining end-to-end drug development with scaled manufacturing, they are pulling in global contracts, widening export footprints, and accelerating innovation — positioning India as an indispensable force in the world’s healthcare supply chain. 🏭📊 India’s CDMO market, valued at ~USD 26 billion in 2028, is projected to surge past USD 44 billion by 2029—a testament
By combining end-to-end drug development with scaled manufacturing, they are pulling in global contracts, widening export footprints, and accelerating innovation — positioning India as an indispensable force in the world’s healthcare supply chain. 🏭
📊 India’s CDMO market, valued at ~USD 26 billion in 2028, is projected to surge past USD 44 billion by 2029—a testament to the country’s rapid global ascent 📈.
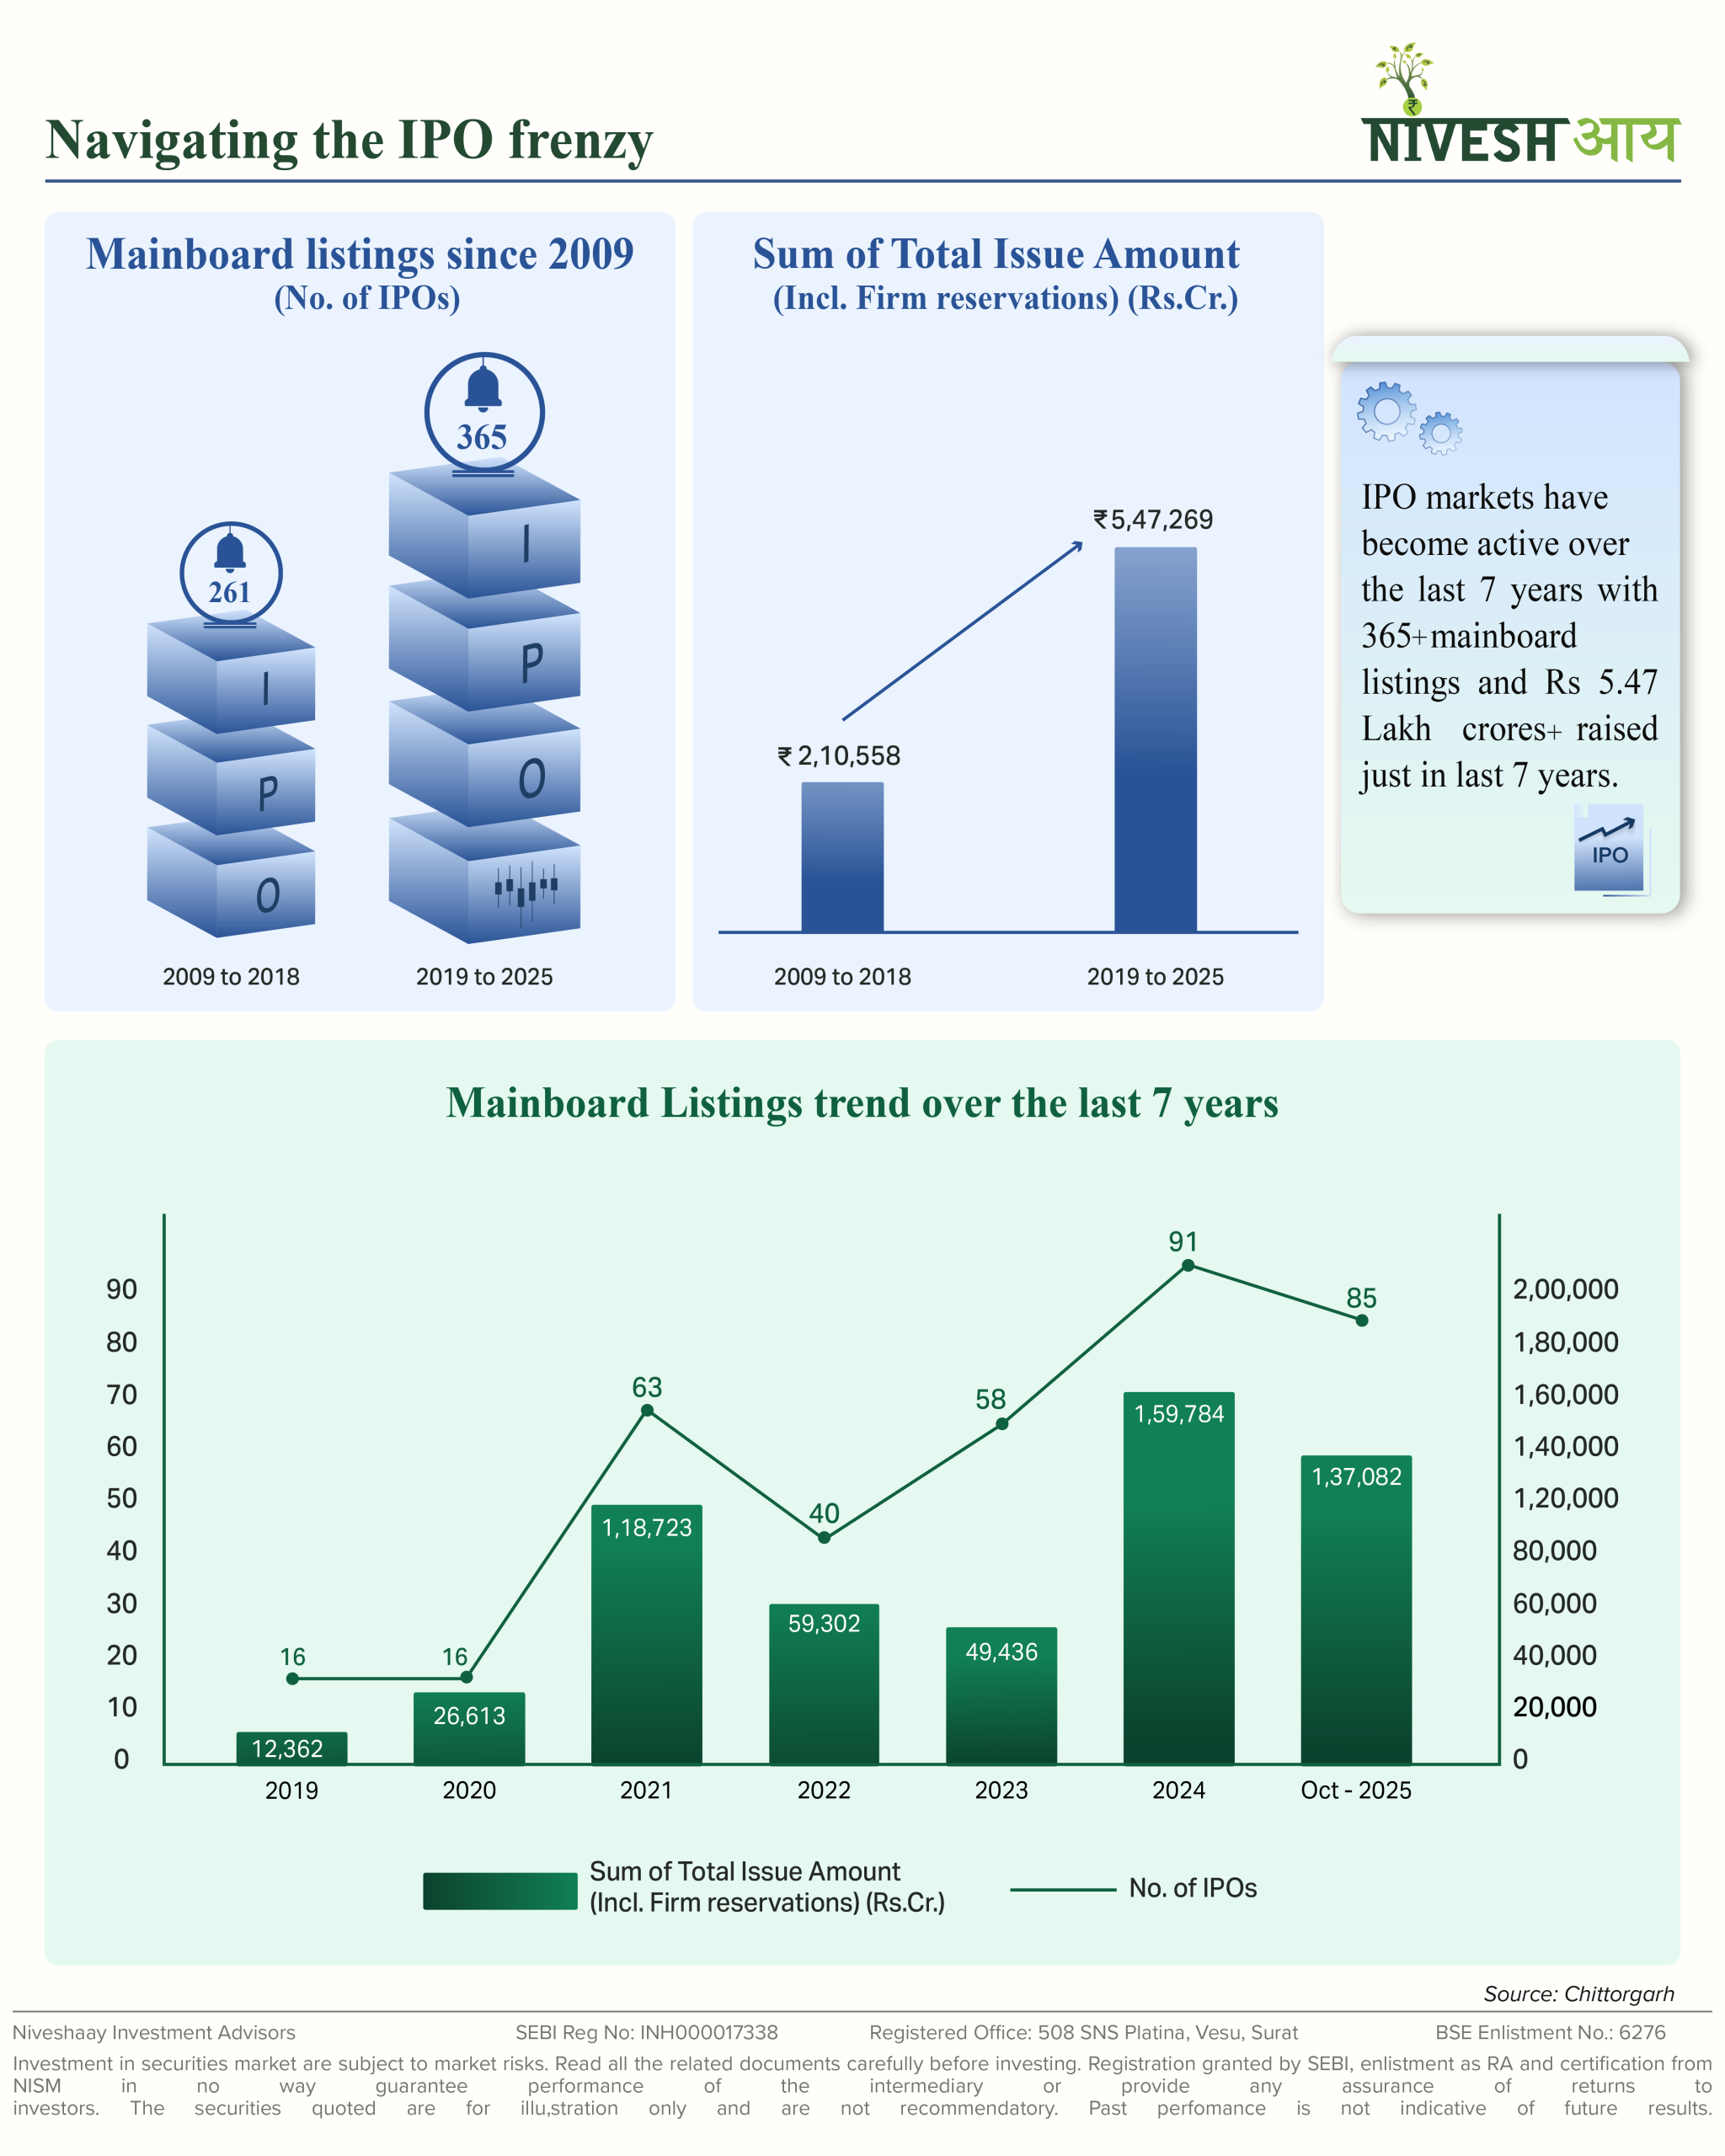
Electric Vehicle & Ancillaries
Navigating the IPO Frenzy 🚀
India has raised nearly ₹1.37 lakh crore via mainboard IPOs in 2025 — making it one of the most active IPO markets globally. Big names like Tata Capital, LG Electronics, Ather Energy & HDB Financial have hit the bourses.
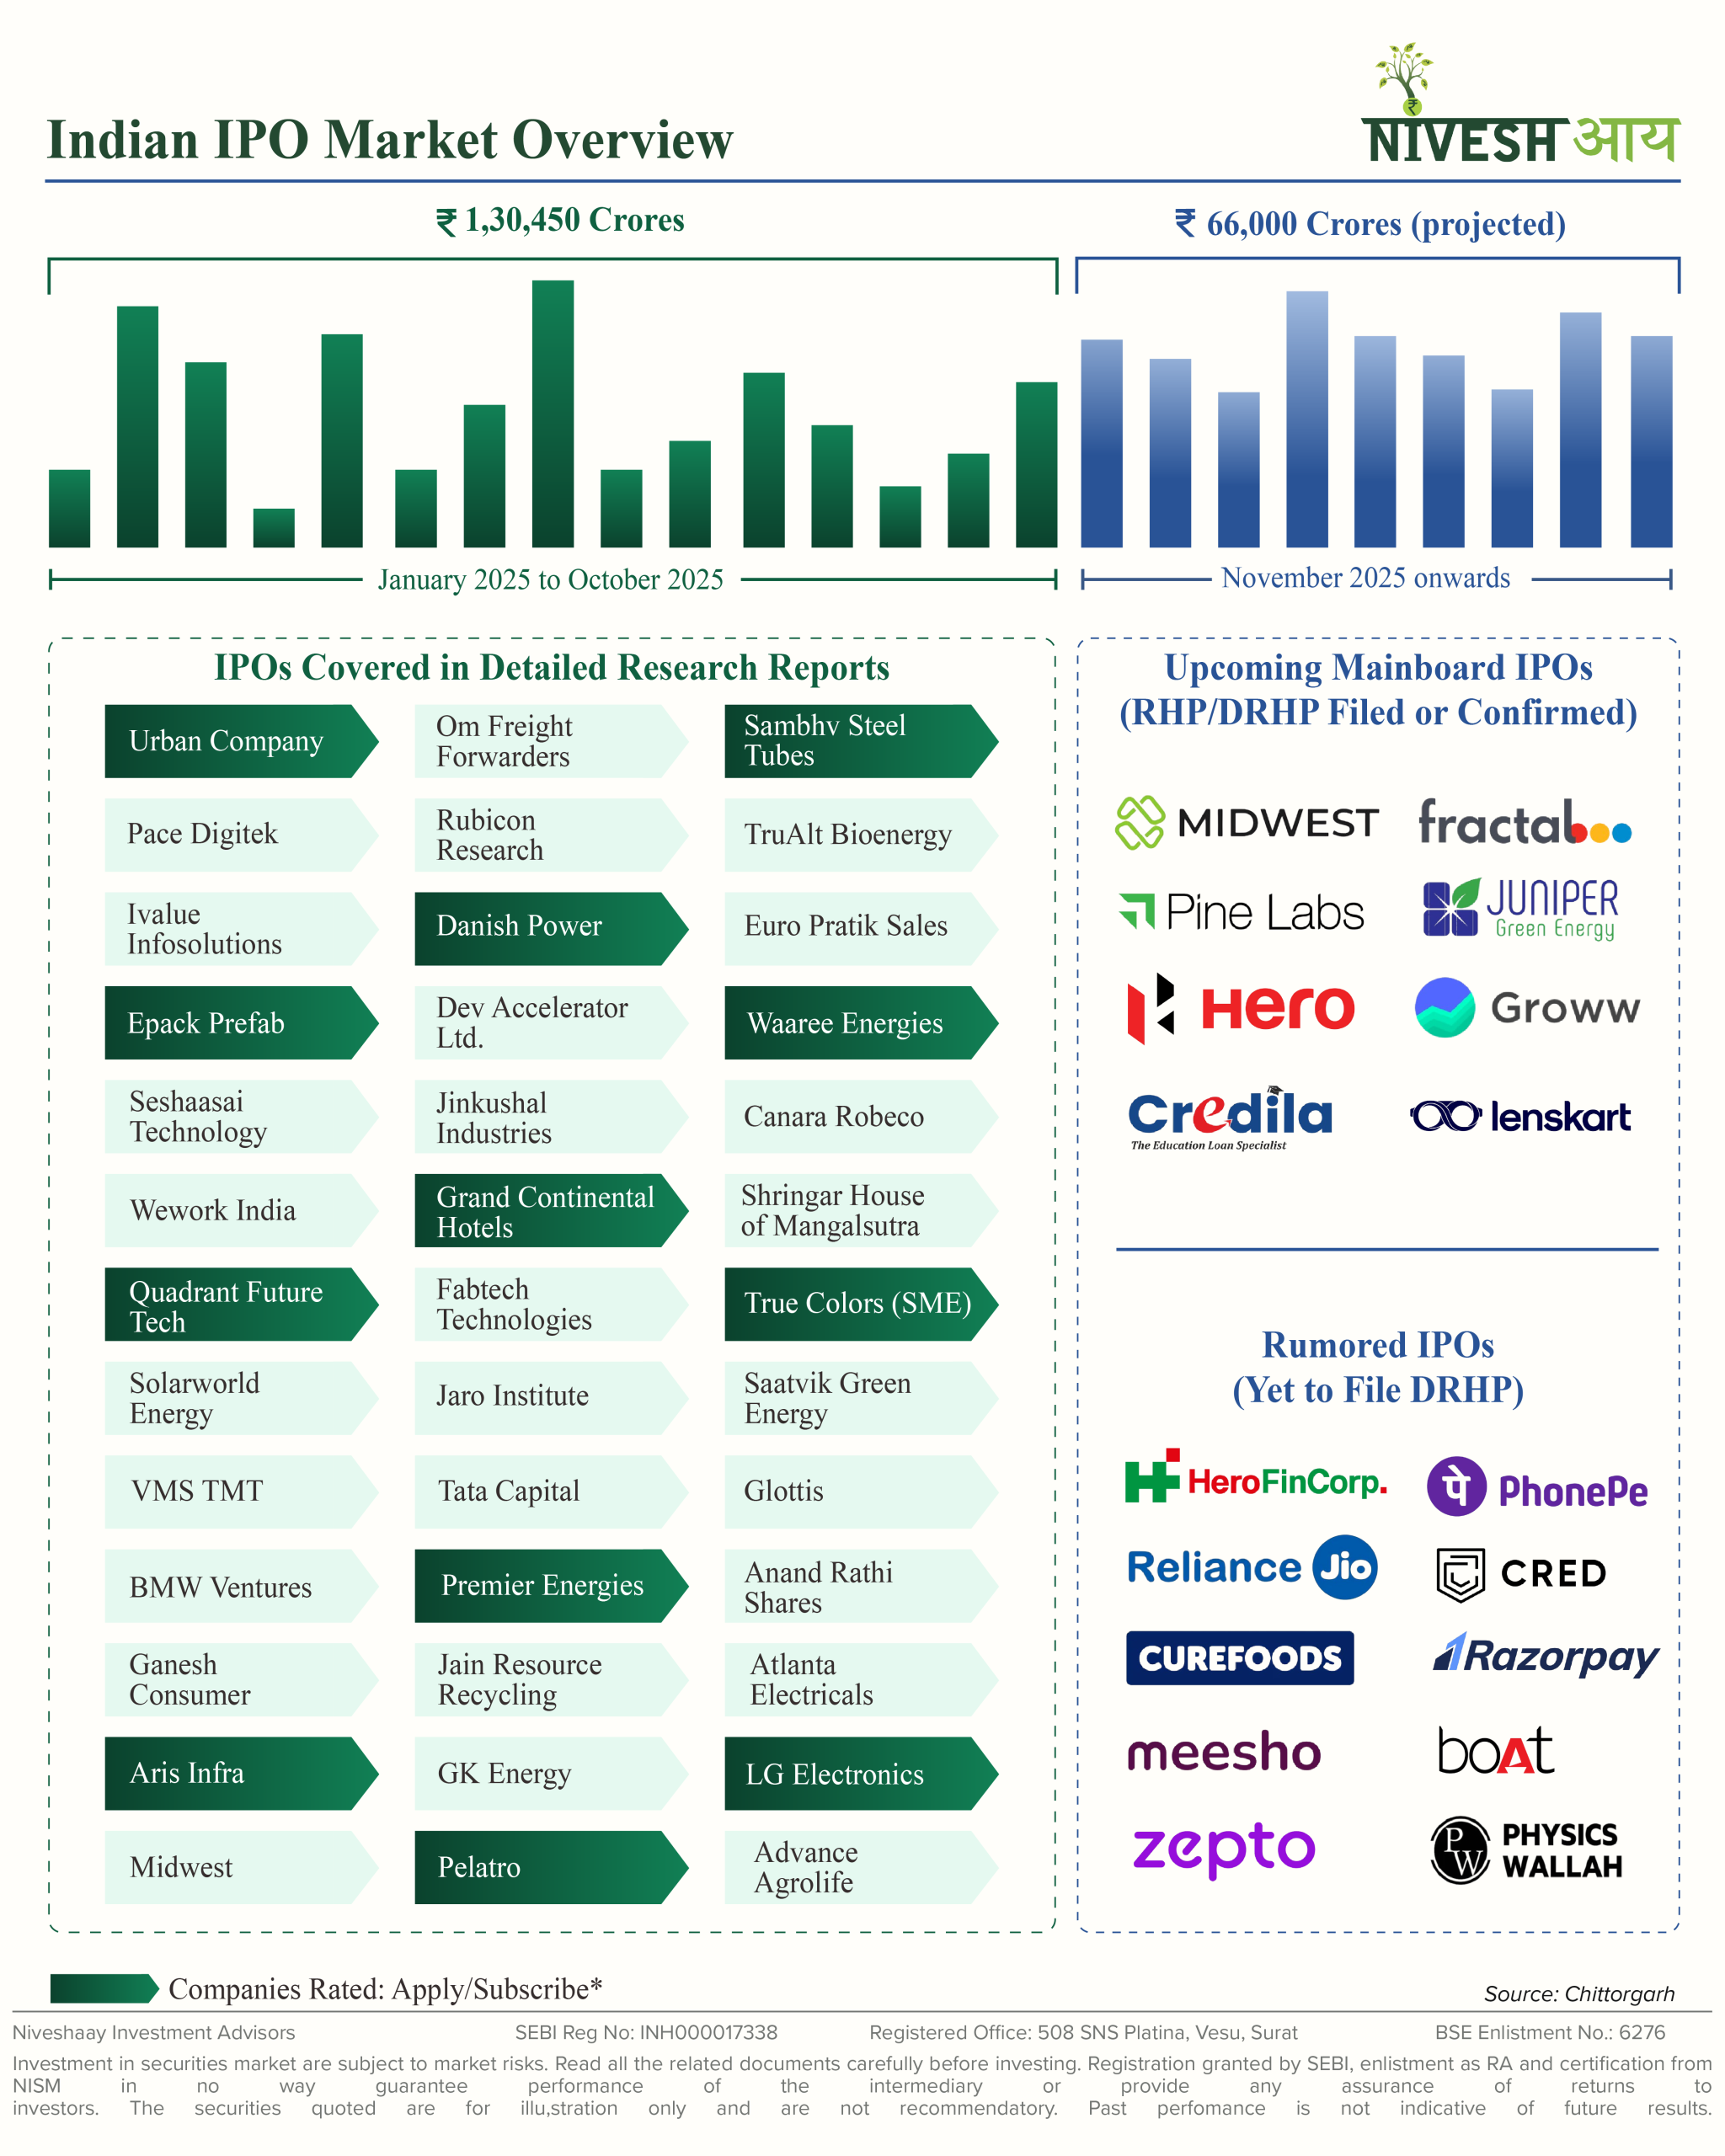
The IPO market continues to buzz with record activity — India has raised nearly ₹1,37,000 crore through mainboard IPOs so far in 2025, making it the one of the most active IPO markets globally. This period has seen listing of iconic names like Tata Capital, LG Electronics, Ather Energy, HDB Financial Services and WeWork India.
But beneath the euphoria lies a familiar question — what happens after the debut? In a market swayed by short-term sentiment and lofty valuations, long-term conviction often gets lost.
At Niveshaay, we believe the real opportunity begins after the listing — when fundamentals, not frenzy, start to speak. Our team continues to analyse upcoming IPOs in depth, helping investors identify businesses that can create lasting value.
Watchlist the Niveshaay IPO Basket Fundamental to read our exclusive detailed IPO analyses — and let us help you navigate the noise, one company at a time.

Specialty Chemicals
The Invisible Architects of Emotion: A Deep Dive into the Flavors & Fragrances (F&F) Industry
Scent has always been part of our human story. Think of the rosewater used in Persian kitchens, the attars that traveled along the Silk Road, the citrus colognes worn by generations in Spain. Each carries not only a smell but also a history: of trade and craftsmanship, of gardens cultivated, of migrations and exchanges that
Scent has always been part of our human story. Think of the rosewater used in Persian kitchens, the attars that traveled along the Silk Road, the citrus colognes worn by generations in Spain. Each carries not only a smell but also a history: of trade and craftsmanship, of gardens cultivated, of migrations and exchanges that shaped the world we live in today.
Today, the Flavors & Fragrances (F&F) industry continues to play a pivotal role in shaping consumer experiences. Often unnoticed, its influence stretches from product appeal to brand loyalty, and even purchasing decisions. India, with its rich history in aroma and growing market share, is becoming a key player in this global industry. Let’s explore why the F&F industry is worth paying attention to.
The flavors and fragrances industry (F&F) creates scents and tastes for use in a broad range of consumer products, including prepared foods, personal care and household products, fine fragrances, cosmetics, and beverages.
Industry Segments:
The flavors and fragrances (F&F) market is primarily divided into three key segments:
Global Market:
The global flavors and fragrances market, valued at USD 39 billion in 2024, is poised for robust growth, projected to reach USD 55 billion by 2029. This represents a healthy compound annual growth rate (CAGR) of 6.9%. Fragrances dominate the market, accounting for nearly 55%, while flavors contribute the remainder.
A major shift is occurring in the Asia-Pacific region, which now drives over 30% of global demand. This surge is fueled by rising disposable incomes, an increasing appetite for FMCG products, and the growing formalization of food and personal care sectors.
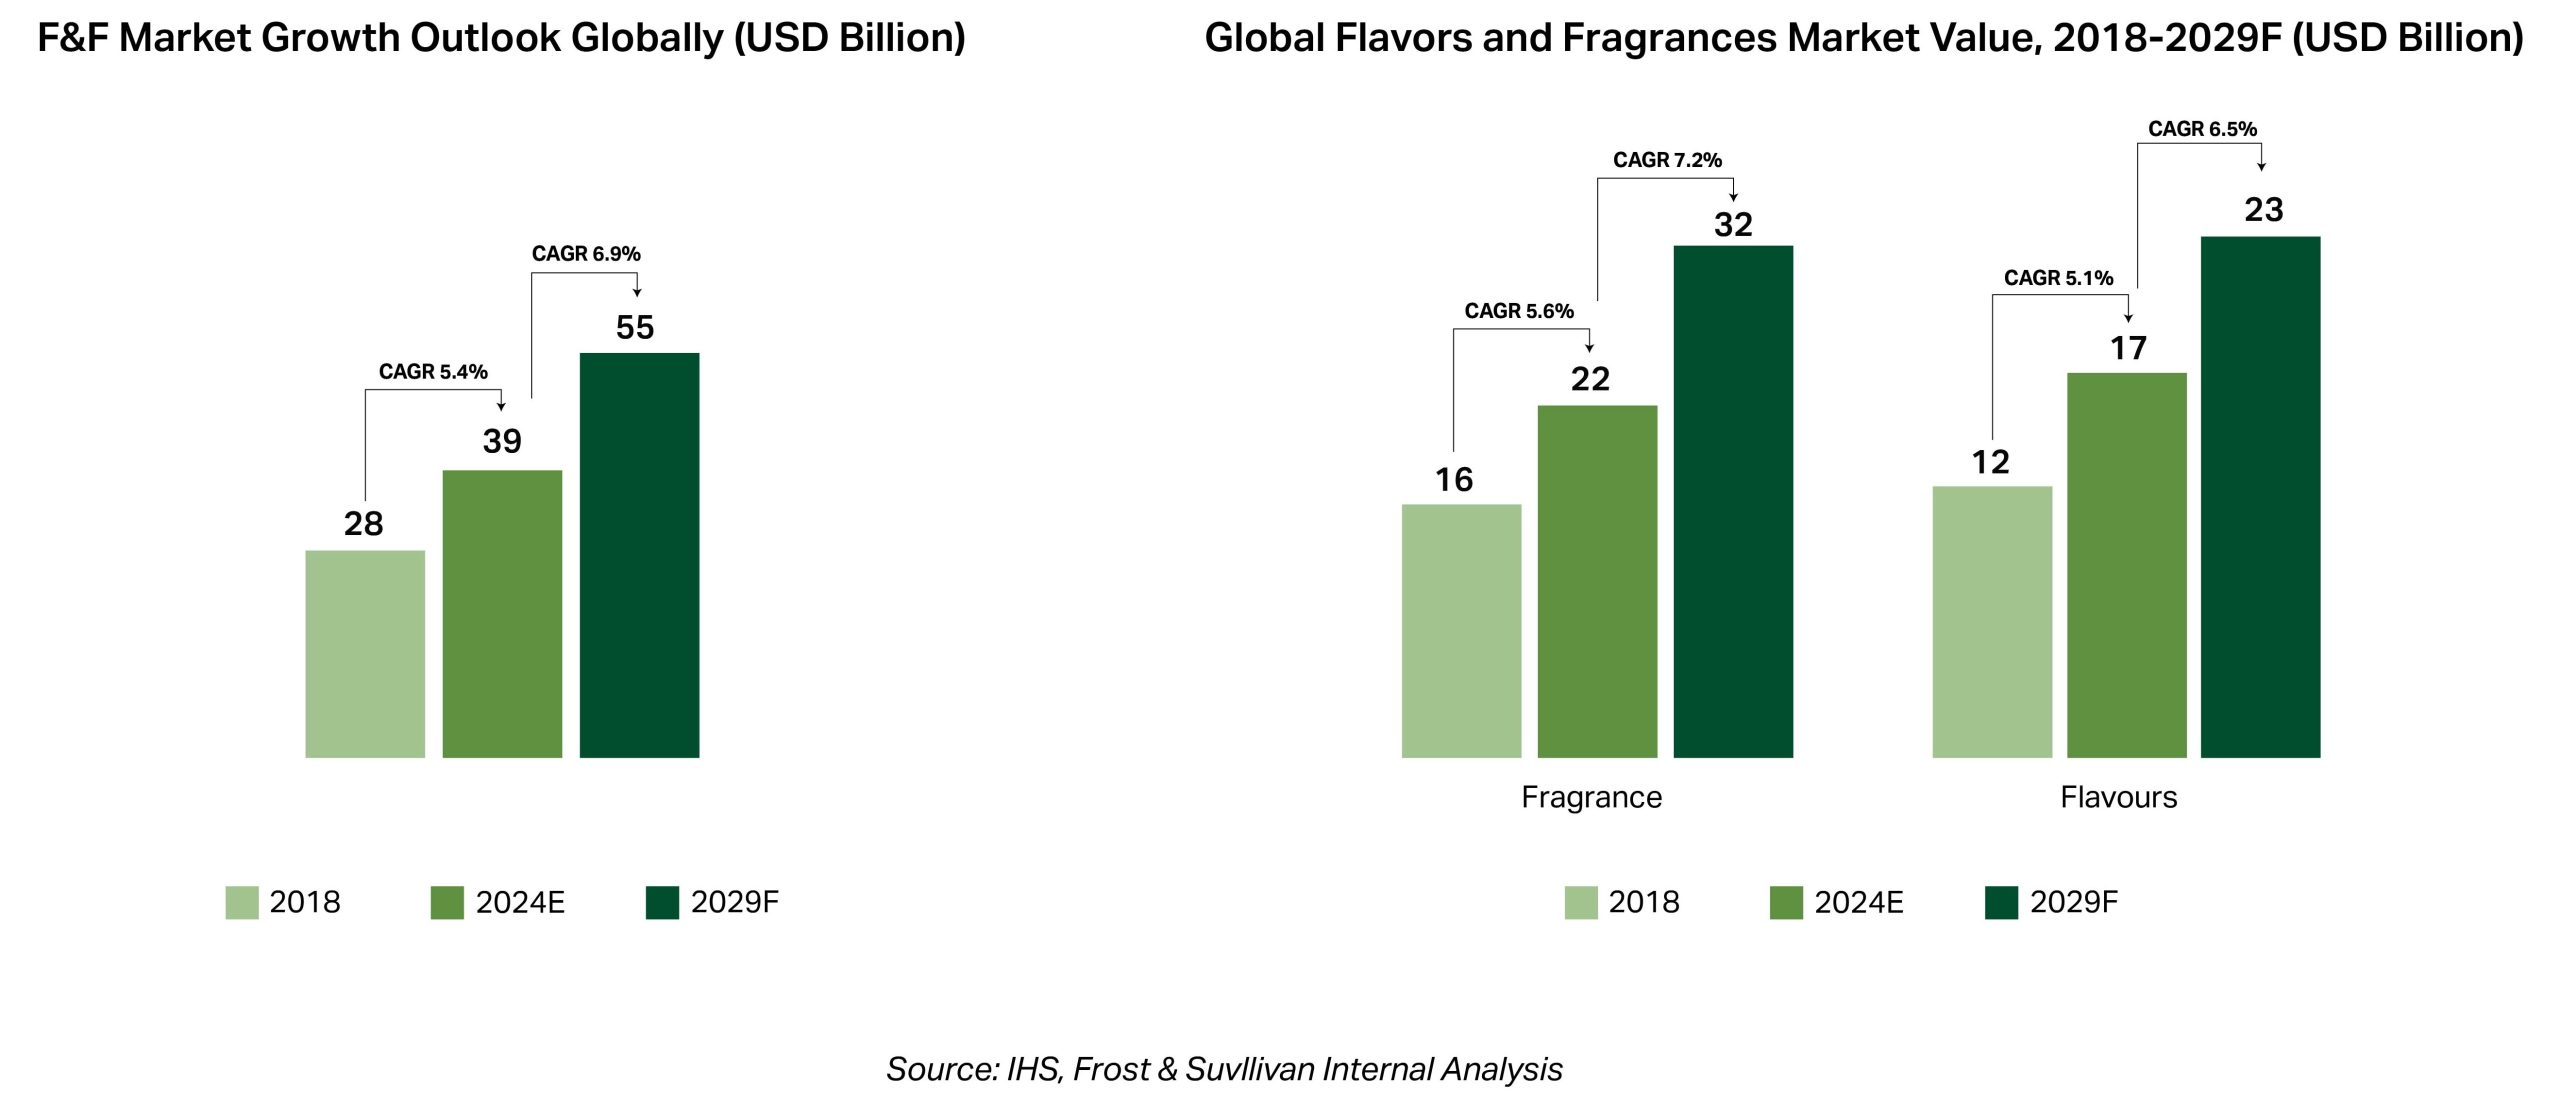
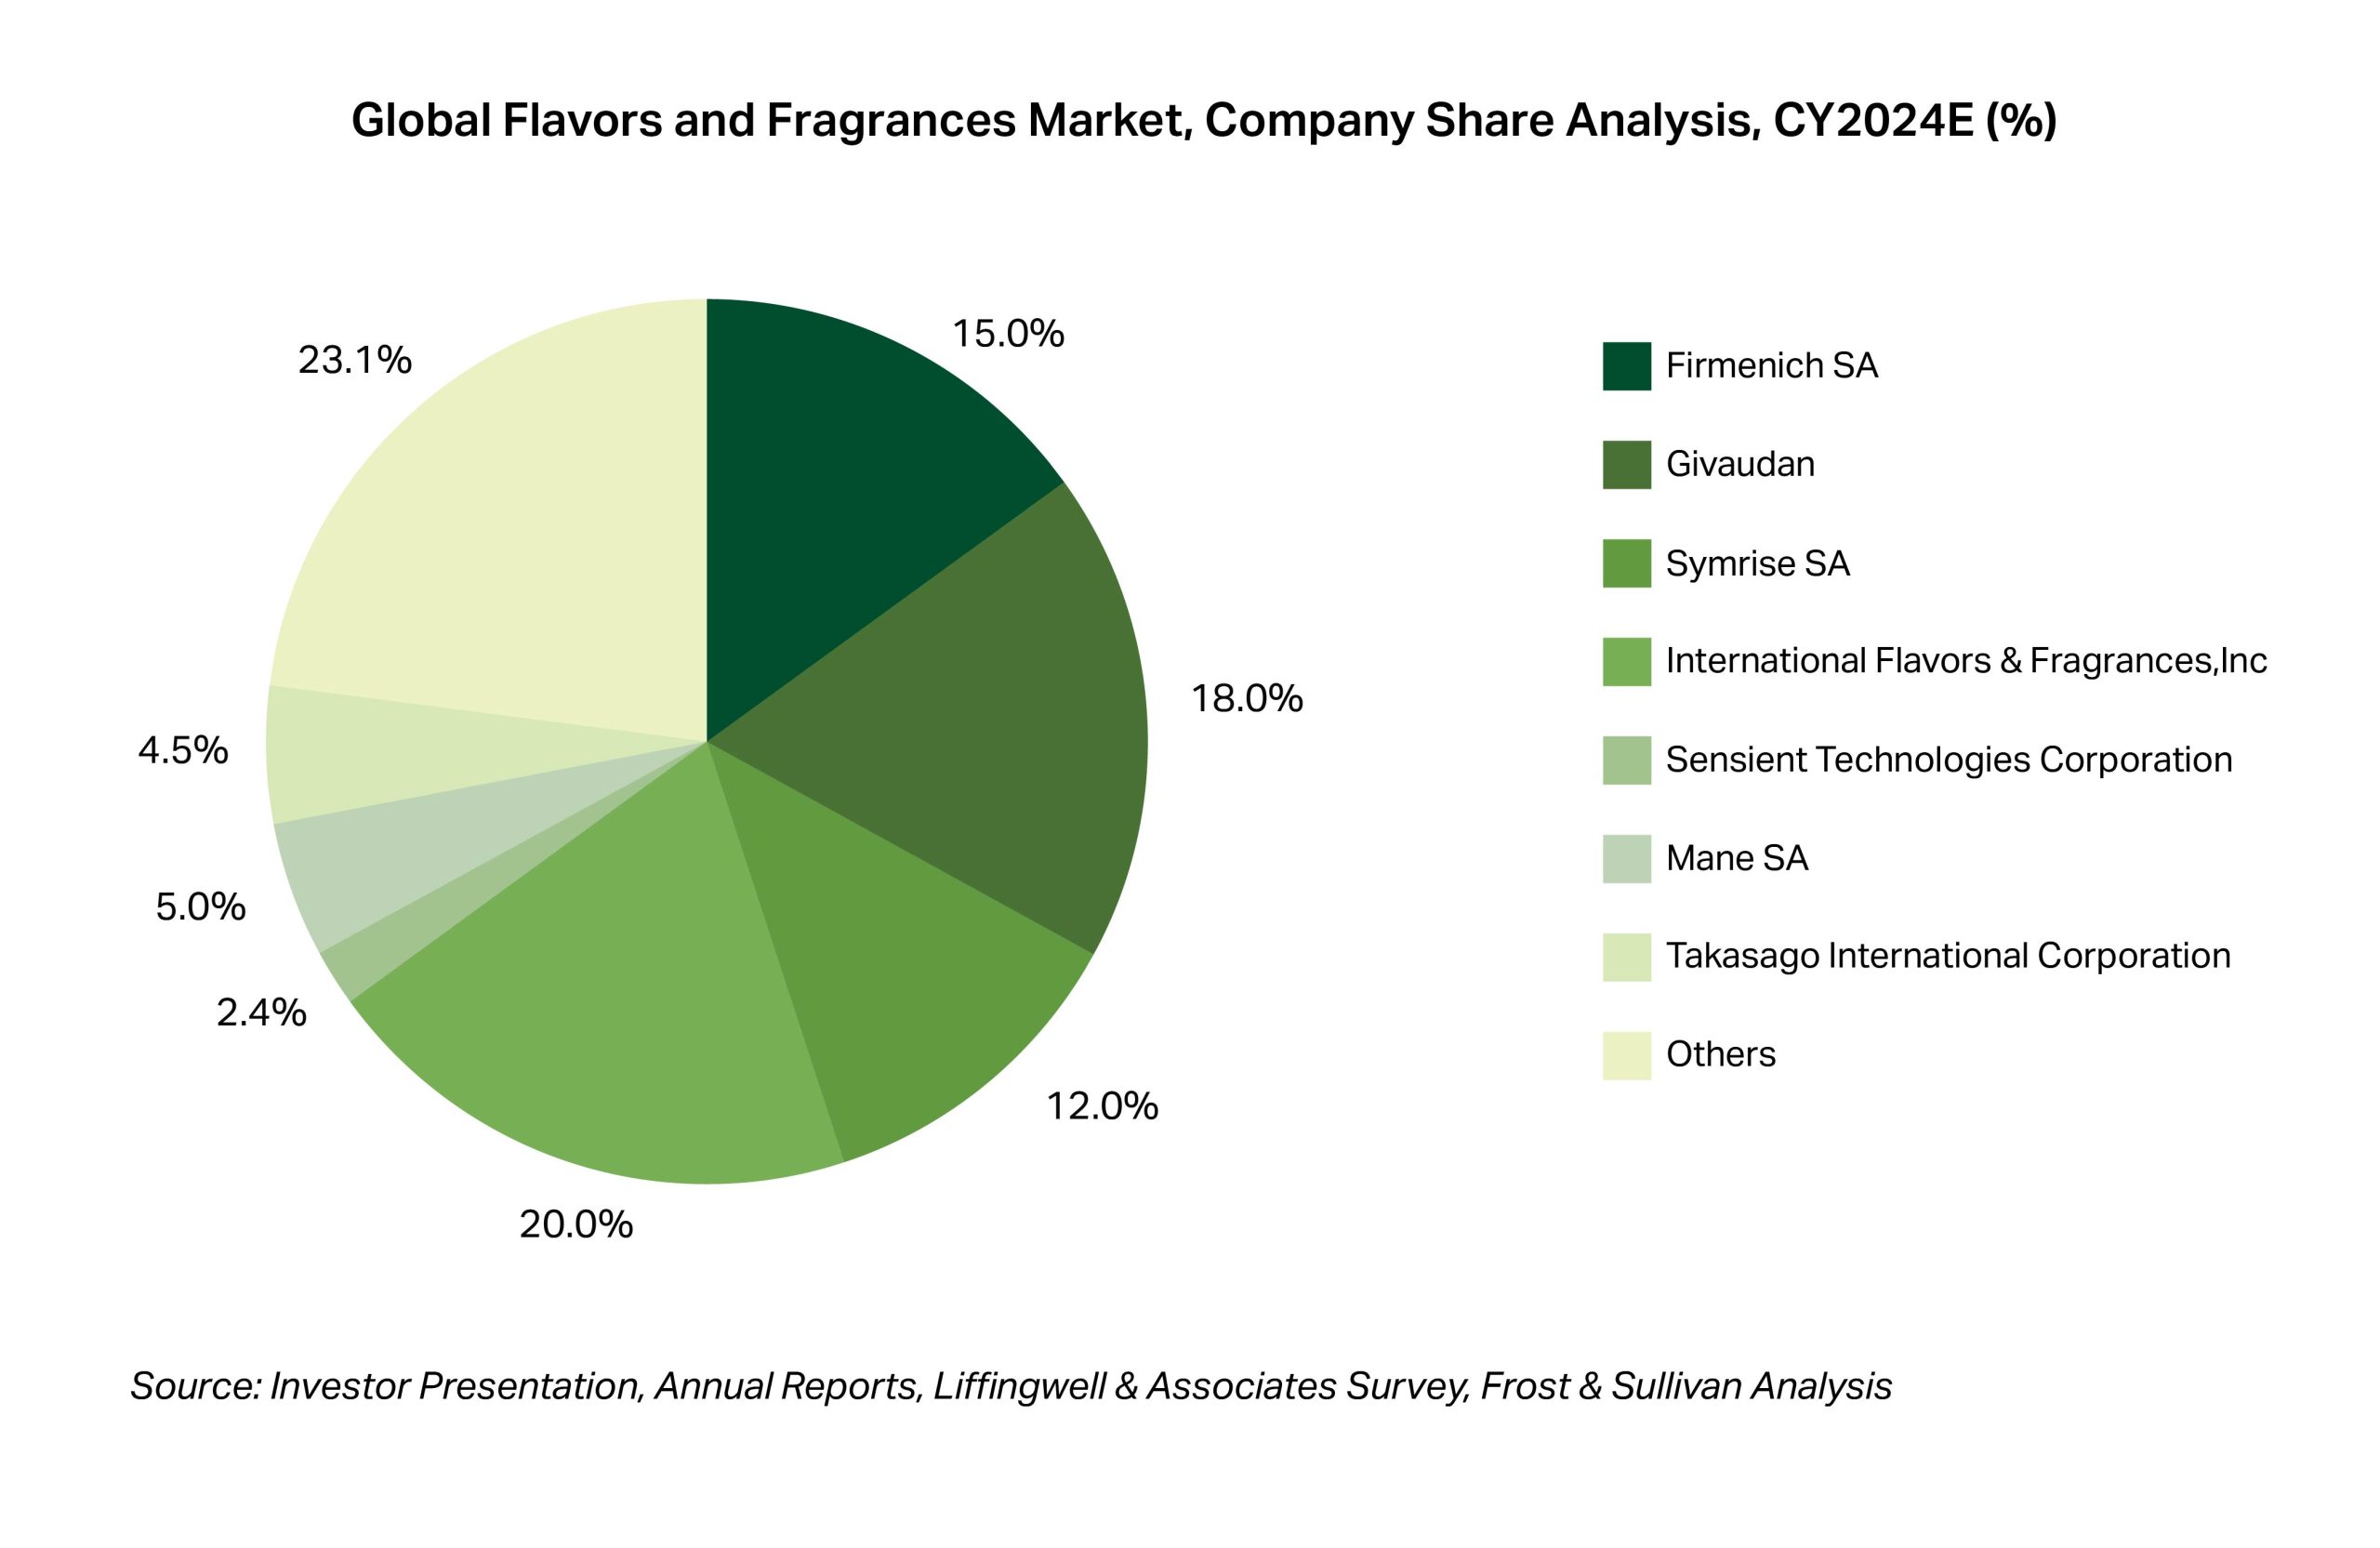
Key Global Players
The global Flavors & Fragrances market is highly consolidated, with the Top 5 players commanding nearly 67% of total industry revenues.
India’s Historic Bond with F&F
India’s fragrance heritage dates back centuries, long before modern aroma chemical processes. In the 16th century, Mughal Empress Noor Jehan discovered rose oil when droplets formed on a canal filled with rose petals. This attār-e-gulab became central to perfumery, with pure rose oil now costing up to ₹23 lakh per litre, as 40 kg of petals yield just 300 grams of oil.
India’s connection to jasmine, particularly Jasminum sambac, is equally significant. Known for its sweet aroma, jasmine oil is a prized extract, trading at ₹15 lakh per litre. This rich tradition in fragrance has since expanded globally.
India F&F market
The Indian Flavors and Fragrances market is estimated at USD 2.7 billion in 2025 and is projected to reach USD 4.1 billion by 2030, growing at a CAGR of 8.5% over the forecast period.
Unlike developed markets, formulated flavors and fragrances have a smaller share in India. Instead, there is a higher demand for aroma chemicals and essential oils, primarily driven by the unique incense stick market, which has specific fragrance preferences. Essential oils, in particular, are expected to experience the fastest growth, with a CAGR of 8.8%. Their popularity is driven by their natural, eco-friendly nature and health benefits, making them the preferred choice for many consumers. India holds a strong position in the global market, especially for natural ingredient supply, with a significant export focus.
For Instance: India is the world’s leading producer of mint oil, accounting for over 80% of global supply. It is also the top processor of mint-derived aroma chemicals, such as menthol and menthone. In FY24, India’s mint oil market was valued at USD 456 million, representing 58% of the global market, with a production volume of 34,000 tonnes.
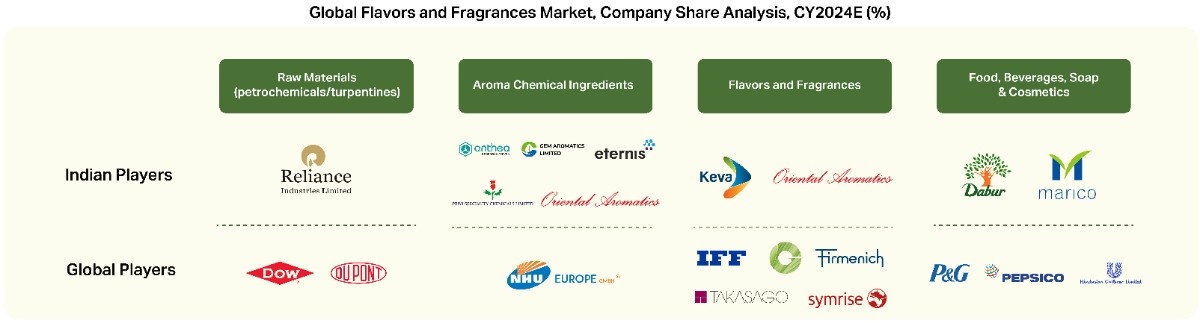
Why do we find this interesting:
1) Sticky customer:
The formulated flavors and fragrances (F&F) segment is largely controlled by global suppliers, who have established significant entry barriers through extensive R&D investments, robust intellectual property protections, and powerful brand identities. FMCG companies are hesitant to change suppliers, as altering fragrance or flavor profiles could compromise customer loyalty.
2) Long-term demand visibility:
The F&F industry relies heavily on long-term contracts, particularly in formulation and aroma chemicals, where high switching costs—due to product approvals and regulatory requirements—ensure stable, ongoing demand.
3) Supply chain shift to India:
Global companies are increasingly shifting from in-house production to outsourcing to Indian companies, attracted by better economies of scale (almost 30-40% reduced production cost). This move allows them to maintain intellectual property protection while benefiting from cost efficiencies and high-quality production capabilities offered by Indian suppliers.
4) Premiumization tailwinds:
Global and domestic consumers are increasingly choosing products with ‘natural’, ‘clean label’, and ‘sustainable’ credentials. These claims allow F&F inputs to command a 15–30% price premium over conventional variants. Market segments like natural essential oils, fermentation-based aroma actives, and plant-derived molecules are growing at 2–3x the industry average.
5) Green compliance premium:
Companies that have adopted green processes, such as low-VOC solvents and bio-based feedstocks, are benefiting from pricing premiums as customers increasingly prioritize sustainability and compliance.
Conclusion
The F& F industry is more than a supplier of pleasant experiences—it is a strategic enabler of consumer trust, brand identity, and product differentiation across the global FMCG landscape. As the world shifts toward naturals, regulatory stringency, and cost rebalancing, India’s deep raw material base, process know-how, and growing R&D capabilities position it not just as a supplier—but as a partner of choice. What was once an artisanal legacy of roses and resins is now evolving into a high-margin, IP-driven export story.
For long-term investors, this is a space where sensory value translates into financial value—with predictable cash flows, expanding global interest, and room for both consolidation and innovation. The invisible architects of taste and scent are no longer operating in the background—they are stepping into the spotlight.
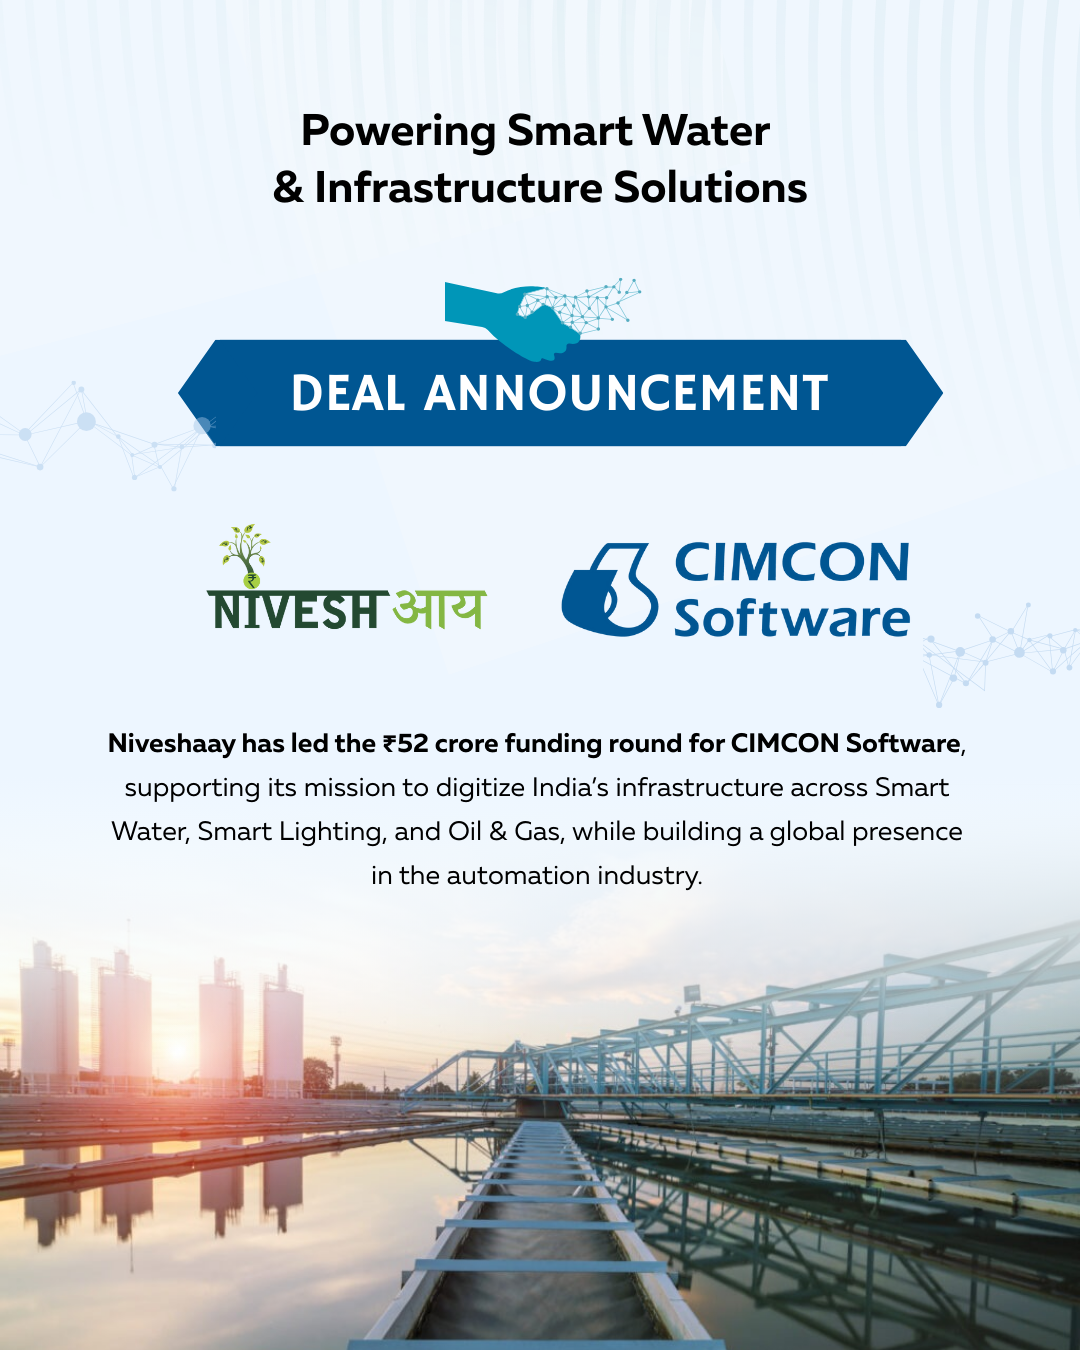
Electronic Manufacturing Services
Powering Intelligence in Industrial Automation- CIMCON Software India Pvt. Ltd.
We’re excited to share that Niveshaay led the ₹52 Cr funding round for @CIMCONsoftware, a pioneer in Smart Water, Smart Lighting, and Oil & Gas automation.
India’s water-automation market is scaling fast as utilities shift from manual to data-driven systems — a ₹5,000+ Cr opportunity in the making.
Founded in 1988, CIMCON has built its own RTUs and SCADA software. With ₹100+ Cr revenue in FY25 and 30%+ EBITDA margins, it combines strong IP moat, deep expertise, and scalable economics to drive India’s infrastructure digitization.
Niveshaay featured on:

Electric Vehicle & Ancillaries
Energy’s Next Frontier : Inside RE+ 2025
This year, we had the chance to attend RE+ in Las Vegas, where key players from the renewable energy sector gathered to discuss how to meet rising energy demand and ensure grid stability. One theme stood out: Battery Energy Storage Systems (BESS)

This year, we had the chance to attend RE+ in Las Vegas, where key players from the renewable energy sector gathered to discuss how to meet rising energy demand and ensure grid stability. One theme stood out: Battery Energy Storage Systems (BESS)🔋.
BESS is powering grid stability and meeting AI-driven energy demand — set to grow sixfold in the next five years. ⚡️
At RE+ 2025, global leaders showcased next-gen battery tech — from Ampace’s semi-solid LFP cells to Fluence’s U.S.-made systems, Samsung SDI’s containerized units, CATL’s sodium-ion batteries, and WeLion’s semi-solid batteries powering EVs. 🚗
Key takeaways from RE+ event-
AI workloads are reshaping energy demand and – Storage is the answer!
• Power demand is surging, led by data centers and AI workloads that create sharp,
unpredictable spikes in consumption.
• Traditional solutions like nuclear or thermal will take 5–8 years to come online, leaving
a near-term capacity deficit.
• At the same time, electricity has become more expensive—up about 20% since 2020—
and in crowded markets, getting a new grid connection can take over 3 years, often
requiring costly T&D upgrades of $50–150M for each data center.
• This is driving the need for Battery Energy Storage Systems (BESS) + Solar, which
provide faster power availability, lower costs, and flexible, scalable backup.
Global BESS capacity surges 4x — Poised for sixfold growth ahead:
Global BESS capacity has already grown 4x from about 75-80 Gwh in 2022 to ~320-330Gwh, reflecting how critical storage has become to balance grids and manage new demand from renewables and data centers. Looking ahead, the momentum is only accelerating — installed capacity is projected to grow another sixfold within the next five year.
China’s dominance in the BESS supply chain:
Based on 2024 data from Benchmark Mineral Intelligence, the global Battery Energy Storage
System (BESS) supply chain is profoundly dominated by China. This control spans every stage, starting with key materials where China commands 88% of the cathode market and 92% of the anode market. The dominance is even more pronounced in LFP chemistry, with China producing 99% of LFP cathodes and 100% of all LFP cells.
This upstream supremacy extends downstream, where China supplies 77% of the world’s BESS systems, establishing near-total control over the LFP battery ecosystem.
At the same time, this concentration opens a strategic window for India. By scaling rapidly,
Indian companies can not only meet domestic energy needs but also emerge as global suppliers, providing the world with a much-needed alternative to its dependence on China.
Diversifying storage: Emerging alternatives to lithium-ion:
• The global BESS landscape is rapidly diversifying beyond lithium-ion. Out of 8,000
tracked projects, more than 340 are based on alternative chemistries, with a strong
pipeline building up for the next few years.
• Flow batteries dominate with 45 GWh of announced capacity while metal-air
technologies account for 10 GWh.
• Sodium-based batteries are also gaining traction with 7 GWh in the pipeline, with
heavyweights like CATL entering the space. Zinc batteries contribute another 1 GWh,
and “other” chemistries such as lead-acid, liquid metal, and nickel hydride add 6 GWh.
Interestingly, the pipeline for these non-Li-ion projects is expected to peak in 2025 with 128 projects, before moderating in subsequent years, highlighting a clear industry shift toward long- duration and cost-effective storage solutions to complement conventional lithium-ion dominance.
Declining competitiveness of wind energy:
Falling Battery Energy Storage System (BESS) costs and rising efficiency are reshaping
renewable energy economics. Once a complement to solar, wind is losing ground as BESS
emerges as the preferred option for grid stabilization and balancing intermittent supply.
In regions without strong or consistent wind resources, solar-plus-storage or standalone BESS projects are increasingly favoured. They deploy faster, offer geographic flexibility, and deliver reliable services like frequency regulation, peak shaving, and backup power—advantages over wind farms that demand high capital, favourable sites, and long permitting cycles.
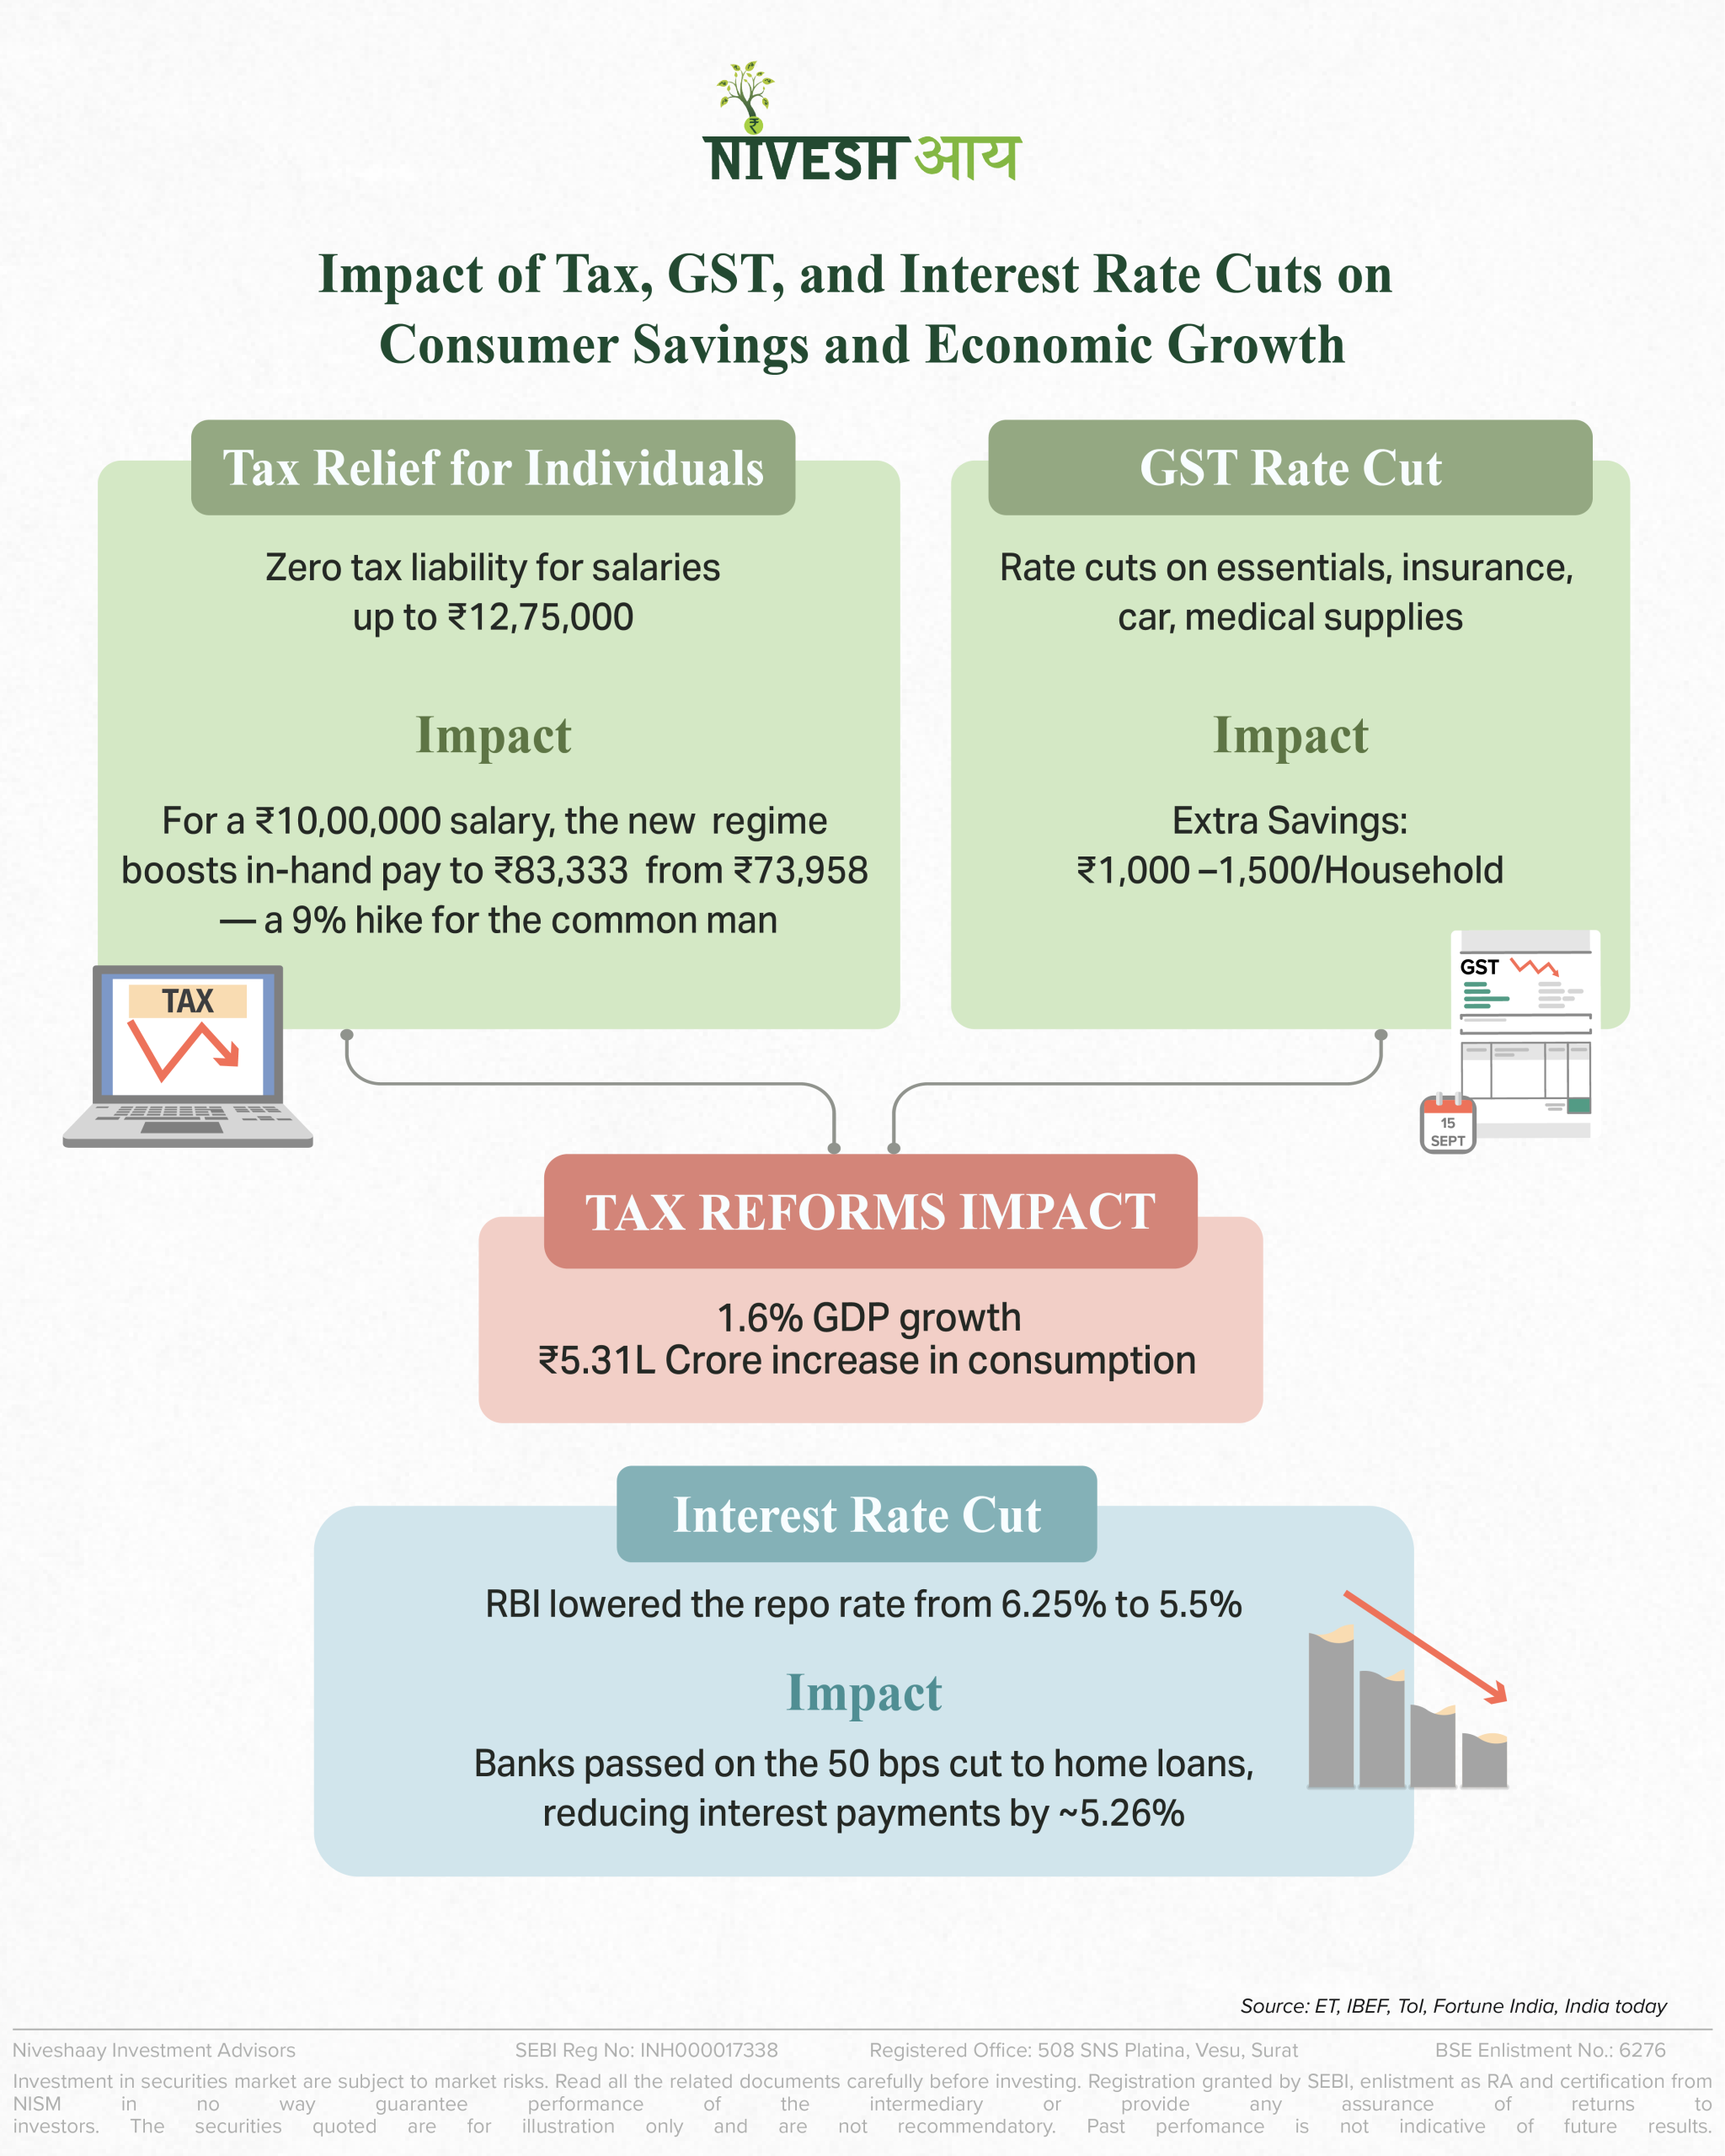
Consumer Durables, Services & Consumption
Impact of Tax cut on Consumption
📈 India’s Consumption Engine is Accelerating!💰Tax cuts and lower interest rates are fueling rising disposable incomes, boosting consumer confidence. Festive and wedding spending reflects this momentum.🛒 The shift to online channels and a growing appetite for luxury products is driving discretionary spending across both rural and urban markets—signaling a robust consumption boom across the country.
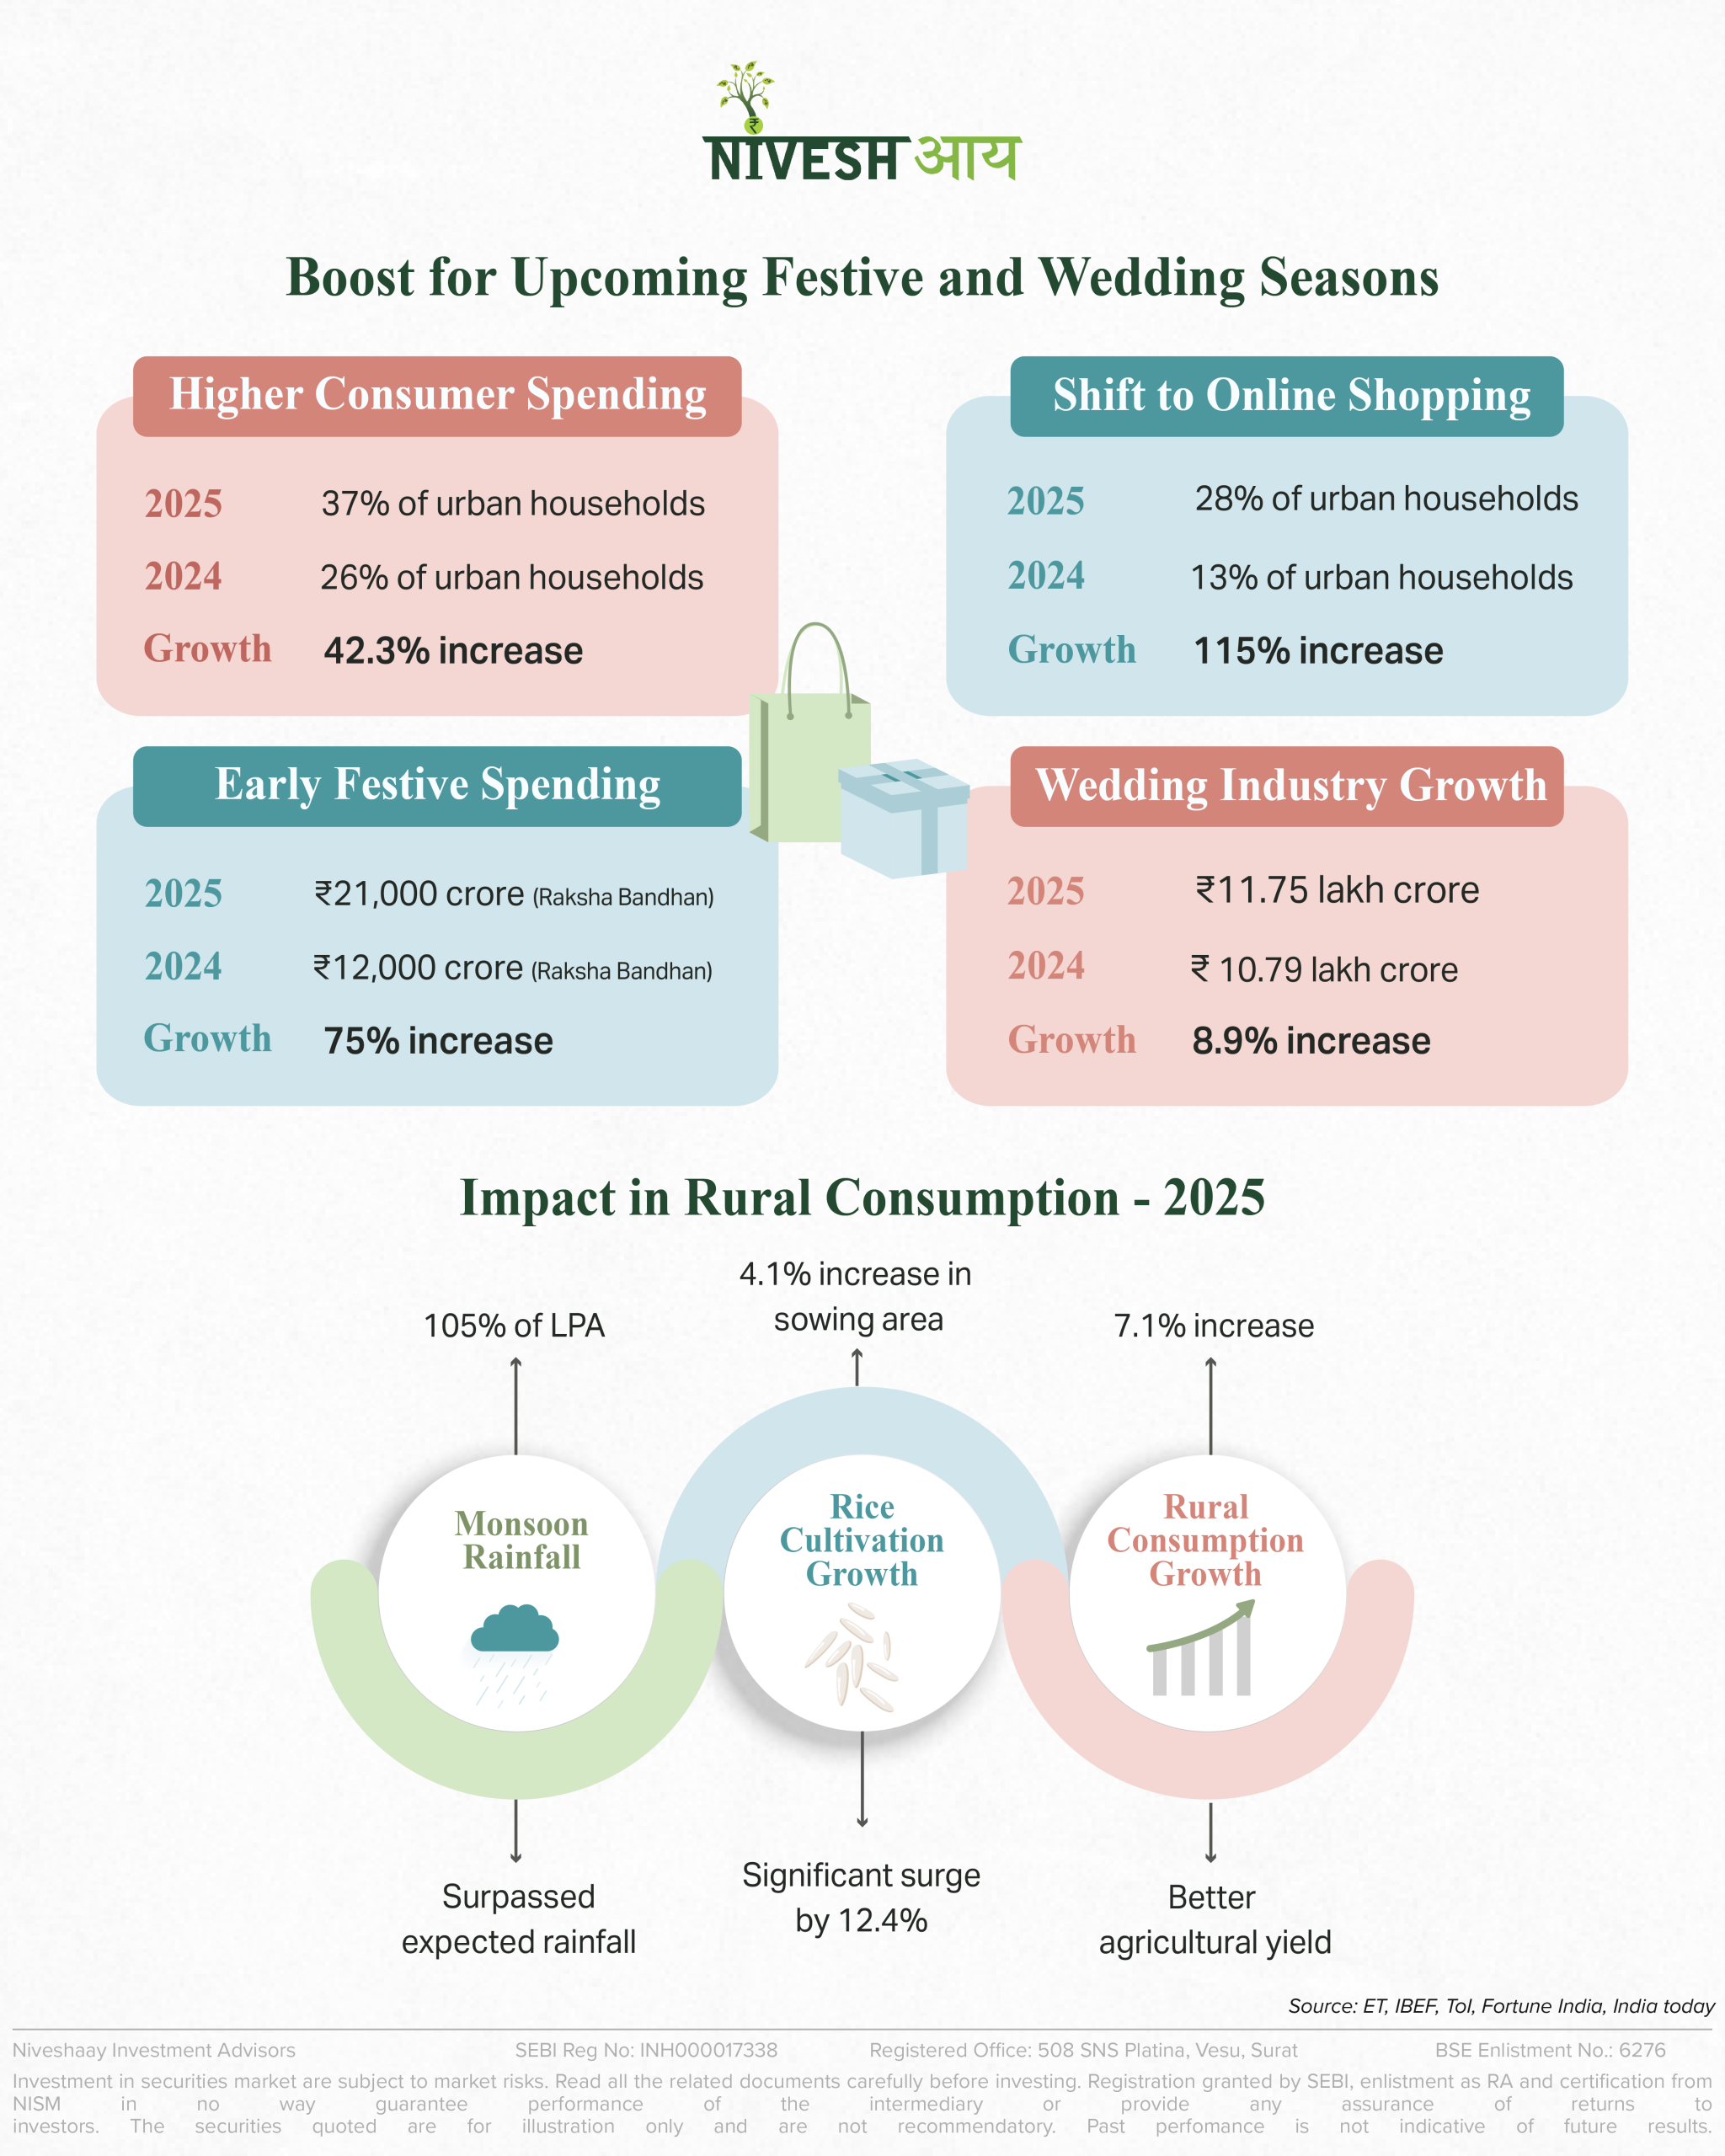
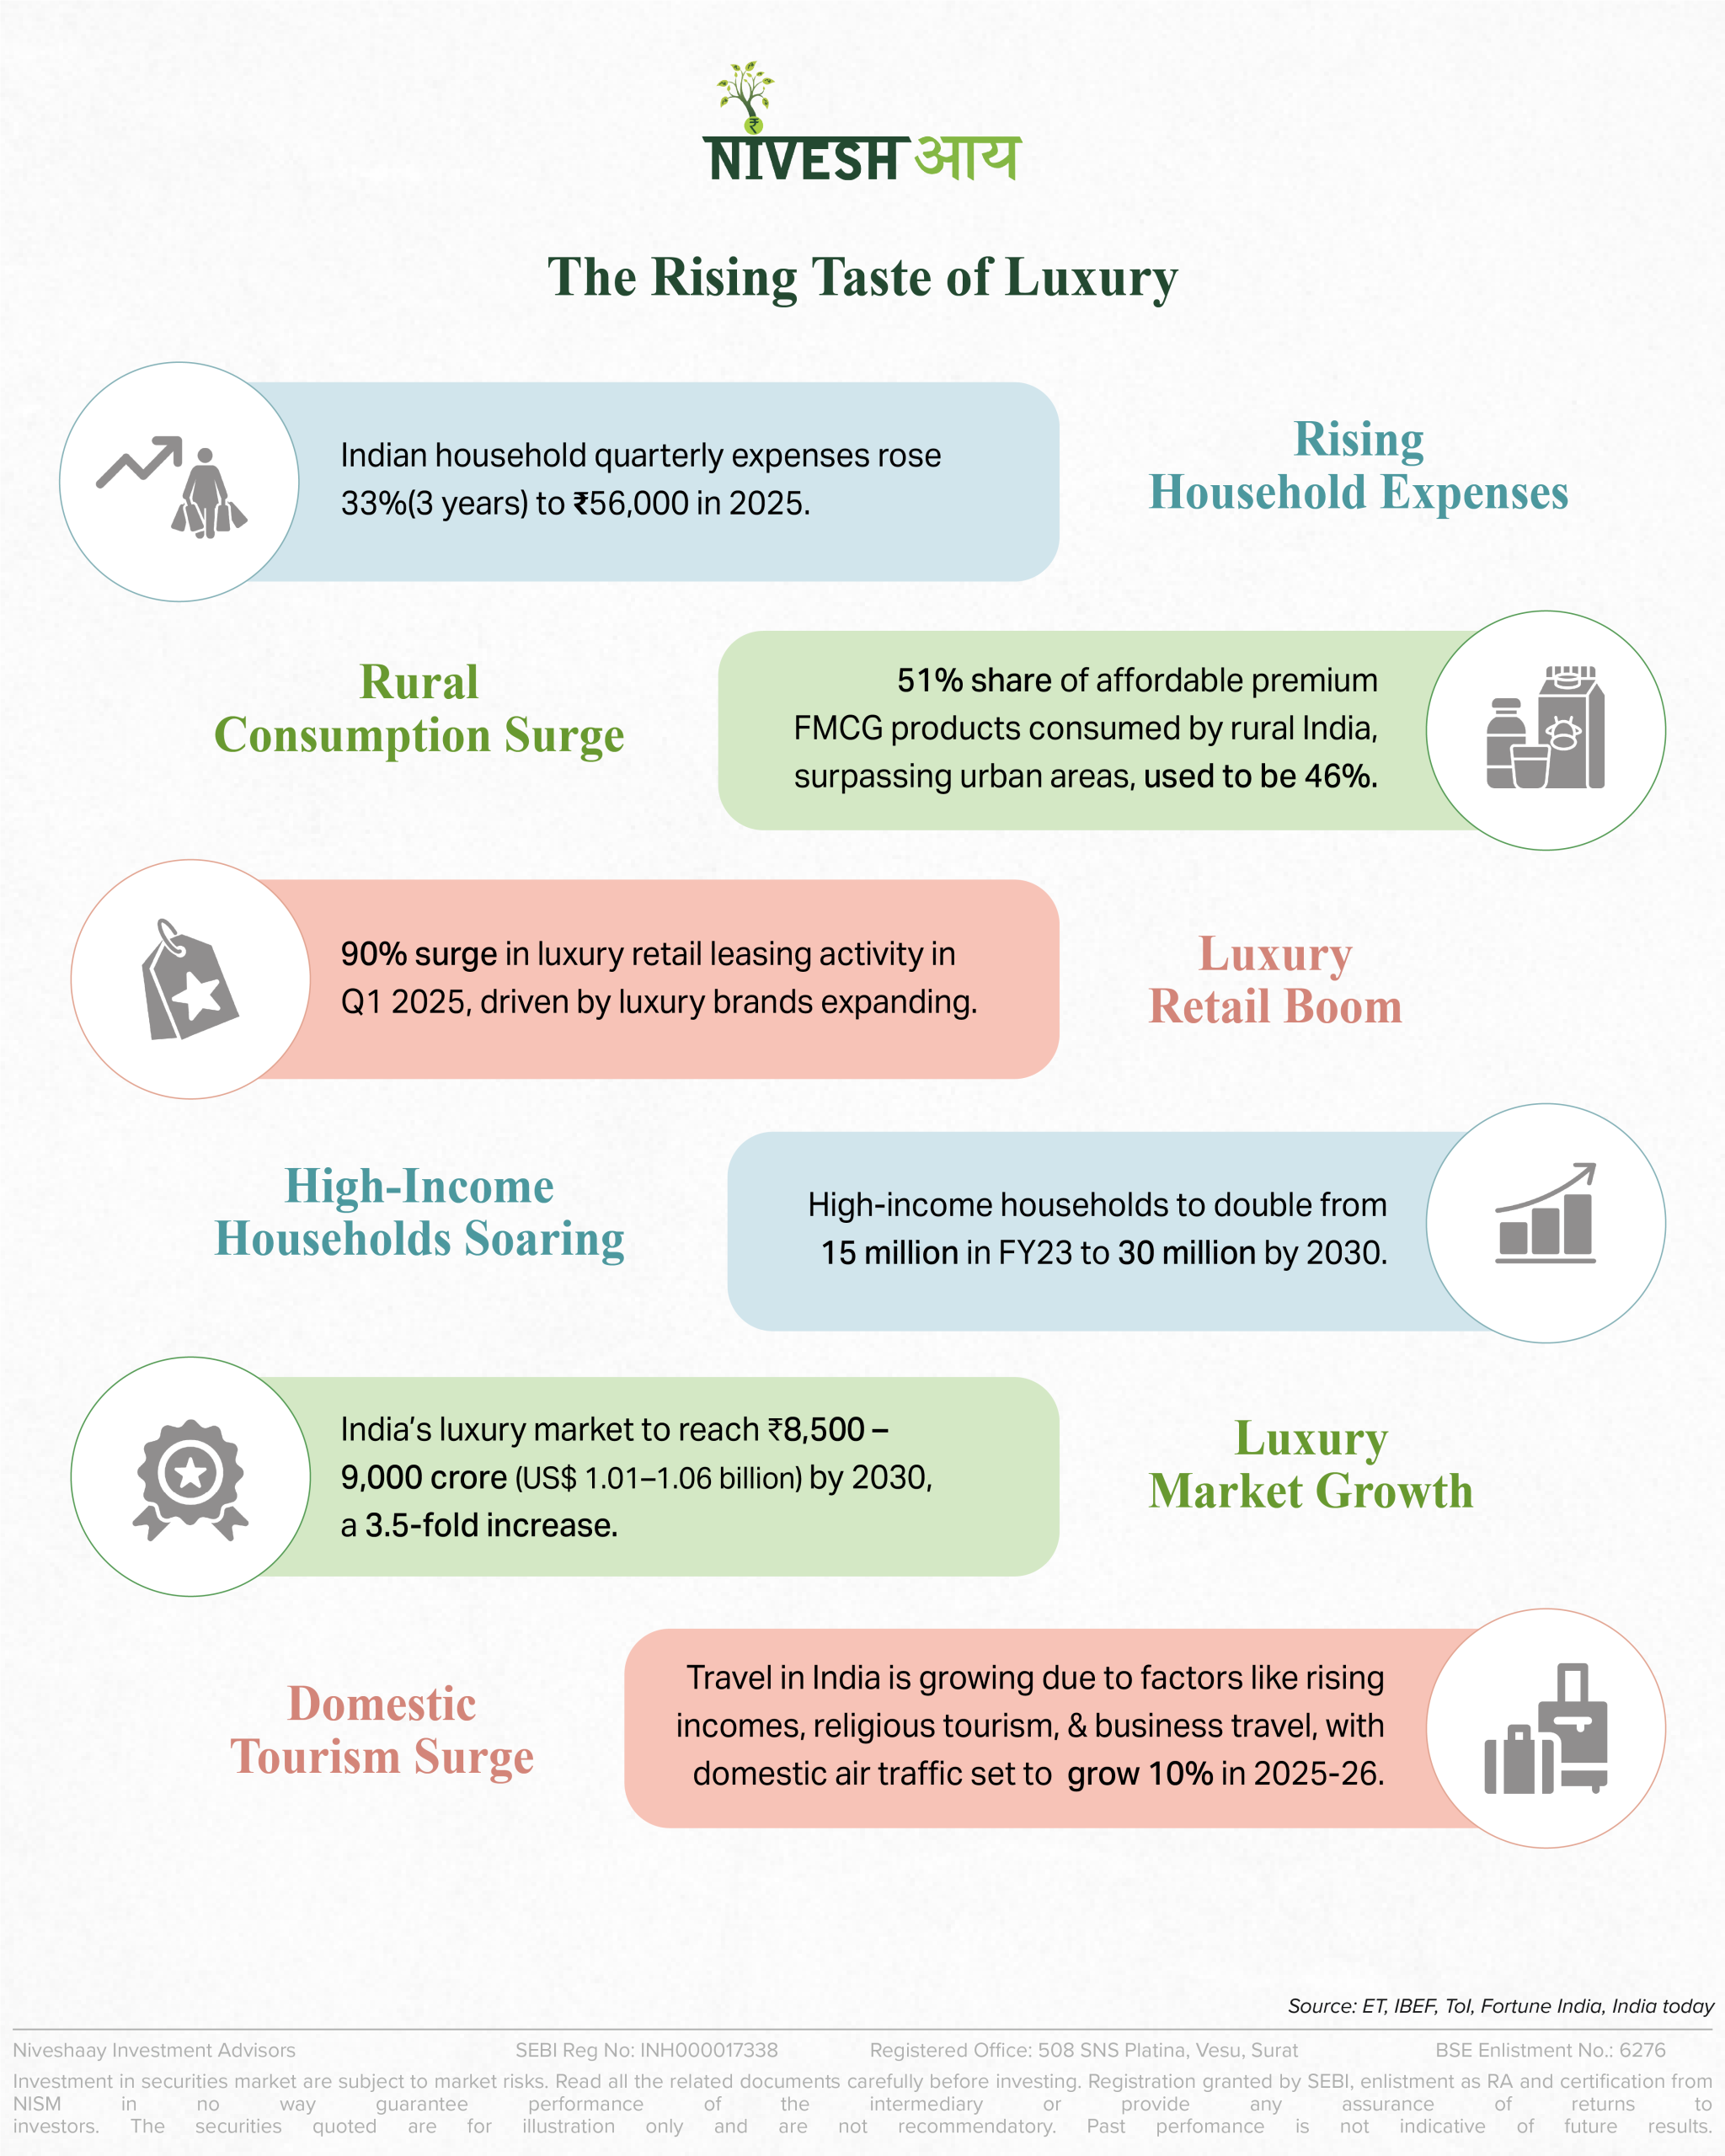
📈 India’s Consumption Engine is Accelerating!
💰Tax cuts and lower interest rates are fueling rising disposable incomes, boosting consumer confidence. Festive and wedding spending reflects this momentum.
🛒 The shift to online channels and a growing appetite for luxury products is driving discretionary spending across both rural and urban markets—signaling a robust consumption boom across the country.

Consumer Durables, Services & Consumption
From Pent-Up Demand to Sustained Momentum: The Rise of India’s Travel Industry
Remember when planning a holiday meant sitting with a notepad, counting leave days, booking trains months ahead, and saving hotel stays for once-a-year trips? Travel used to be a carefully budgeted, once-in-a-while affair.

Remember when planning a holiday meant sitting with a notepad, counting leave days, booking trains months ahead, and saving hotel stays for once-a-year trips? Travel used to be a carefully budgeted, once-in-a-while affair.
Fast forward to today, journeys has slipped into our everyday rhythm. Airports hum with crowds even on weekdays, and pilgrimage like Kedarnath or Ayodhya are seeing record footfalls. The change is driven by many forces working together: rising disposable incomes, supportive tax cuts, new airports and better infrastructure leading to frequent vacations, workcations, weddings, or quick road trips.
What began as post-pandemic “revenge travel” has become a lasting transformation reshaping aviation, hospitality, and consumption.
Levers that are rewriting India’s travel and tourism industry:
1) Government Push: From Tax Cuts to Increasing Airports
The government’s recent tax rate cuts have handed middle-class households an extra 50,000–1,00,000 per year in disposable income, which is a direct boost to their spending power. And unlike the past, when such savings might have gone into gold or fixed deposits, today’s consumers are increasingly channeling it into experiences. A long weekend in Goa, a family trip by air instead of train, or an upgraded hotel stay has become not just aspirational, but achievable.
This marks a decisive shift in how Indians allocate their incremental income—from necessities to lifestyle and travel, creating a lasting tailwind for the tourism economy.
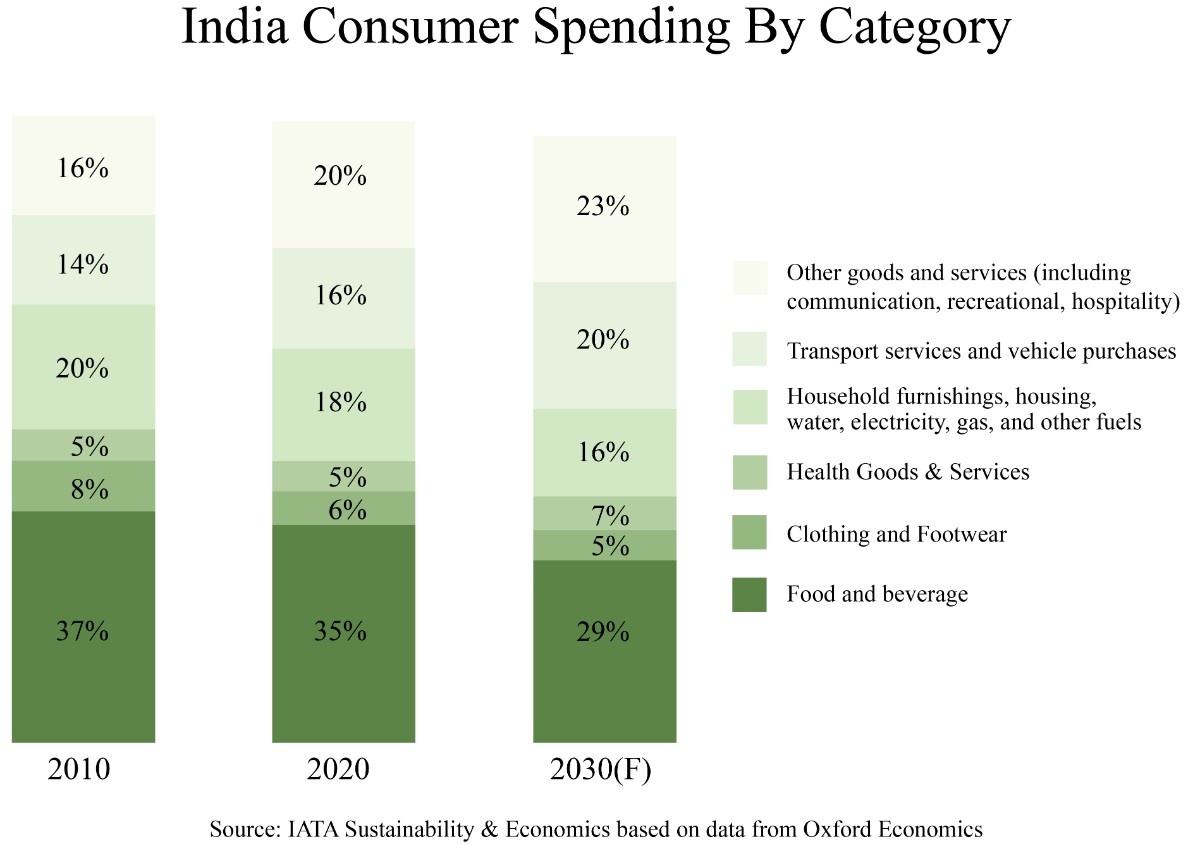
The shift is also visible in consumer spending patterns. According to Oxford Economics and IATA Sustainability & Economics data, India will witness increased expenditure in communication, recreational activities, and hospitality. This shows a structural reallocation of budgets from necessities to experiences.
These tax cuts are more than temporary relief—they are demand accelerators. Every additional rupee in the consumer’s hand nudges spending toward travel, leisure, and lifestyle experiences, powering continued growth for the industry.
Apart from tax reforms, the government is also actively boosting tourism through schemes—most notably the UDAN initiative, which has made flying affordable and accessible by linking smaller towns to metros. Complementary programs like the 2,541 crore Budget allocation, Swadesh Darshan 2.0, and PRASHAD further underline tourism as a priority.
India’s operational airports have grown from 74 in 2014 to 160+ in FY25, and the government aims to add another 50 airports in the next five years, unlocking new demand centers. The focus is not just on building new facilities but also on modernizing existing airports—improving capacity, passenger experience, and efficiency.
This ensures the system can handle India’s surge in air travel demand. Each new airport opens up fresh markets for hotels, restaurants, and transport services, especially in Tier-2 and Tier-3 cities.
2) Increasing Domestic Air Travel
India now ranks as the 3rd largest air transport market in the world, with an increase in the number of routes and flights – 37.5% of them are newly added routes that had not been operated in the past five years.
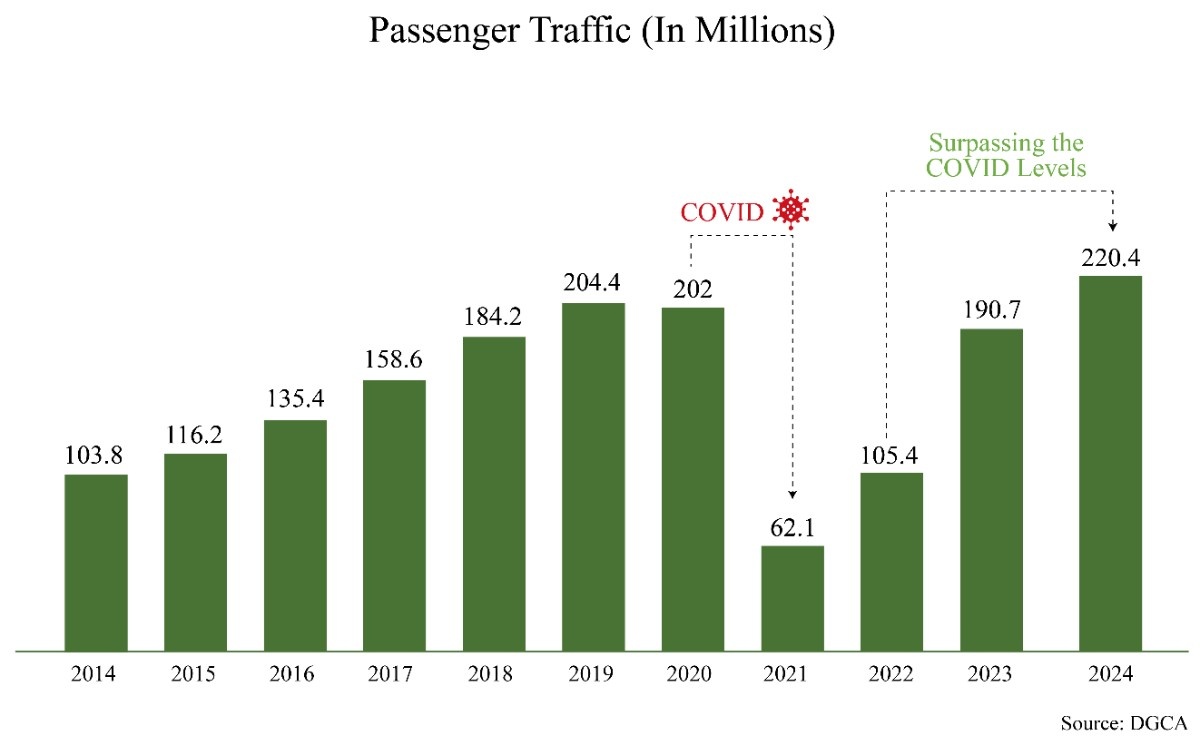
One of the strongest indicators of sustained travel momentum in India is the steady rise in domestic air passenger traffic. After peaking at 204 million passengers in 2019, the aviation sector experienced a sharp decline during the pandemic, reaching a low of just 62 million in 2021. However, the recovery has been swift and decisive. Passenger numbers rebounded to 190 million in 2023 and reached an all-time high of 220 million in 2024, surpassing pre-COVID levels.
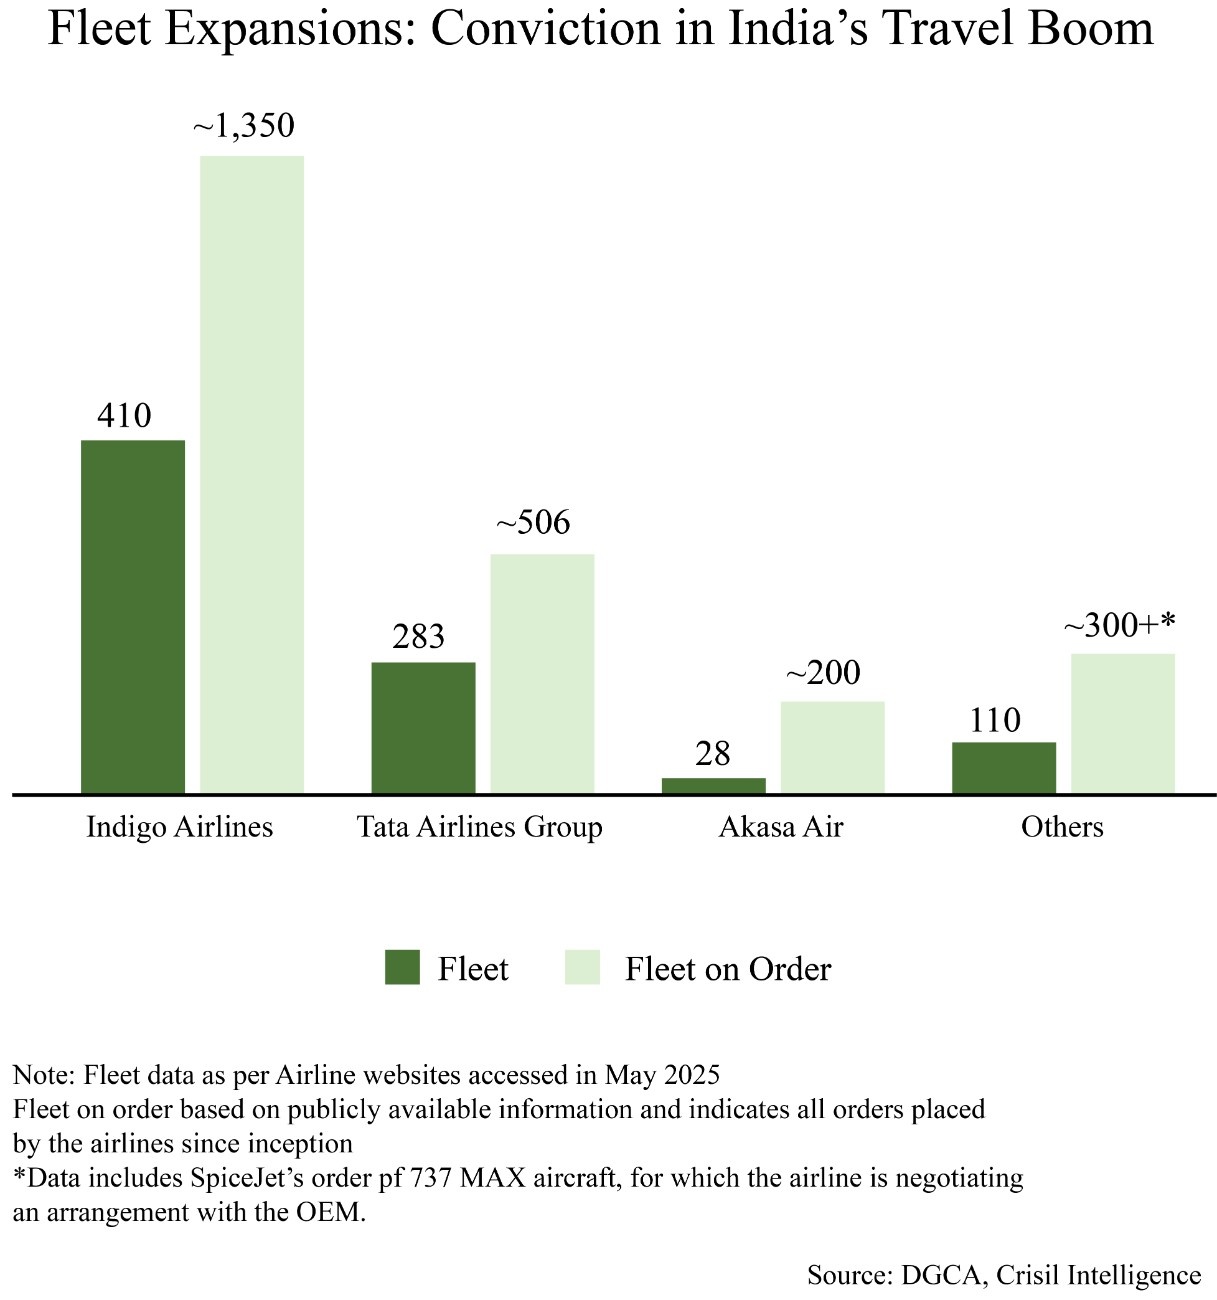
Low-cost carriers are at the center of this transformation, converting first-time flyers into frequent travelers by making flying affordable and accessible. With capacity scaling up and regional penetration widening, air travel is steadily becoming the default choice for business, leisure, and even short-haul trips—turning India into one of the world’s fastest-growing aviation markets.
The aircraft orders placed by Indian carriers also reflects conviction that air travel demand will keep compounding over the next decade.
3) Pilgrimage Tourism is surging
Spiritual journeys have always held deep cultural and emotional significance in India. What is changing today is the scale, pace, and structure of how people undertake them.
– The 2025 Maha Kumbh Mela in Prayagraj drew over 66 crore devotees by February alone, making it one of the largest religious gatherings in history.
– In Ayodhya, more than 11 crore visitors arrived in just the first half of 2024, following the inauguration of the Ram Mandir and rapid infrastructure development.
– The Char Dham Yatra continues to see record participation, with over 30.8 lakh pilgrims visiting Kedarnath and Badrinath in 2024.
– Consider Kedarnath alone—its footfall rose from just 41,000 in 2014 to over 19 lakh in 2023.
These numbers reflect not a new interest in pilgrimage, but a growing ecosystem around it—marked by digital registrations, planned itineraries, and better access. Spiritual travel is now more structured, more accessible, and more visible than ever before.
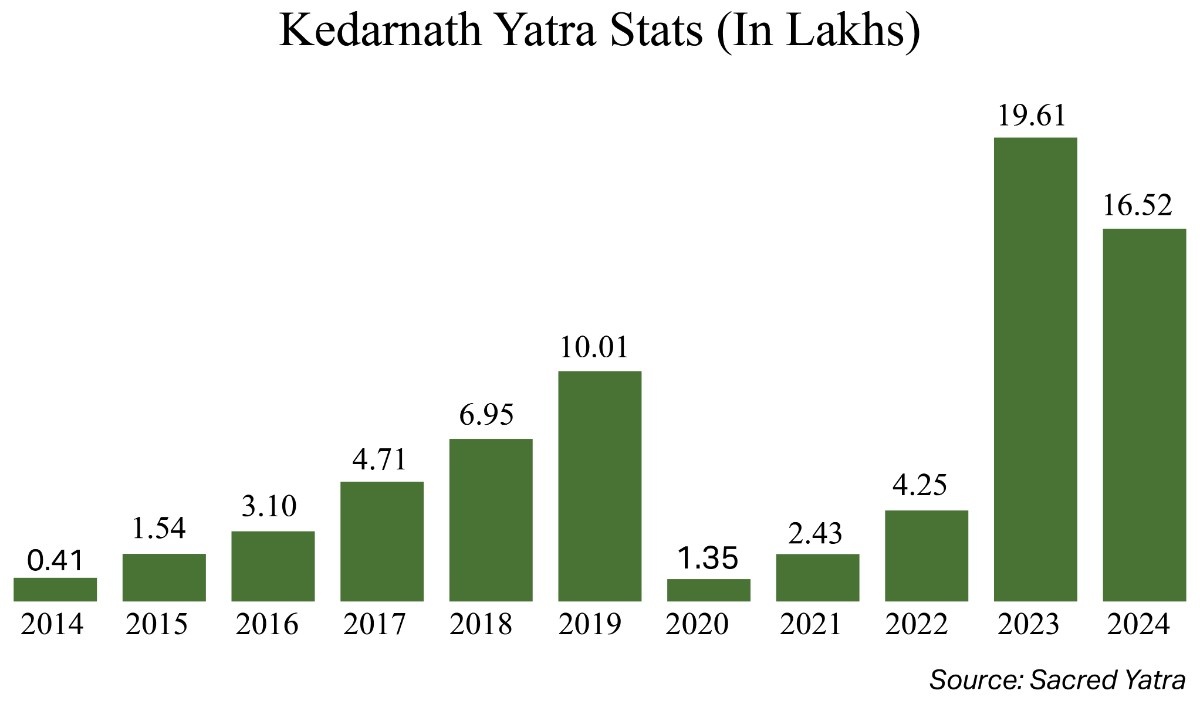
4) India’s MICE (Business Travel) is Booming
Business travel in India is picking up. Cities like Hyderabad, Delhi, and Mumbai are constantly hosting conferences, trade fairs, and leadership meets. It’s not just big corporates anymore—even startups, industry groups, and colleges are joining in. This steady flow of events is pushing demand for hotels that offer large banquet spaces and are close to convention centres. As a result, many hotel brands are adjusting their offerings to better serve this growing MICE (Meetings, Incentives, Conferences, and Exhibitions) segment.
5) Weddings are no longer just seasonal
Weddings have become a year-round business for hotels in India. With lavish functions now spread across multiple days and destinations, hotel bookings are being made months in advance—not just in peak wedding seasons, but even during off-peak months. Cities like Udaipur, Jaipur, Goa, and even hill stations have turned into go-to wedding spots. From pre-wedding shoots to mehendi and cocktail nights, hotels are offering full-service packages, creating a steady revenue stream. This shift is pushing more hotel brands to invest in larger banquet spaces, outdoor venues, and specialised wedding teams to capture a bigger slice of this booming opportunity.
The Rise of Branded Consumption: Unorganized to Organized Shift
In this entire travel and tourism boom, one of the most positive and structural changes is the shift from unbranded to branded offerings.
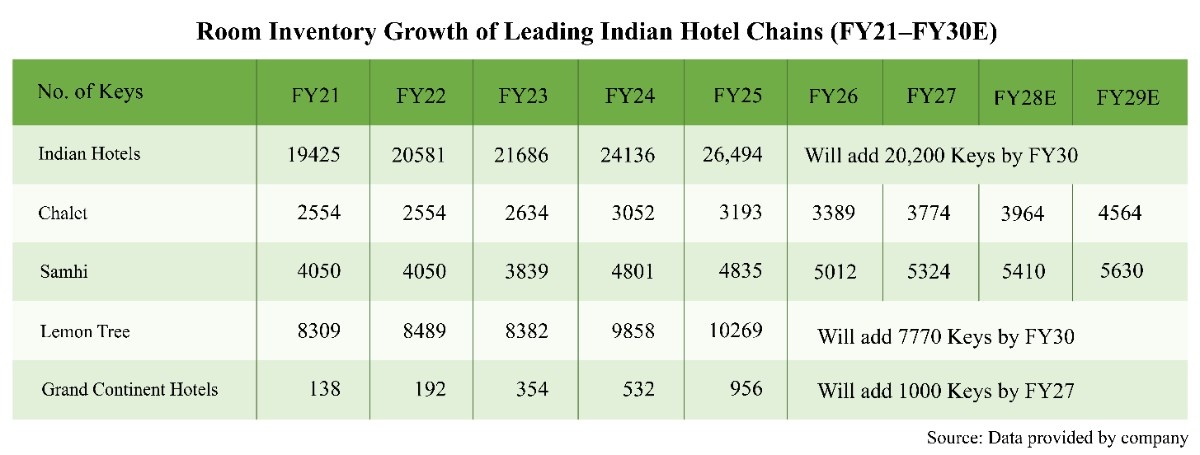
Hotels are steadily moving into the organized space, yet branded rooms still make up only ~35%, leaving significant headroom for growth.
Despite this expansion, India’s branded hotel room penetration remains among the lowest in the world. With just 0.3 branded rooms per 1,000 people, India significantly lags behind the global average of ~2.2 rooms per 1,000 people. This gap highlights the enormous runway for branded supply growth, especially as rising incomes and tourism demand continue to outpace room additions.
What makes this growth story compelling is the composition of new supply. A large part of the pipeline isn’t just greenfield development but also brownfield conversions, where existing unbranded, standalone hotels are brought under established chains like Taj, Vivanta, Ginger (IHCL) or Keys, Aurika, Red Fox (Lemon Tree). This structural shift ensures that as the market penetrates further, the organized share will keep climbing, making branded hospitality the dominant face of Indian travel and tourism in the coming decade.
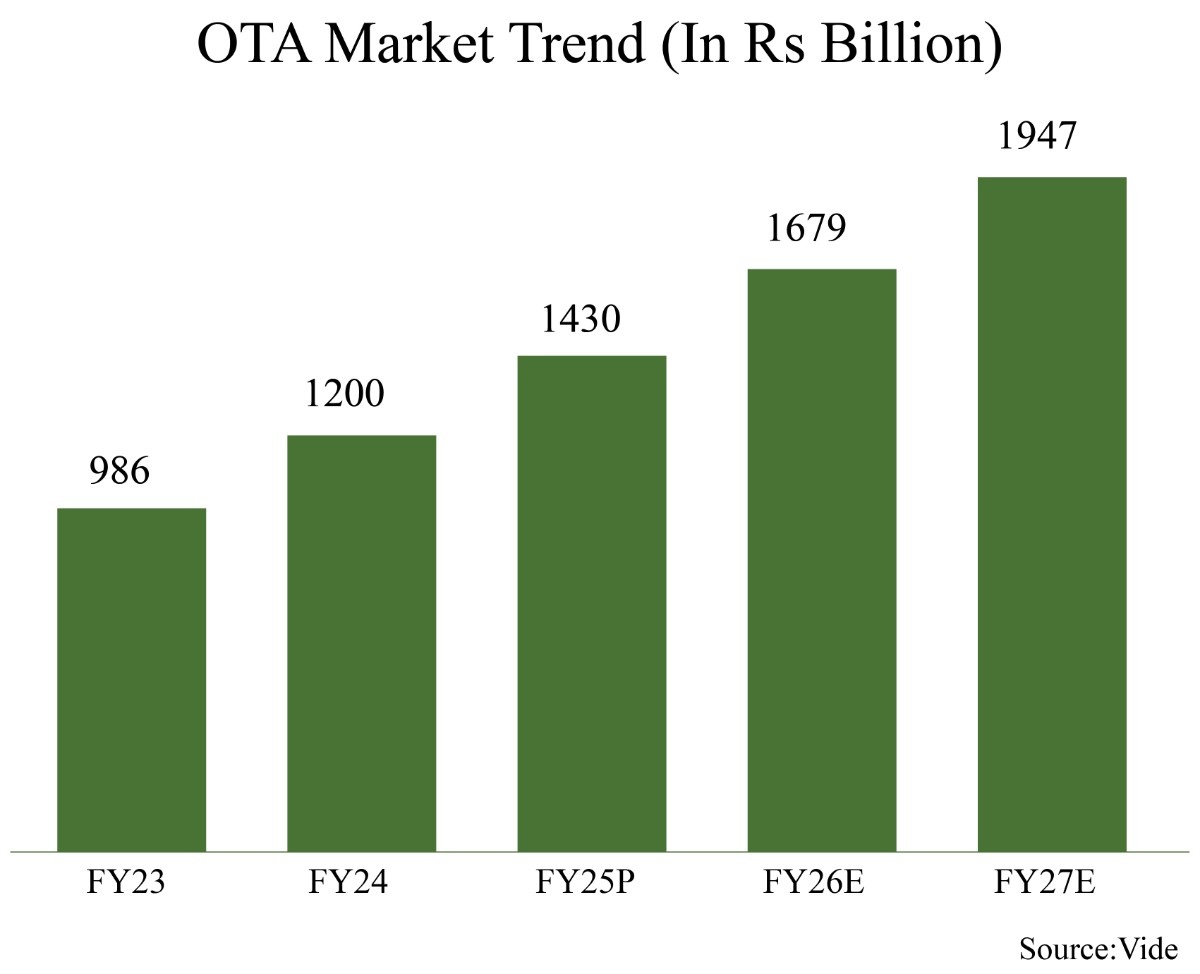
Online Travel Agencies (OTAs) have been at the forefront of the shift from unorganised to organised travel in India, replacing fragmented offline agents with consistency, convenience, and trust. Mobile-first platforms offering instant booking, dynamic pricing, and flexible cancellations have transformed how Indians plan their journeys, making travel more accessible and frequent. This has not only improved the overall user experience but also expanded penetration into Tier-2 and Tier-3 cities. Backed by this convenience, OTAs now account for nearly 68% of India’s online ticketing market, with the segment projected to nearly double from ₹986 crore in FY23 to ₹1,947 crore by FY27E.
Much like the hotel industry’s move from unbranded to branded supply, OTAs are driving the formalisation of travel consumption, ensuring reliability, transparency, and sustained growth for the sector.
The luggage industry is also experiencing a decisive shift from unorganised to organised players. In 2019, 39% of the market was organised, but by 2024 the share of organised players has already risen to 54%, and is projected to climb further to 62% by 2028. This reflects how rising incomes, greater brand awareness, and increased travel frequency are steadily formalising this segment with Tier-II and Tier-III cities emerging as new growth hubs, supported by e-commerce penetration and expanding brand reach.
Whether it’s booking a flight on an OTA, checking into a branded hotel, or carrying a trusted luggage brand, today’s Indian traveler is steadily shifting toward organized and reliable choices. This change is not only fueled by rising incomes and better infrastructure but also by reforms like GST, which have pushed more demand toward compliant, branded players. Travel is no longer just a one-off indulgence—it’s becoming a lifestyle habit, with stronger trust, higher repeat demand, and a clear runway for sustained growth.
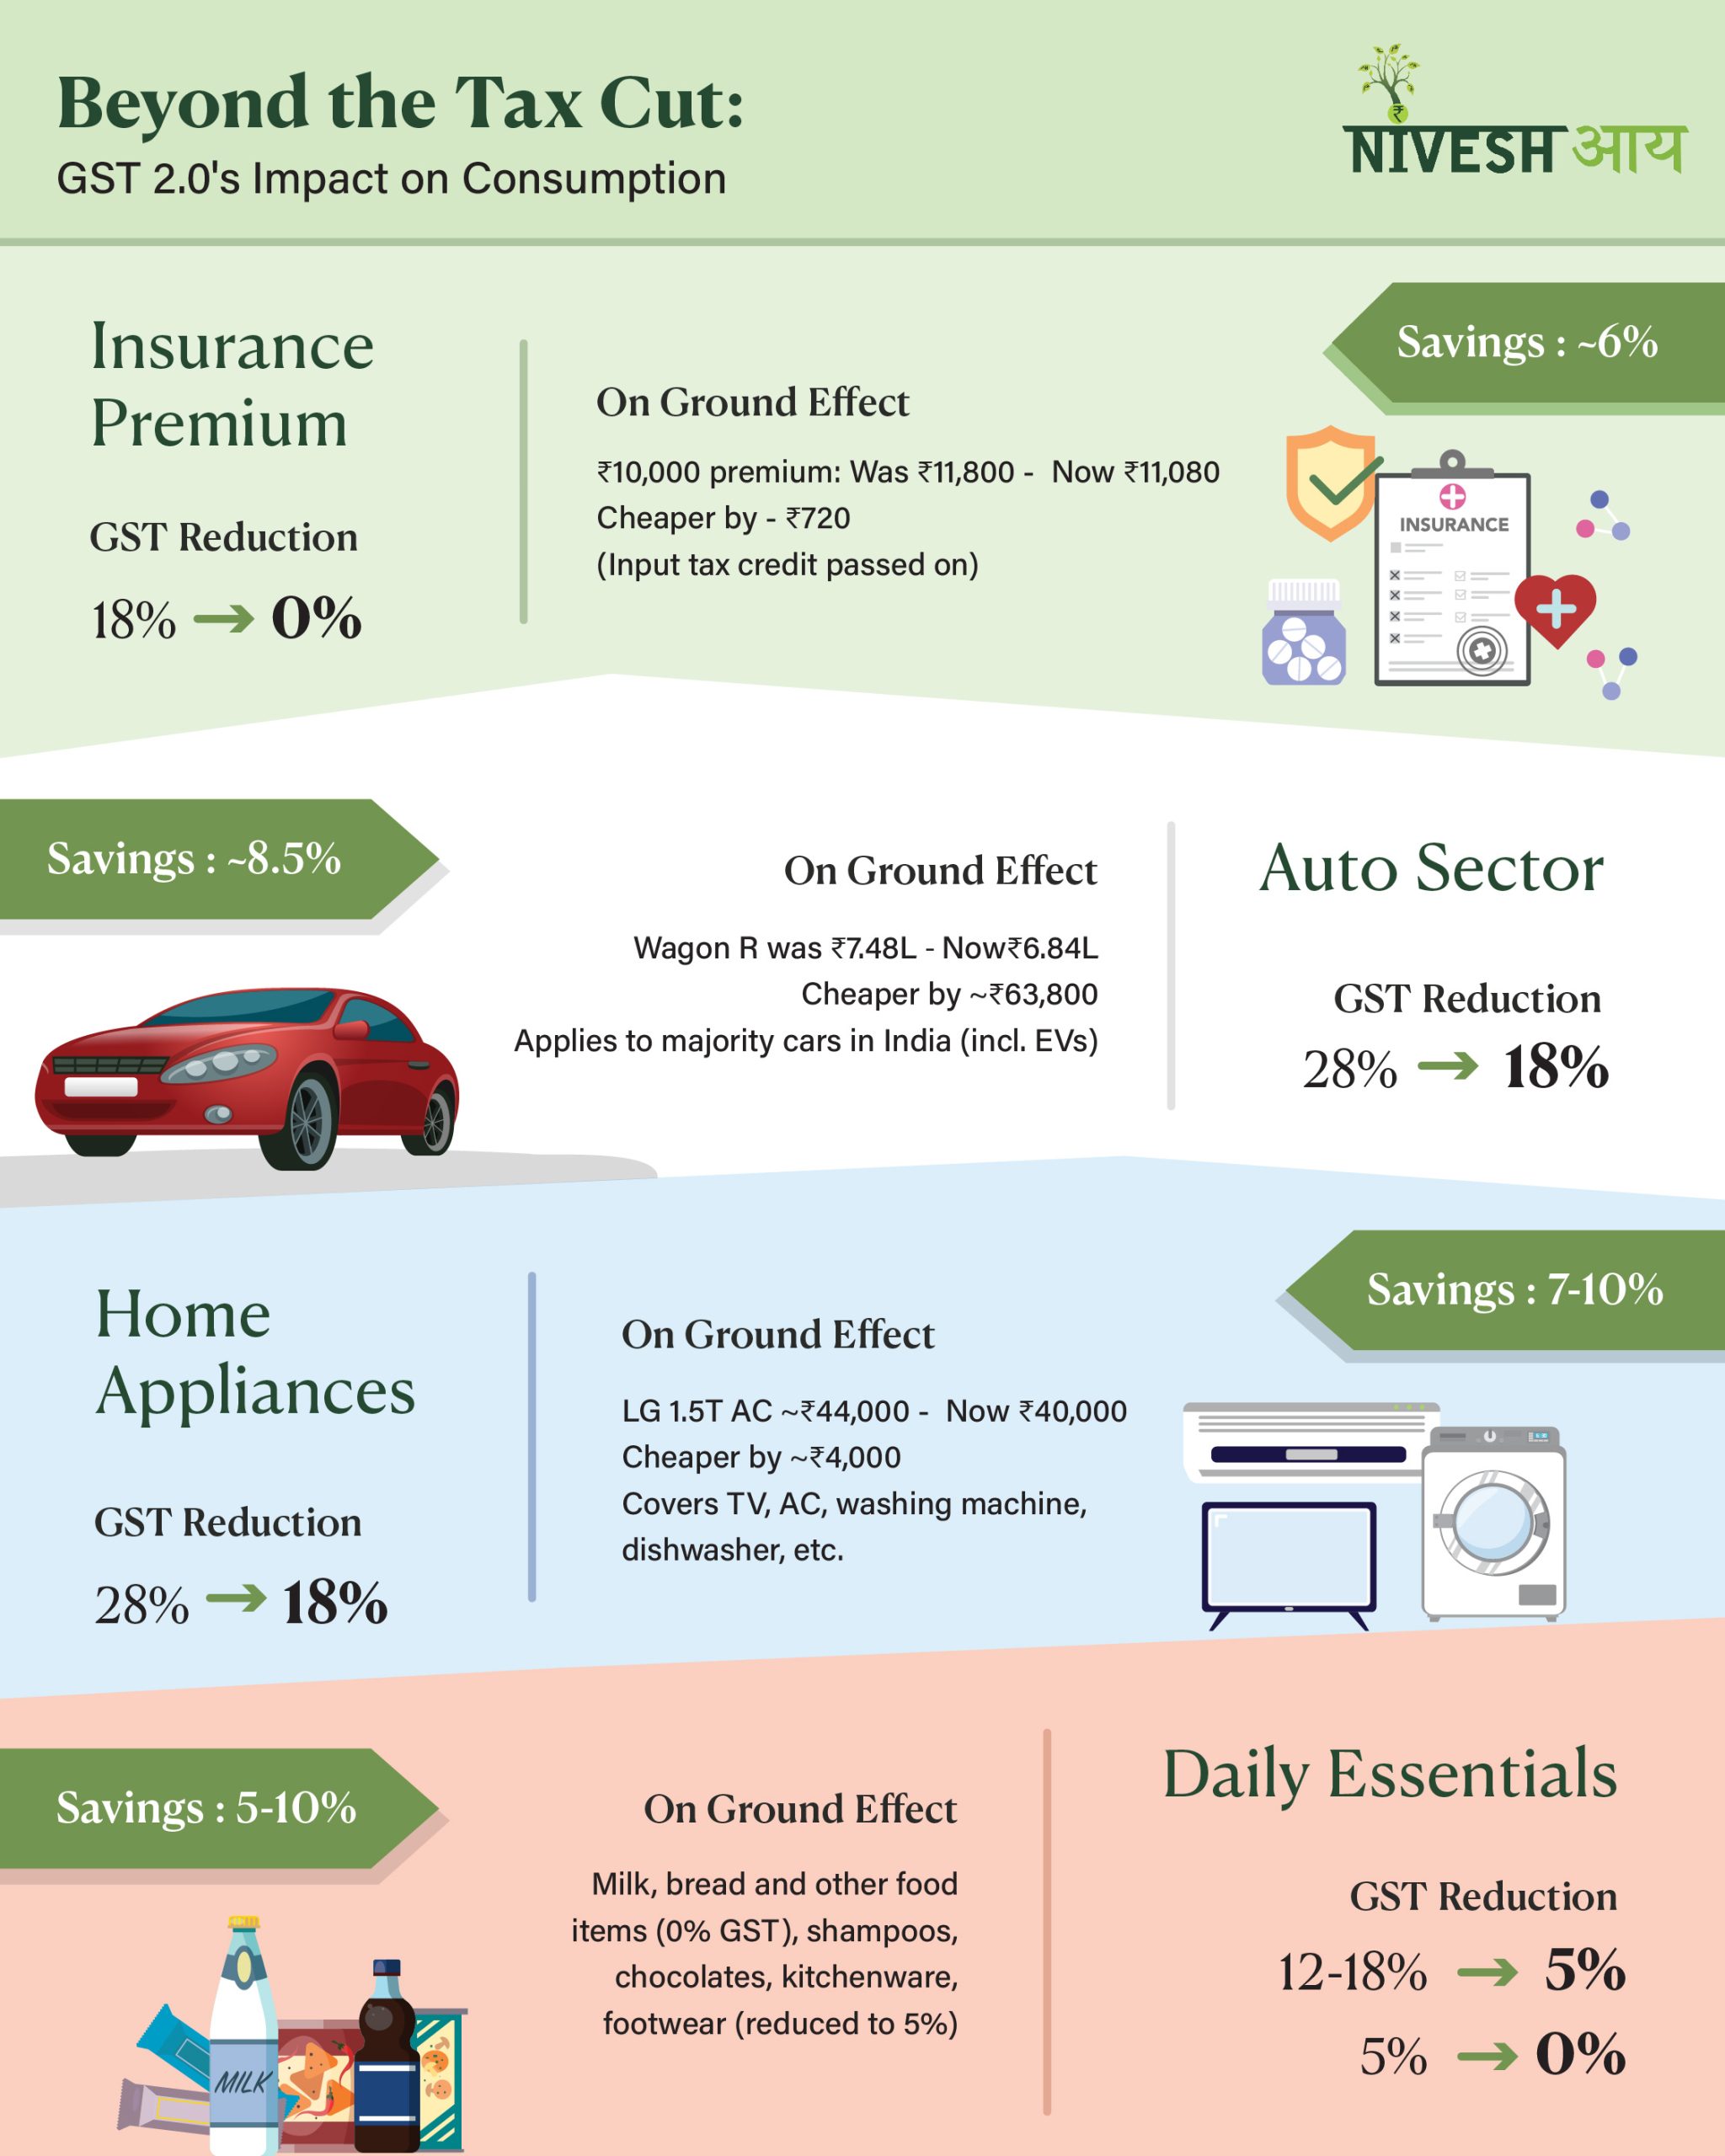
Consumer Durables, Services & Consumption
Beyond the Tax Cut : GST 2.0
GST 2.0 brings both immediate relief and long-term change to India’s economy. In the short term, lower tax on essentials cuts prices, saving consumers ~₹48,000 Cr. But the real impact lies in the long-term shifts. 📈🛡️ Affordable essentials push small businesses to formalize, unlocking ITC and financing benefits. Lower taxes on durables fuel demand and
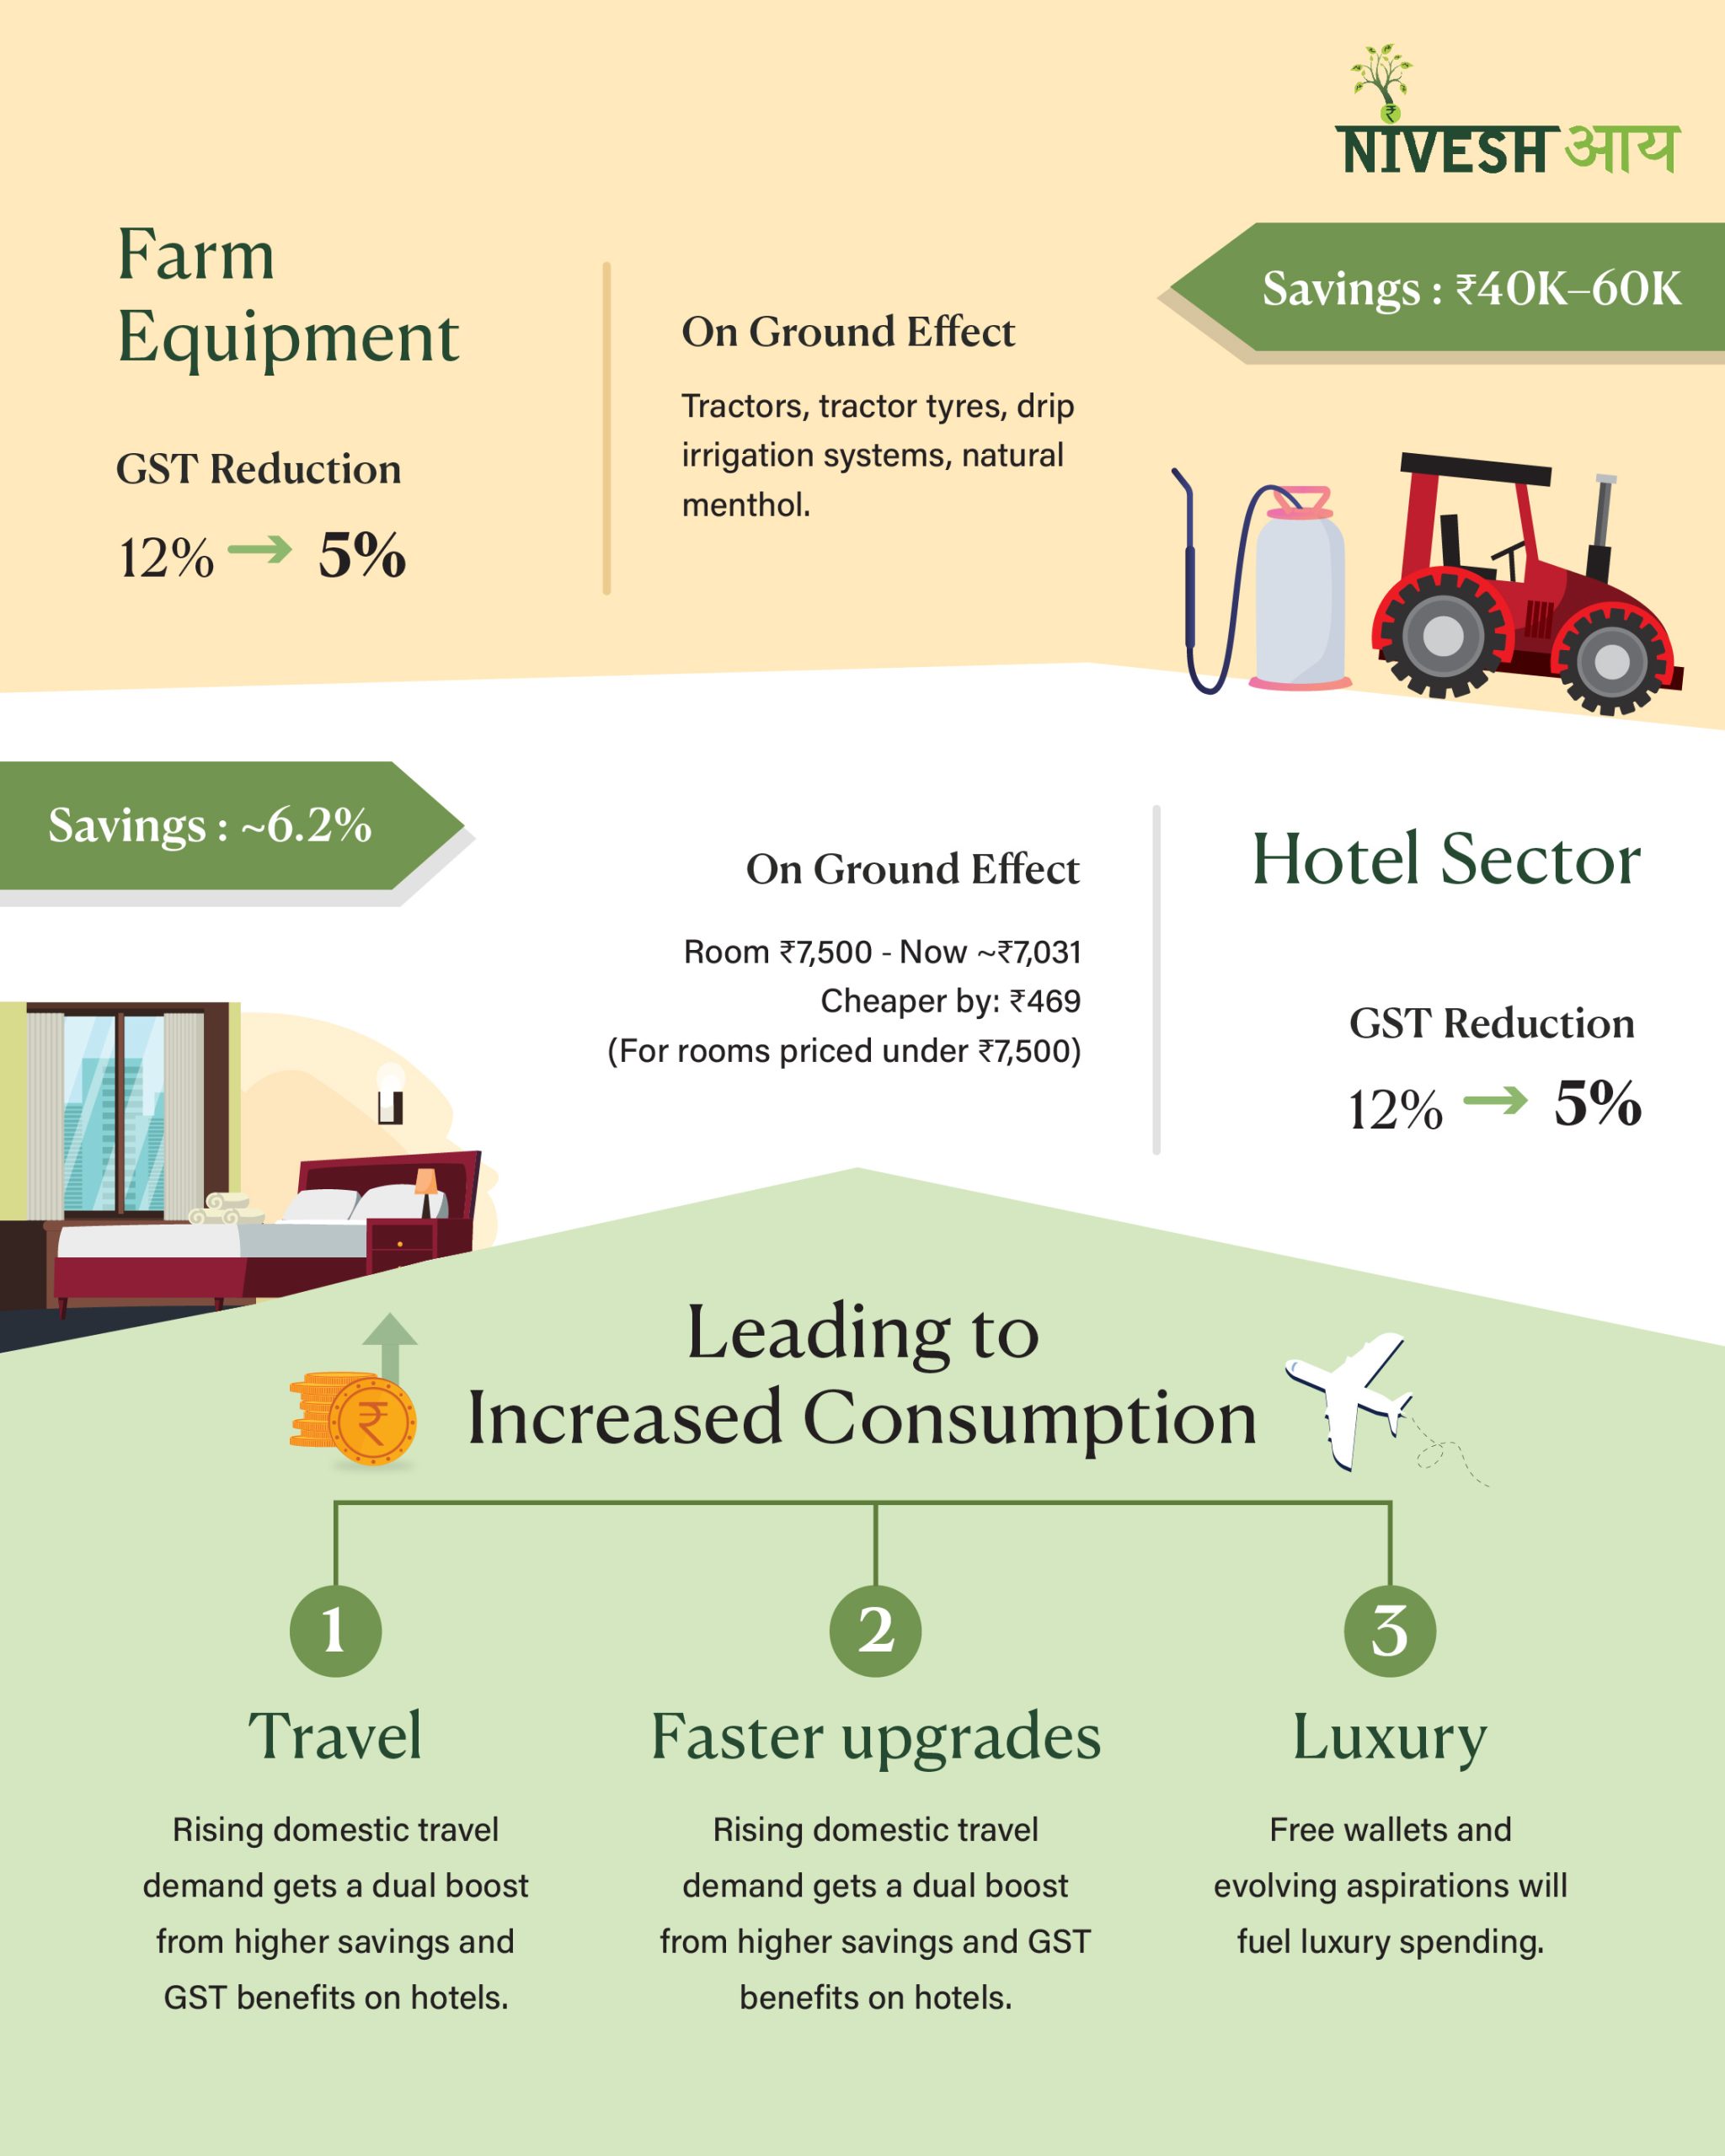
GST 2.0 brings both immediate relief and long-term change to India’s economy. In the short term, lower tax on essentials cuts prices, saving consumers ~₹48,000 Cr. But the real impact lies in the long-term shifts. 📈
🛡️ Affordable essentials push small businesses to formalize, unlocking ITC and financing benefits. Lower taxes on durables fuel demand and faster upgrade cycles, while tax-free insurance premiums expand coverage, especially in Tier 2 & 3 cities.
🛡️ Savings on staples, durables, and insurance free up disposable income for luxuries, hobbies, and travel.
Ultimately, GST 2.0 is about more than lower prices, it’s about building a formalized, empowered economy that boosts both near-term consumption and long-term growth. 🚀

Power & Renewable Energy
Transforming Energy Infrastructure with Kotsons Pvt. Ltd.
We rarely witness such pivotal and rewarding inflection points in the investment journey.Waaree Energies @waaree.group the Titan in India’s solar and energy ecosystem has acquired a 64% stake in Kotsons Private Ltd @kotsons.global through a strategic fund infusion. Kotsons is a proud portfolio company backed by Niveshaay, Vivek Jain and Shikher Chand Jain.We are truly excited about this next
We rarely witness such pivotal and rewarding inflection points in the investment journey.
Waaree Energies @waaree.group the Titan in India’s solar and energy ecosystem has acquired a 64% stake in Kotsons Private Ltd @kotsons.global through a strategic fund infusion. Kotsons is a proud portfolio company backed by Niveshaay, Vivek Jain and Shikher Chand Jain.
We are truly excited about this next chapter and look forward to seeing how our shared vision, conviction, and entrepreneurial spirit take shape.
This milestone stands as a powerful validation of our core philosophy: “Invest the Entrepreneur Way”
Capital Goods & Engineering
Make in India: A Decade of Growth & Innovation
From the first industrial policy in 1948 to becoming the world’s fifth-largest economy today, India’s journey is one of remarkable growth and reinvention.78 years of nation-building have seen exports surge, infrastructure transform, industries modernise, and policies evolve to match a global stage. 🌏This Independence Day, we salute the vision, grit, and unity that continue to
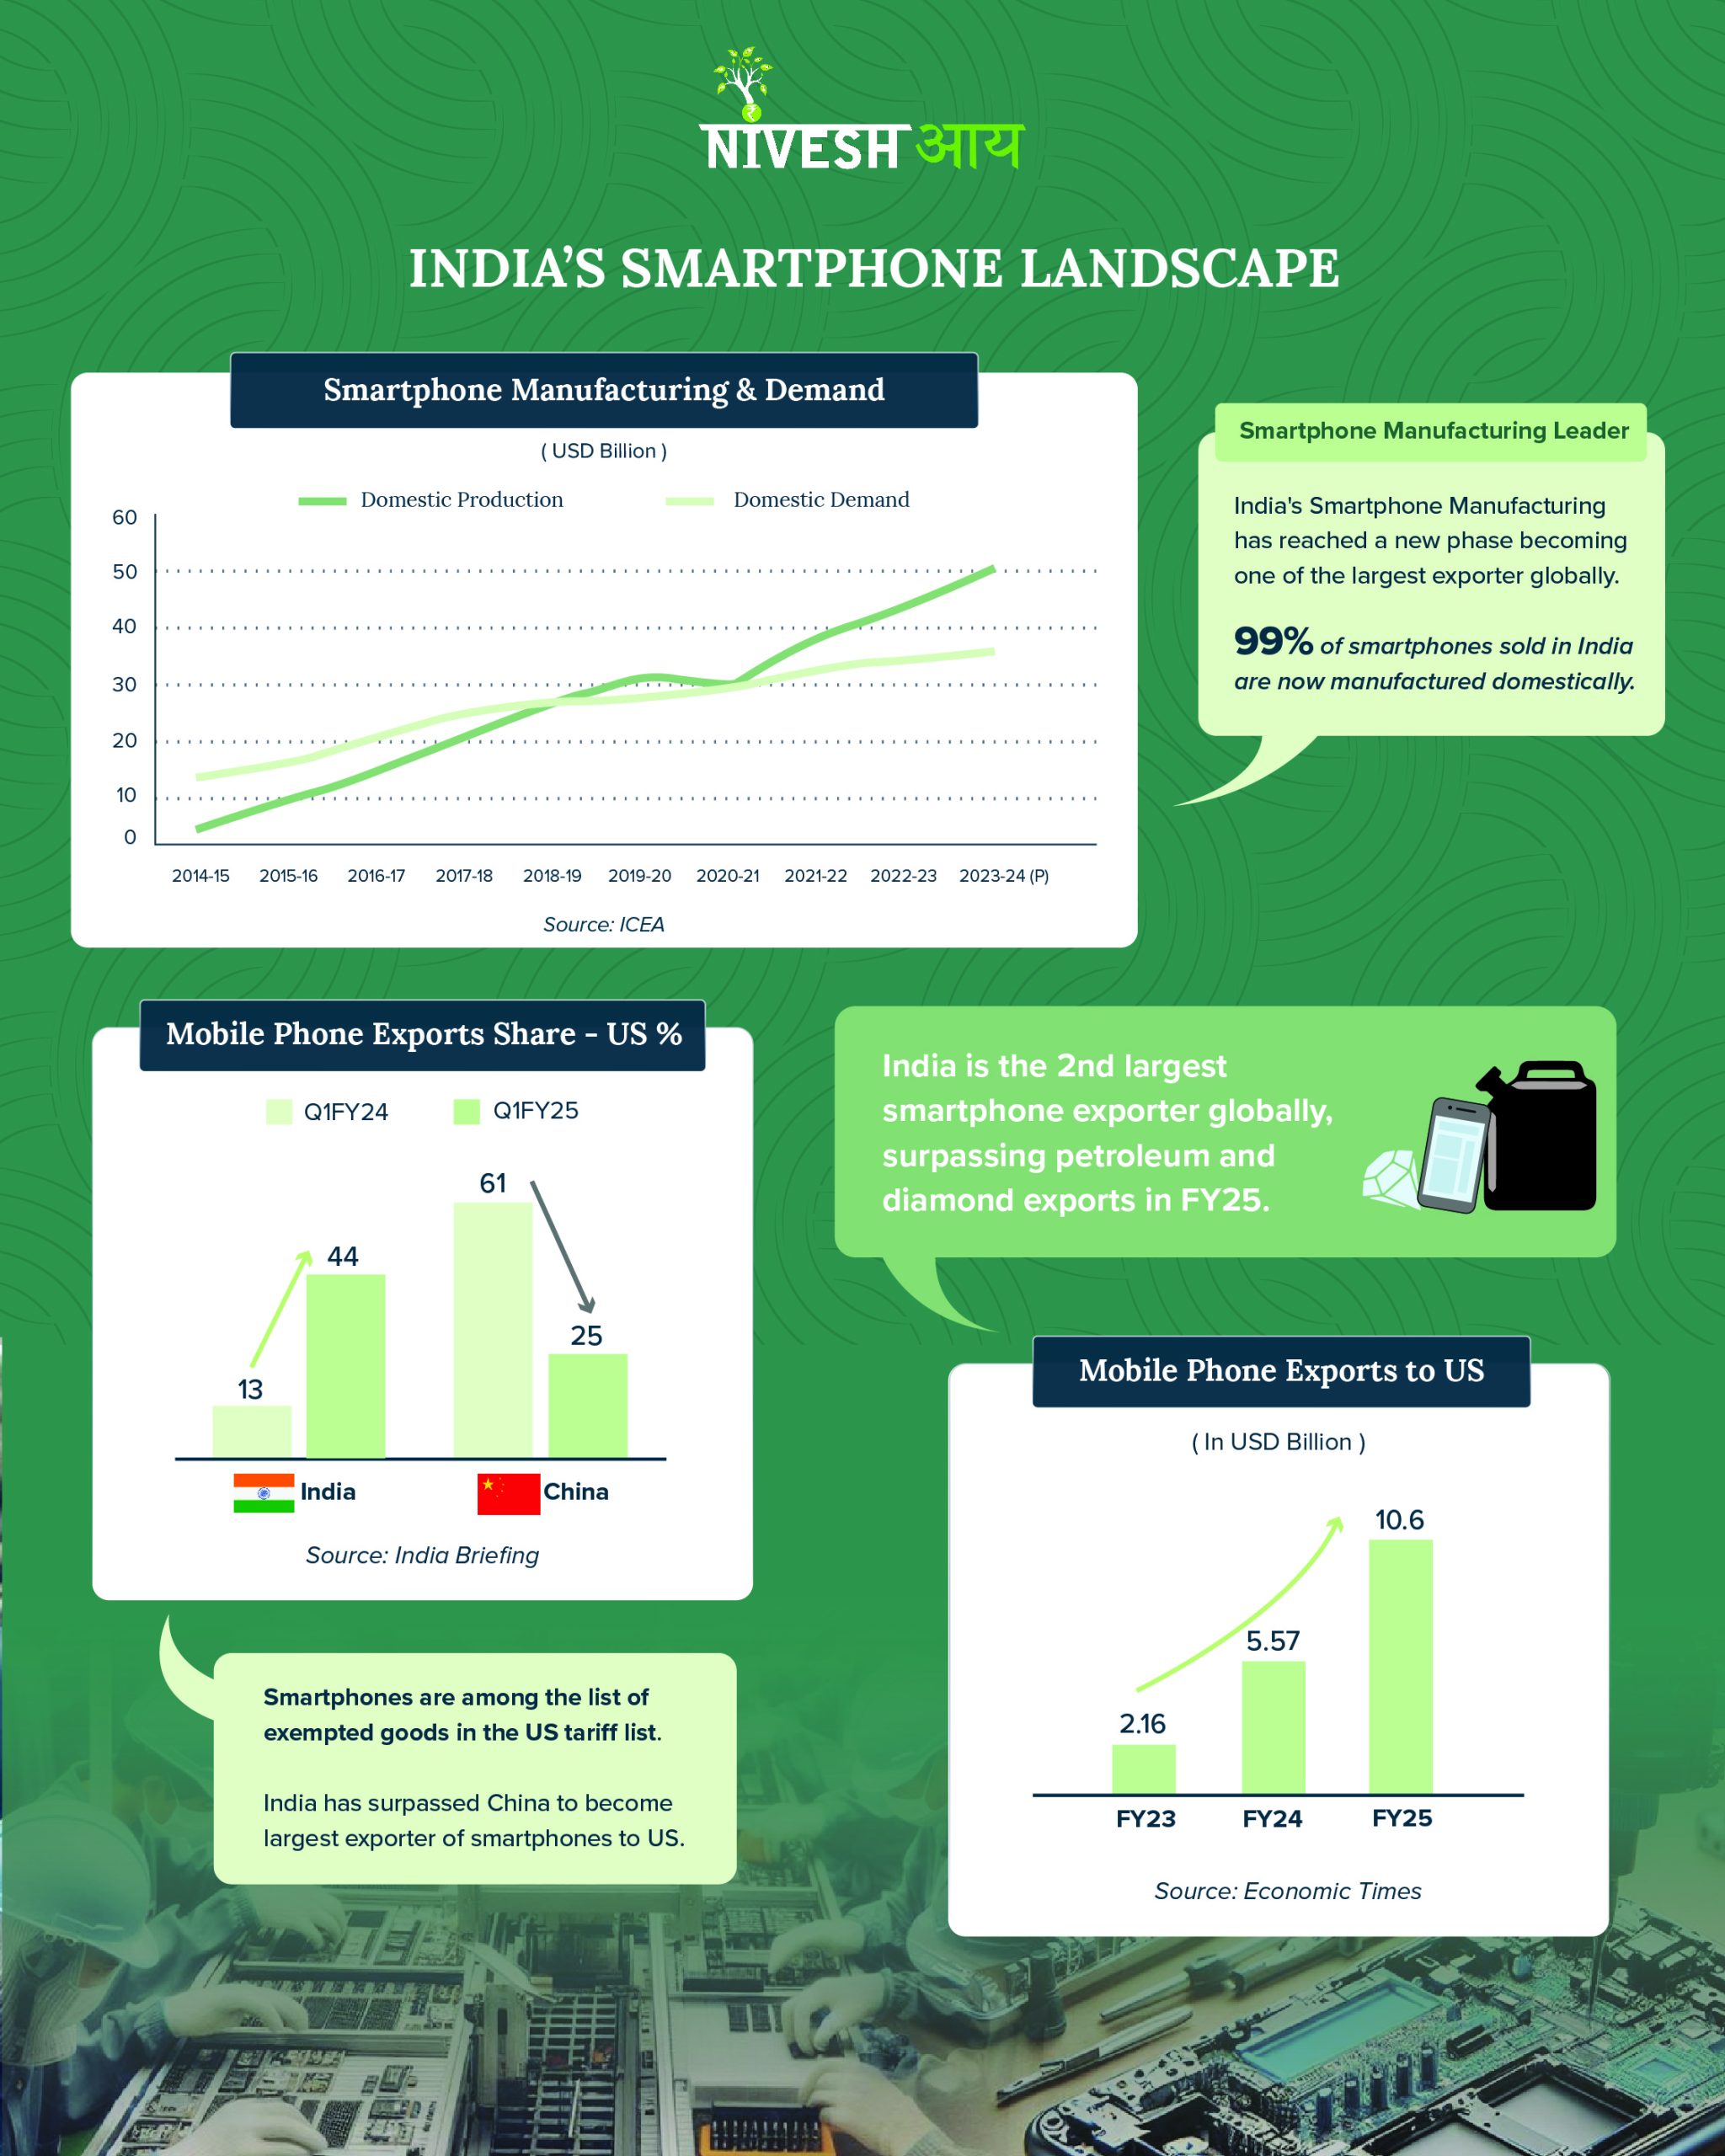
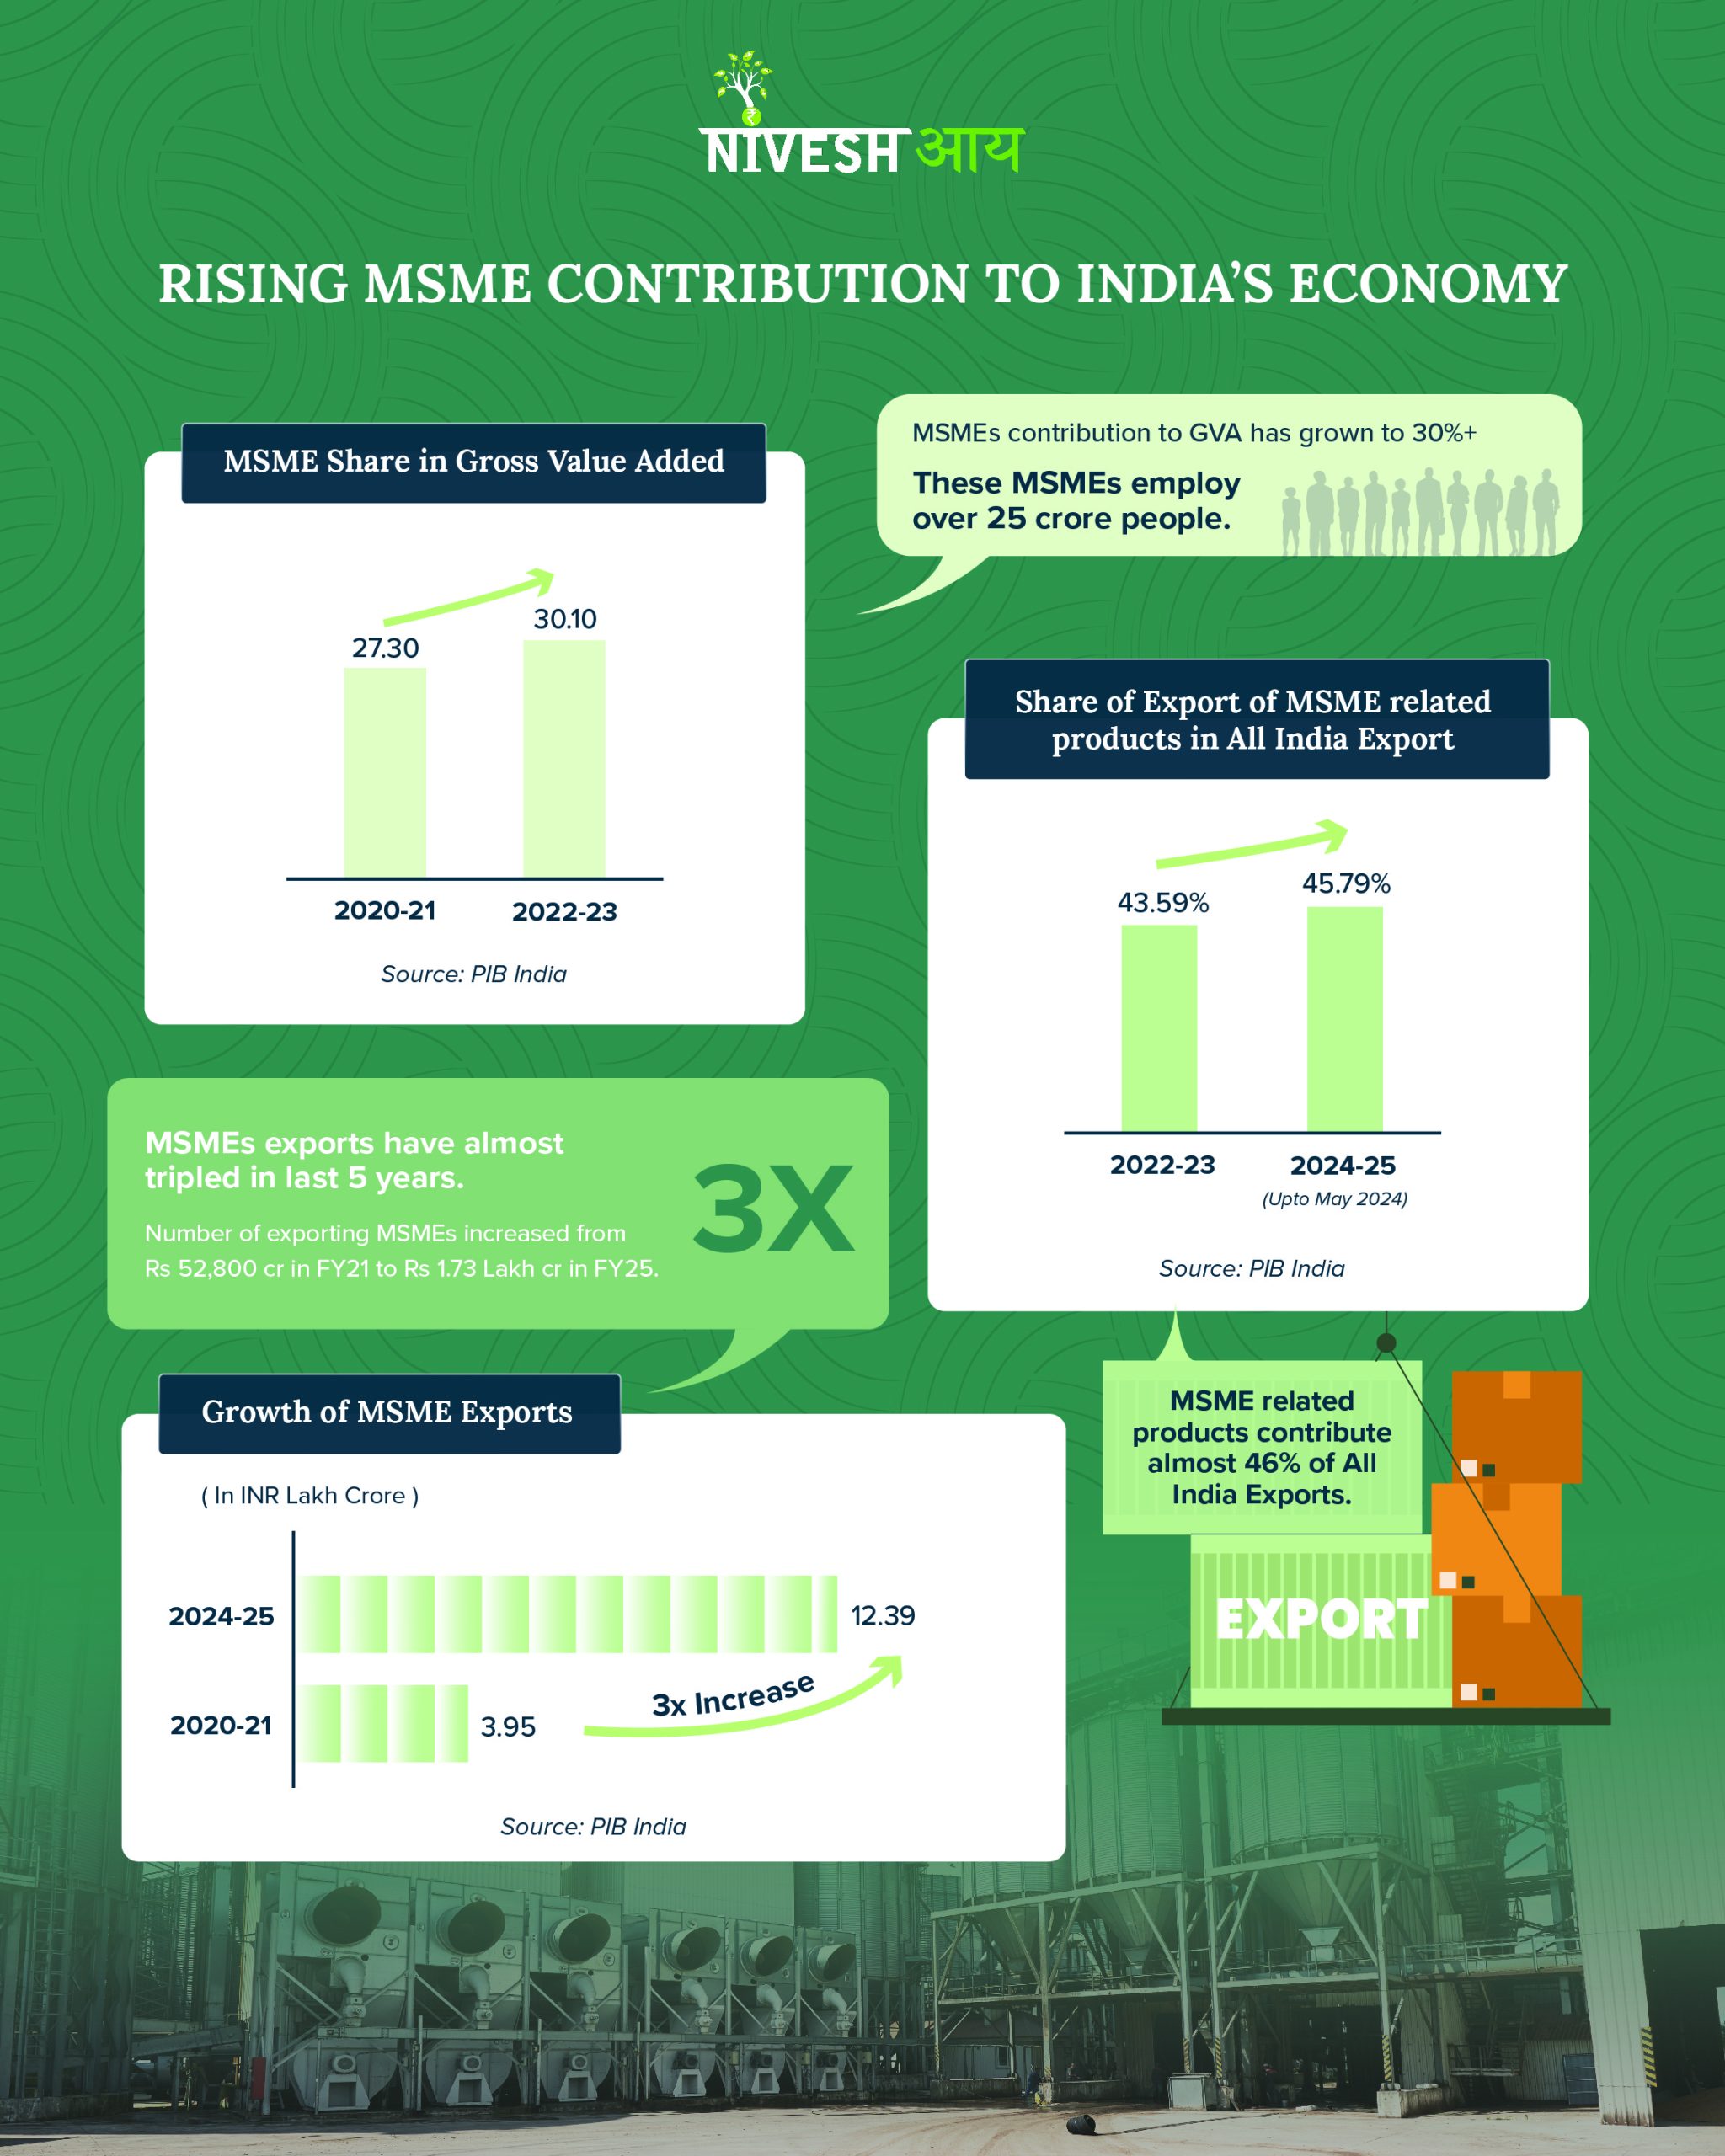
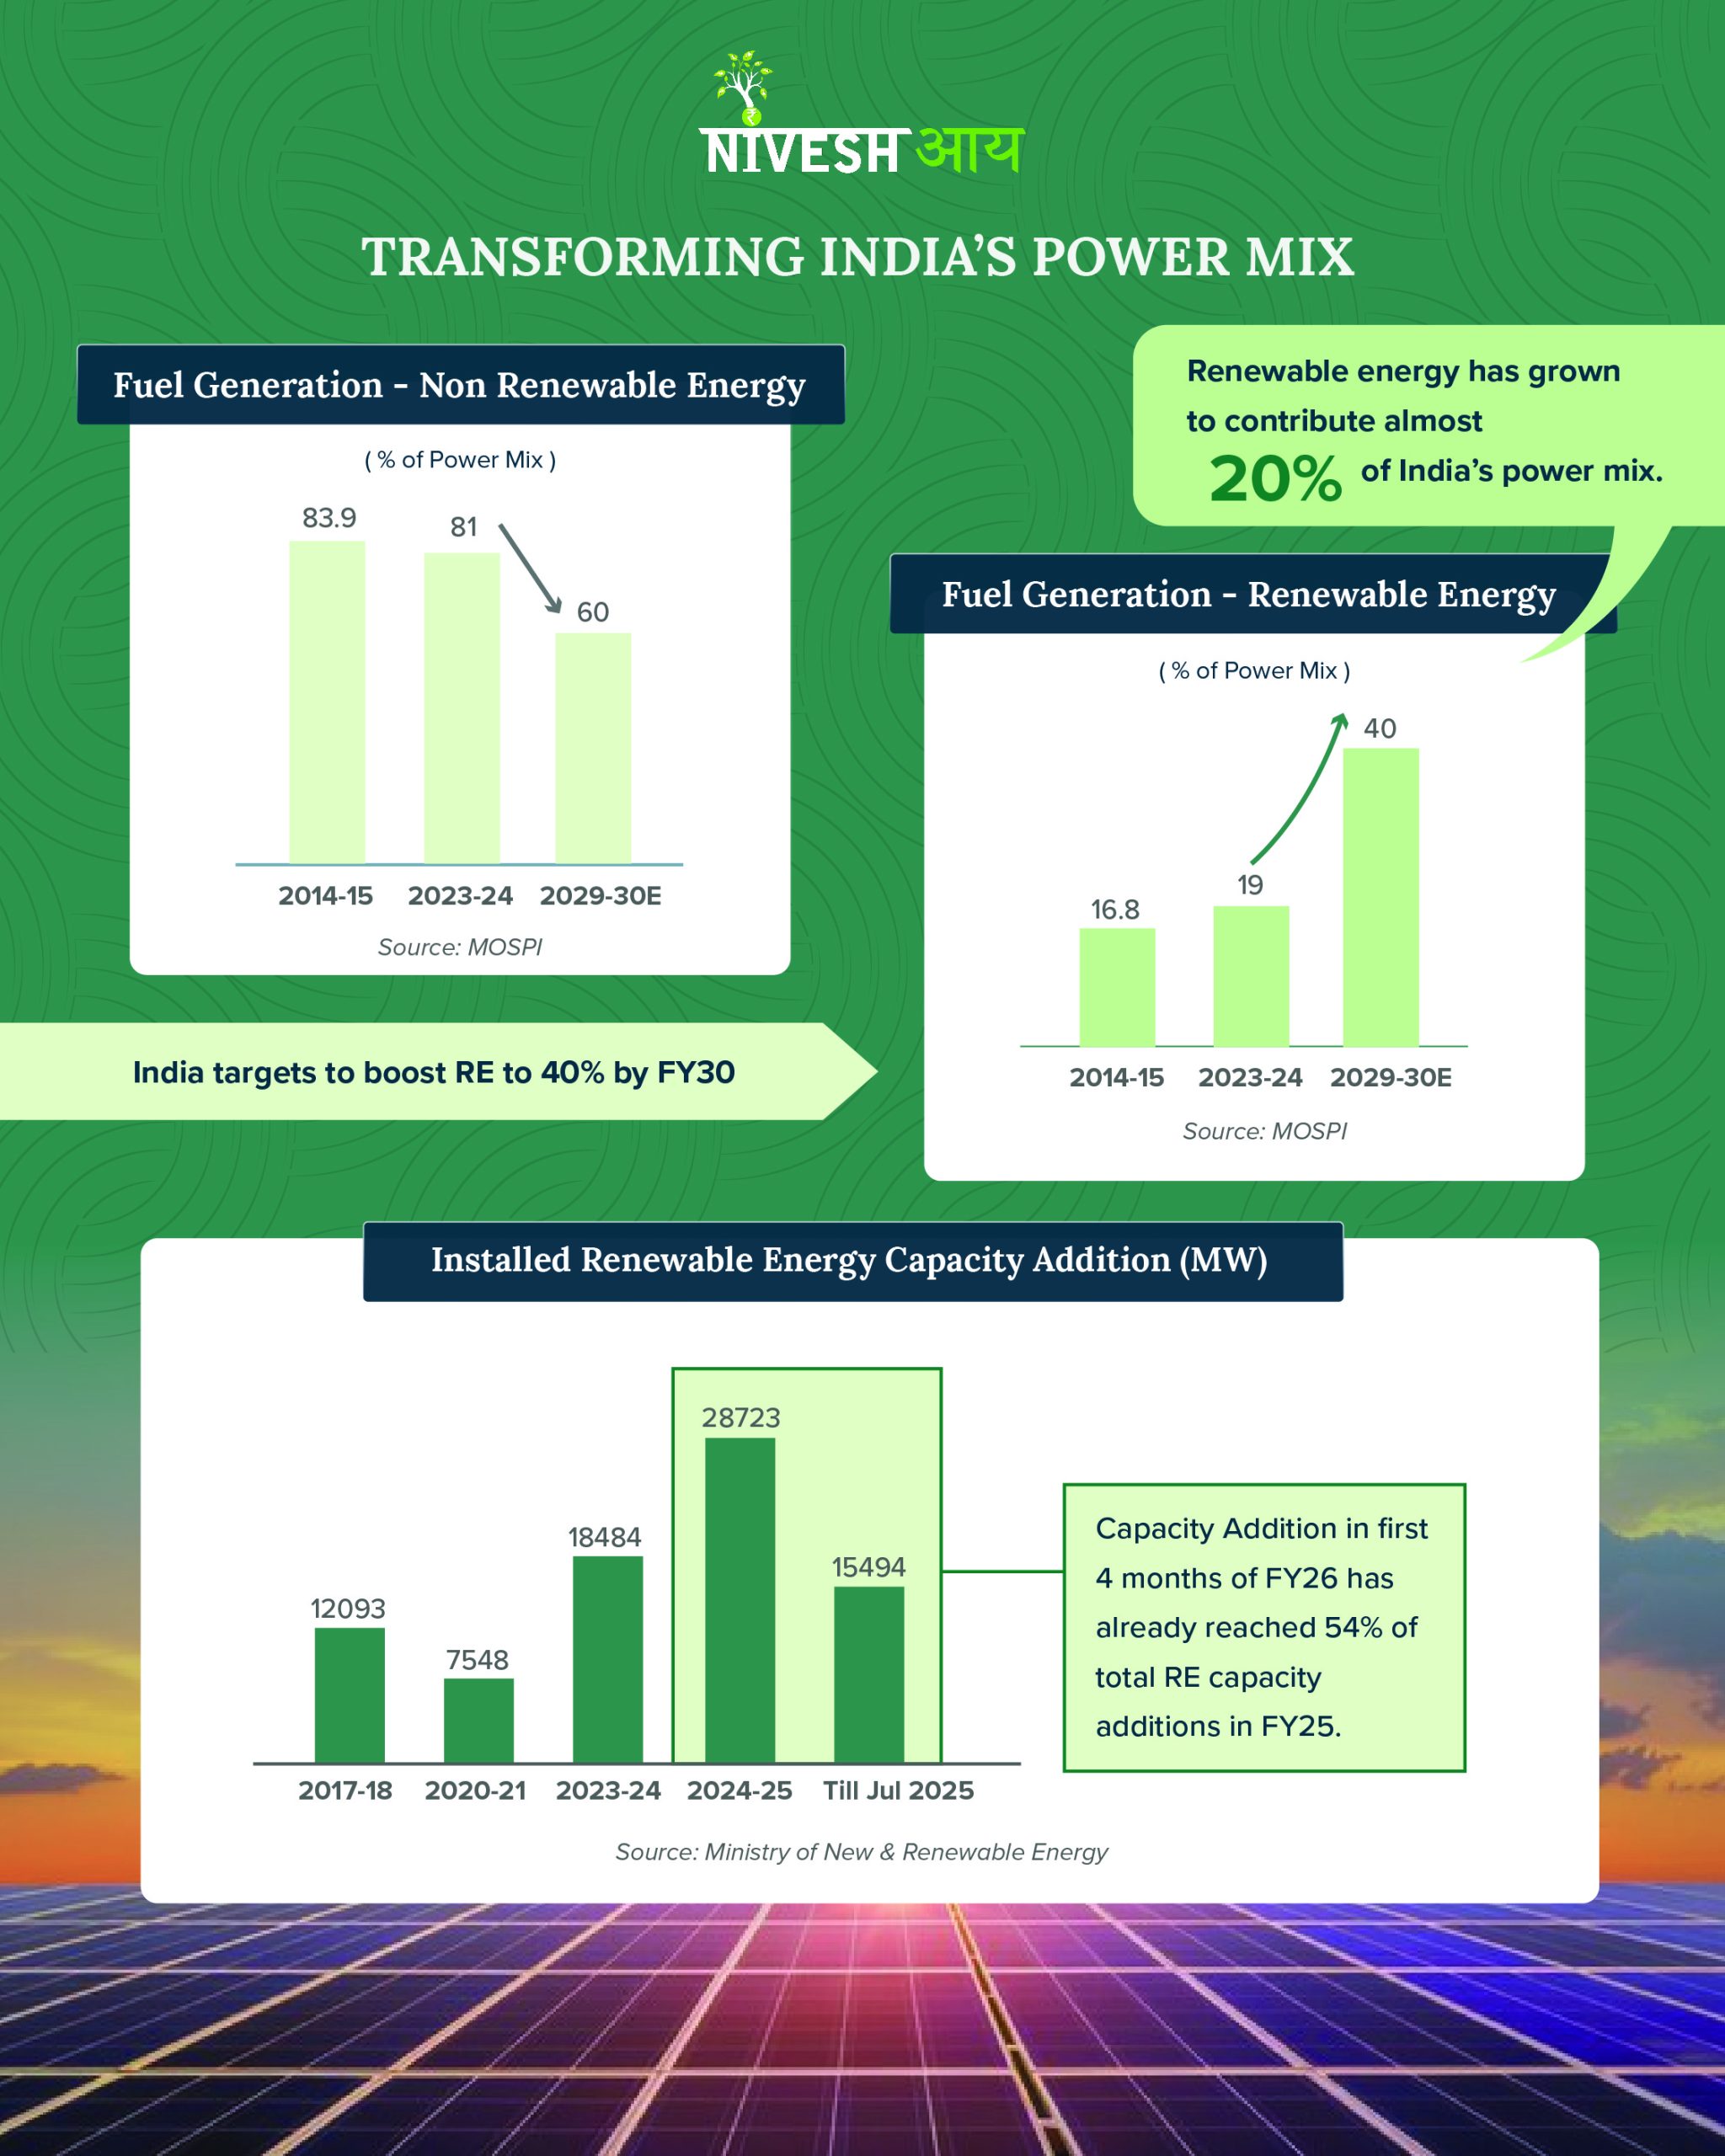
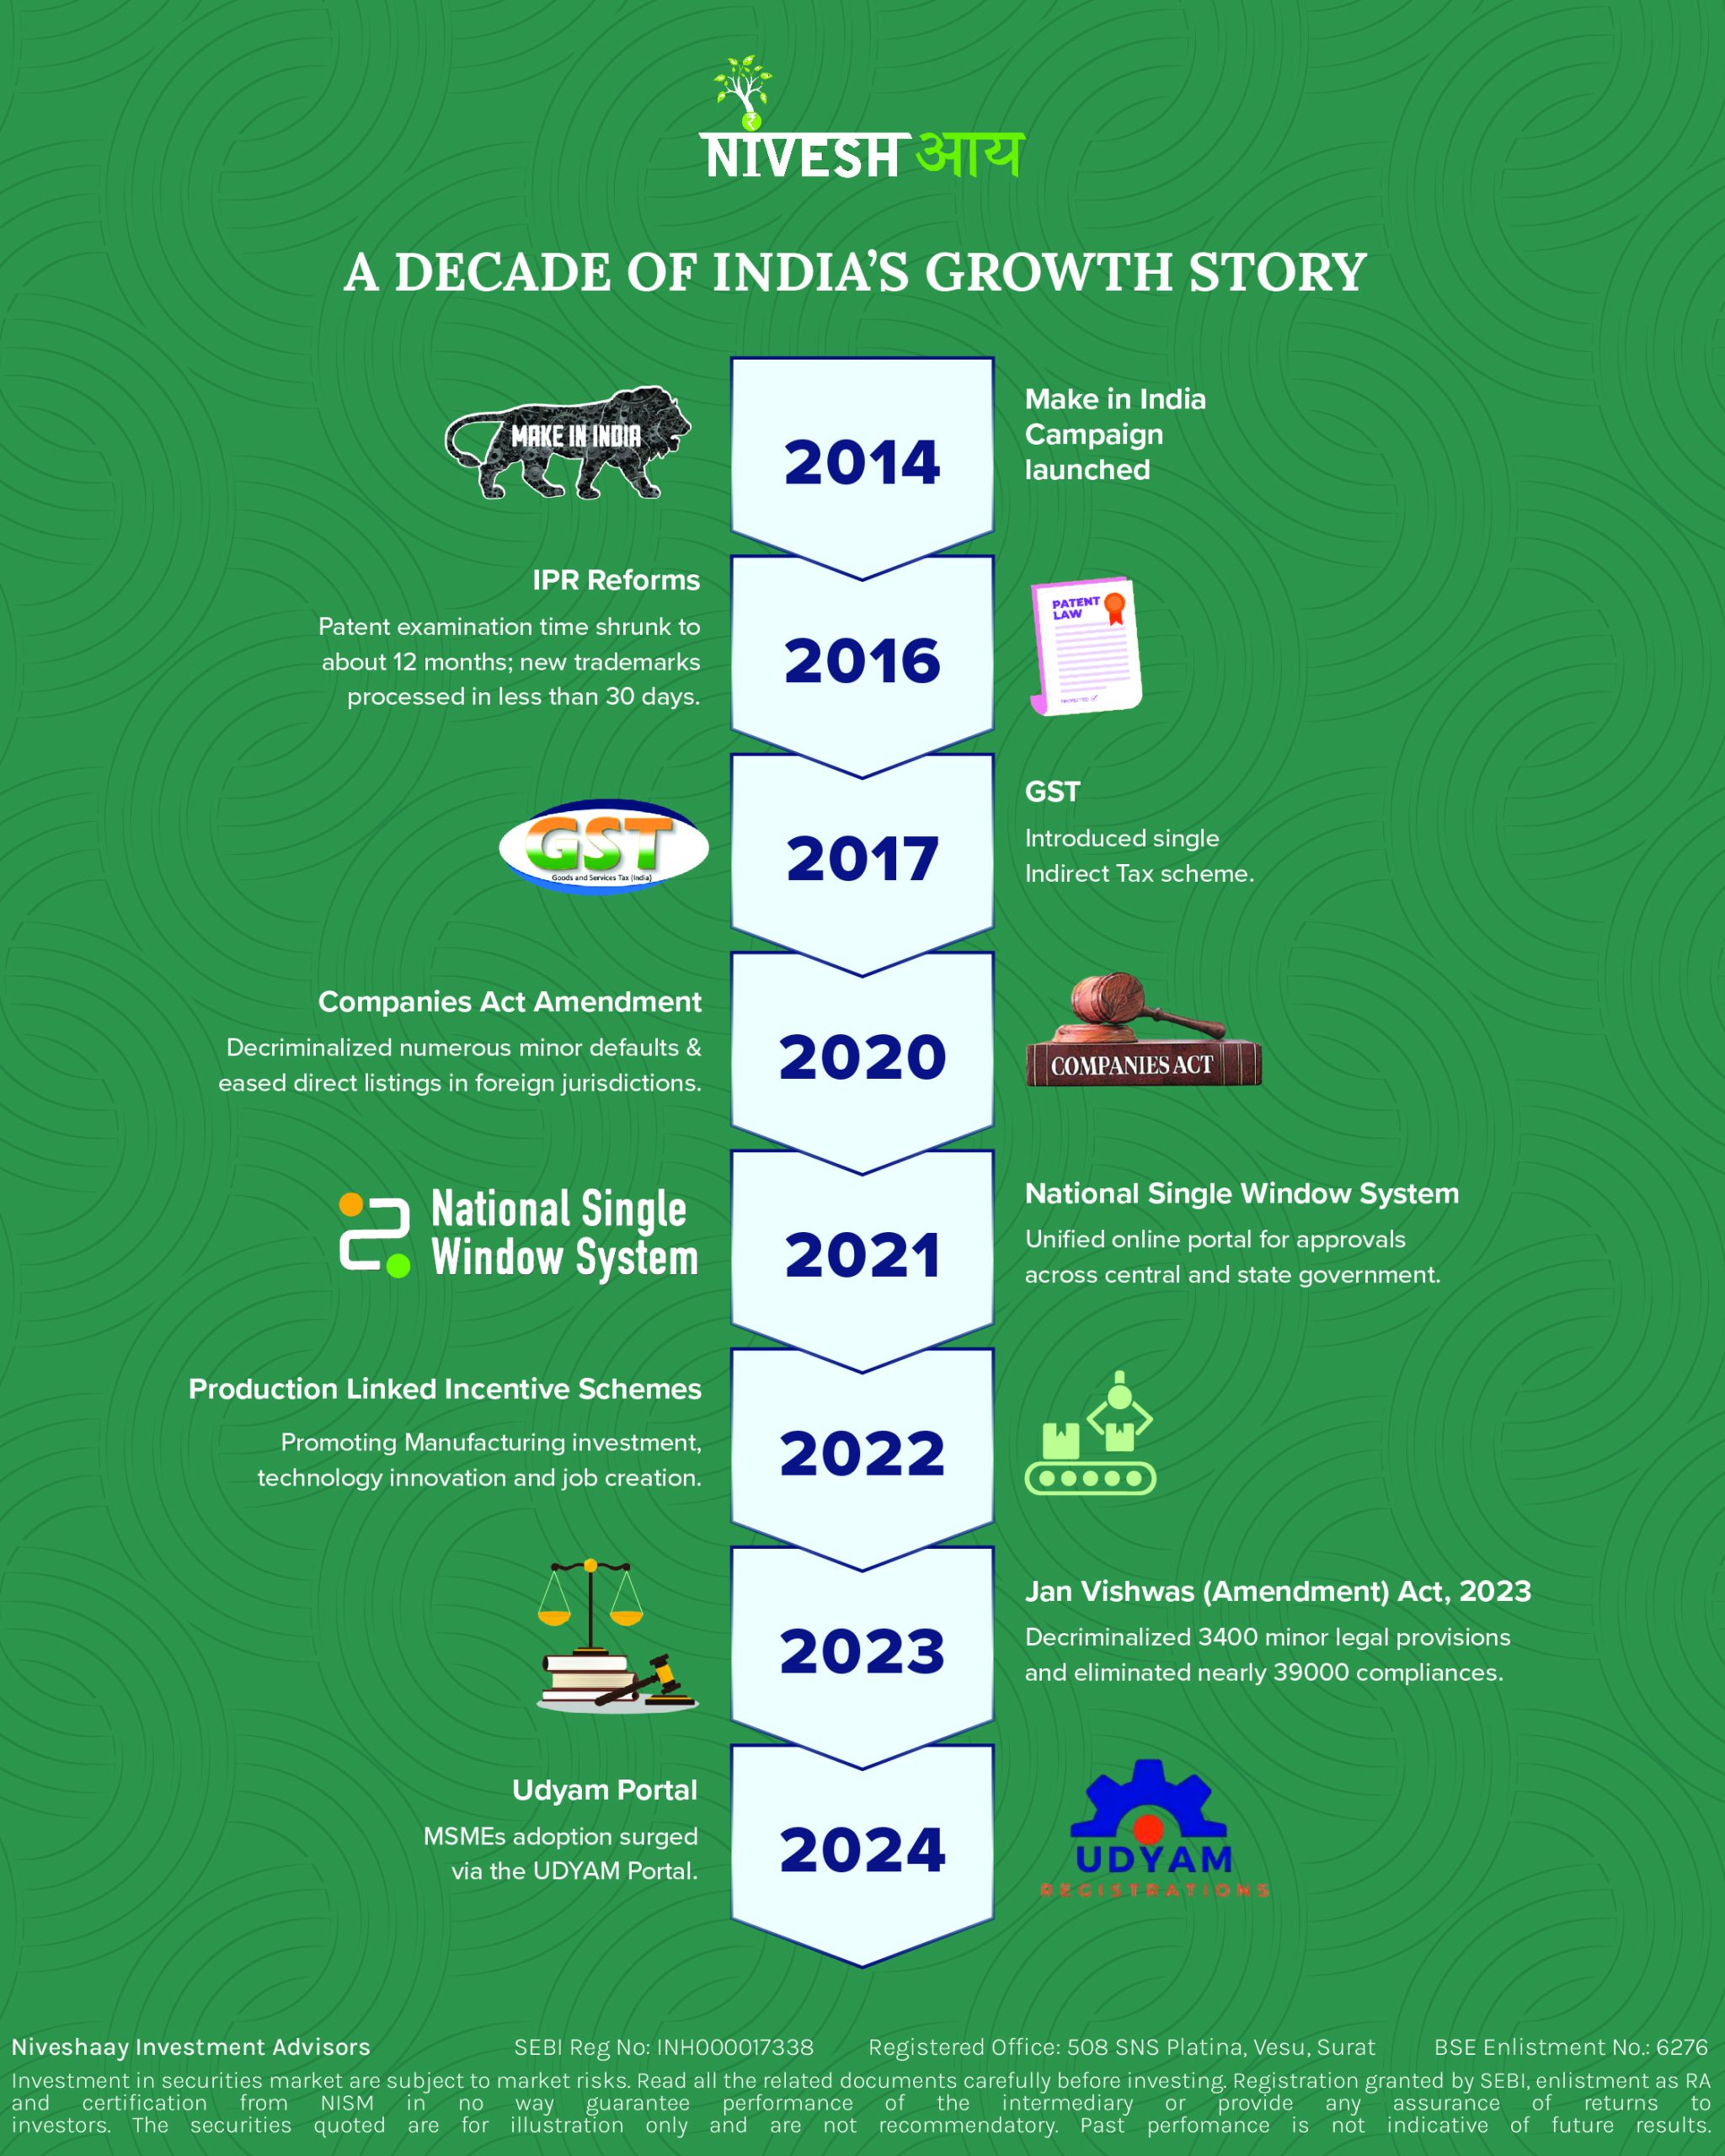
From the first industrial policy in 1948 to becoming the world’s fifth-largest economy today, India’s journey is one of remarkable growth and reinvention.
78 years of nation-building have seen exports surge, infrastructure transform, industries modernise, and policies evolve to match a global stage. 🌏
This Independence Day, we salute the vision, grit, and unity that continue to shape the India of tomorrow.
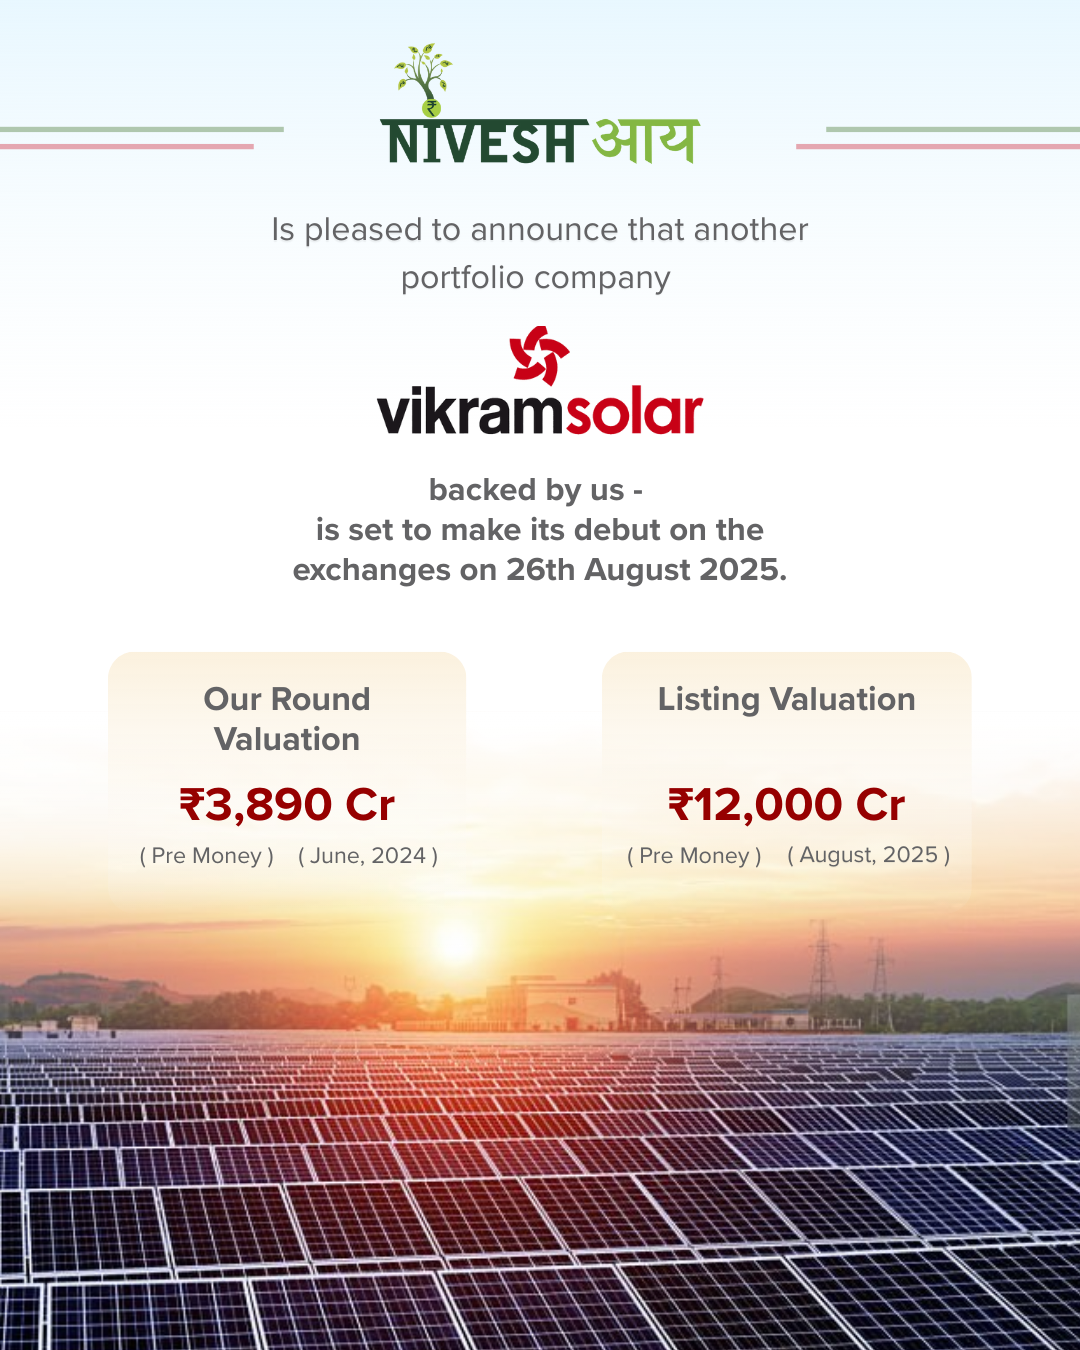
Power & Renewable Energy
Powering the Next Phase of Clean Energy- Vikram Solar Ltd.
Vikram Solar Ltd., backed by Niveshaay, is scaling big — expanding solar PV module capacity to 20.5 GW by FY27 and foraying into 12 GW solar cell manufacturing .
Vikram Solar Ltd., backed by Niveshaay, is scaling big — expanding solar PV module capacity to 20.5 GW by FY27 and foraying into 12 GW solar cell manufacturing .
🌍 With 7+ GW shipped (3.37 GW in last 3 years) across 39 countries and expertise in high-efficiency PERC, N-Type, and HJT technologies, Vikram Solar is building a vertically integrated clean energy business — ready to capture the global shift toward sustainable power.
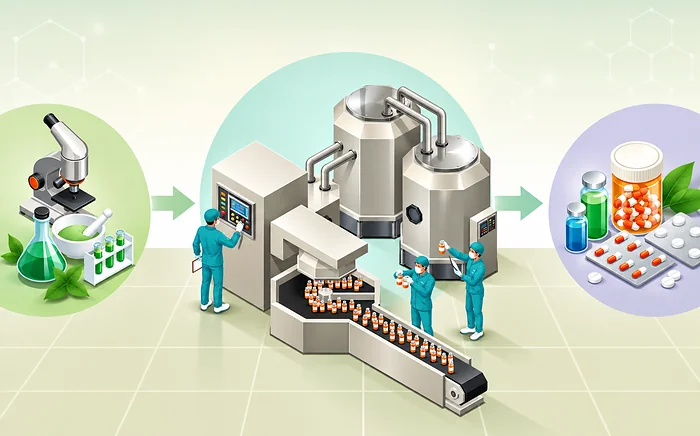
Pharmaceuticals
India’s CDMO Rise: From Pill Factory to Strategic Partner
Every few decades, a shift in operating models reshapes an entire industry. In global pharmaceuticals, that shift is happening now, and India’s CDMO sector sits squarely at its centre. The numbers show momentum. The global demand signals urgency. And the strategy points to integration. Development and manufacturing are no longer siloed functions. They are converging
Every few decades, a shift in operating models reshapes an entire industry. In global pharmaceuticals, that shift is happening now, and India’s CDMO sector sits squarely at its centre.
The numbers show momentum. The global demand signals urgency. And the strategy points to integration. Development and manufacturing are no longer siloed functions. They are converging into unified service platforms, led increasingly by agile partners across India.
What was once a cost-driven market is now expanding into a value-led ecosystem. Infrastructure has matured. Compliance frameworks have scaled. Talent pipelines are growing in both depth and specialisation.
For investors, the signals are not speculative. They are visible across RFP volumes, contract sizes, and expansion plans. The story is not about disruption. It is about quiet consolidation of capabilities and a region aligning its strength with the future of drug development. If you need some figures for context, the domestic pharmaceutical industry is already worth close to $50 billion and projected to more than double in the next decade. That kind of growth may increase India’s GDP share by nearly 100 basis points. How about that!
Why CDMOs Are Reshaping Pharma’s Backbone?
At the heart of this story is a new development. India is becoming a trusted name in Contract Development and Manufacturing. CDMO is not a new concept. But the pace of adoption, the global demand, and the scale of investment now being seen are new. But let’s not get ahead of ourselves. Let’s start at the beginning.
What Does a CDMO Really Do?
Think of a CDMO as the behind-the-scenes engine that helps pharmaceutical innovations move from lab to life. A Contract Development and Manufacturing Organisation doesn’t just assist with manufacturing. It connects every stage of the value chain, starting from early molecule development and continuing through to market-ready production.
Unlike traditional outsourcing partners, CDMOs are built for integration. They combine scientific depth with regulatory rigour, ensuring that ideas can scale without losing speed or compliance.
From Silos to Synergy: How Pharma Outsourcing Models Are Evolving
Imagine trying to assemble a complex machine with three different teams, each speaking a different language and working in different time zones. That’s how pharmaceutical outsourcing once looked: fragmented, delayed, and full of friction.
Today, that picture is changing. The industry is steadily moving toward integrated models where development and manufacturing flow together, not apart. But where does India come in?
The Market Outlook: Bigger, Faster, Stronger
India’s CDMO sector is expanding at a pace few anticipated. From a market size of $22.5 billion in 2024, it’s projected to touch $44.6 billion by 2029. That’s a compound annual growth rate of nearly 15 per cent, significantly ahead of the global pharma average.
According to Boston Consulting Group, India is on track to capture up to 5 per cent of the global CDMO market by 2030. It may sound modest, but for a sector that’s rapidly moving into higher-value territory, it’s a leap that matters.
What’s Powering India’s CDMO Momentum?
India's CDMO sector is not just growing—it's building significant momentum from multiple directions. With regulatory reforms, shifting global pharma dynamics, and emerging trends, the timing has never been better. Here’s what’s driving this exciting rise:
1. The Outsourcing Boom
Pharmaceutical companies worldwide are turning to outsourcing more than ever before. Faced with rising costs and tightening regulatory demands, doing everything in-house is no longer practical. In 2024 alone, Indian CDMOs saw a 50% spike in project requests—an unmistakable sign that the global market is putting its trust in India.
2. The Patent Cliff Is Opening New Doors
As blockbuster drug patents expire, the race to produce generics and biosimilars is on. India, already a master of the generic game, is uniquely positioned to lead the charge. With established regulatory processes and cost-efficient manufacturing, Indian CDMOs are ready to meet the surge in demand for off-patent drugs.
3. Biologics and Specialty Drugs Are the New Frontier
Pharma is shifting towards biologics, specialty injectables, and advanced therapies—products that require precision, sophistication, and specialized environments. Indian CDMOs are stepping up by investing in cutting-edge technologies like bioreactor systems, cleanrooms, and expert teams to meet this growing demand and move further up the value chain.
4.Regulatory Confidence Is Soaring
India's regulatory ecosystem has evolved impressively, and most top-tier CDMOs are now fully compliant with global GMP standards. This newfound regulatory confidence is enabling Indian CDMOs to gain credibility and make their mark in highly regulated markets like the US and Europe, giving them a competitive edge.
5.India’s Cost Advantage Is Still a Game-Changer
Even in a world facing inflationary pressures, India’s CDMOs continue to offer a significant cost advantage—about 15-20% lower than other outsourcing destinations. This cost efficiency is a huge draw for pharma companies working under tight margins, making India a go-to hub for pharmaceutical outsourcing.
6.Talent Depth with Room to Grow
India’s talent pool in chemistry and process engineering is one of its strongest assets, enabling CDMOs to tackle complex formulations and scale-up operations. However, when it comes to biologics, there’s still work to be done. India’s talent pool needs to grow by six to seven times to meet the booming global demand for biologic products. But with the right investments in education and infrastructure, this growth is well within reach.
Investing in India’s CDMO Shift: A Decade of Opportunity and Discipline
A quiet shift is underway in India's pharmaceutical backbone. What was once a story of low-cost manufacturing is now steadily becoming one of innovation, integration, and strategic value creation. This evolution doesn’t just change how drugs are made; it changes who benefits from making them.
As global pharma looks for partners that offer both scale and specialisation, India’s CDMO sector is stepping into a more central role. What makes the timing especially relevant is the convergence of three powerful currents: global demand for complex therapeutics, strong domestic policy support, and a maturing regulatory framework that meets international expectations.
For investors, this is not just another manufacturing trend. It’s a deeper, more structural movement toward integrated pharmaceutical services, one that aligns closely with intellectual property and long-term value creation.
India is witnessing a shift towards more integrated pharmaceutical service models, where CDMOs provide a range of services across the entire drug development lifecycle, from research and development to manufacturing. This shift is supported by policy initiatives such as the Production Linked Incentive (PLI) schemes, which aim to boost domestic manufacturing and innovation. Additionally, there is a global trend towards increased outsourcing of research, development, and manufacturing, which aligns with India’s growing role in this sector.
India’s regulatory track record has also improved, with many CDMOs meeting global GMP standards, enhancing the country’s credibility in international markets. Moreover, the cost structures across various service verticals in India remain competitive, making it a viable option for global pharmaceutical outsourcing. These factors contribute to India’s growing significance in the CDMO space, offering potential for continued development within the sector.
Mapping the CDMO Landscape: Where Each Player Fits In
The CDMO space isn’t monolithic. It spans a wide spectrum, with players positioned according to the kind of drugs they support, how complex those drugs are, and the regulatory or production demands involved. Two broad categories emerge:
1) Complex Molecule & Innovator Drug CDMOs: These players support novel drugs (NCEs, biologics) from early development to commercial scale. They offer advanced capabilities like custom synthesis, biologics production, clinical trial supplies, and regulatory filings—acting as strategic partners throughout the drug lifecycle. Their integrated services reduce inefficiencies and accelerate time-to-market.
2) Generic & Biosimilar CDMOs: Focused on cost-efficient, high-volume production of off-patent drugs and biosimilars. Their strengths lie in streamlined manufacturing, multi-region regulatory compliance, and quick market entry, enabling global scale at optimized costs.
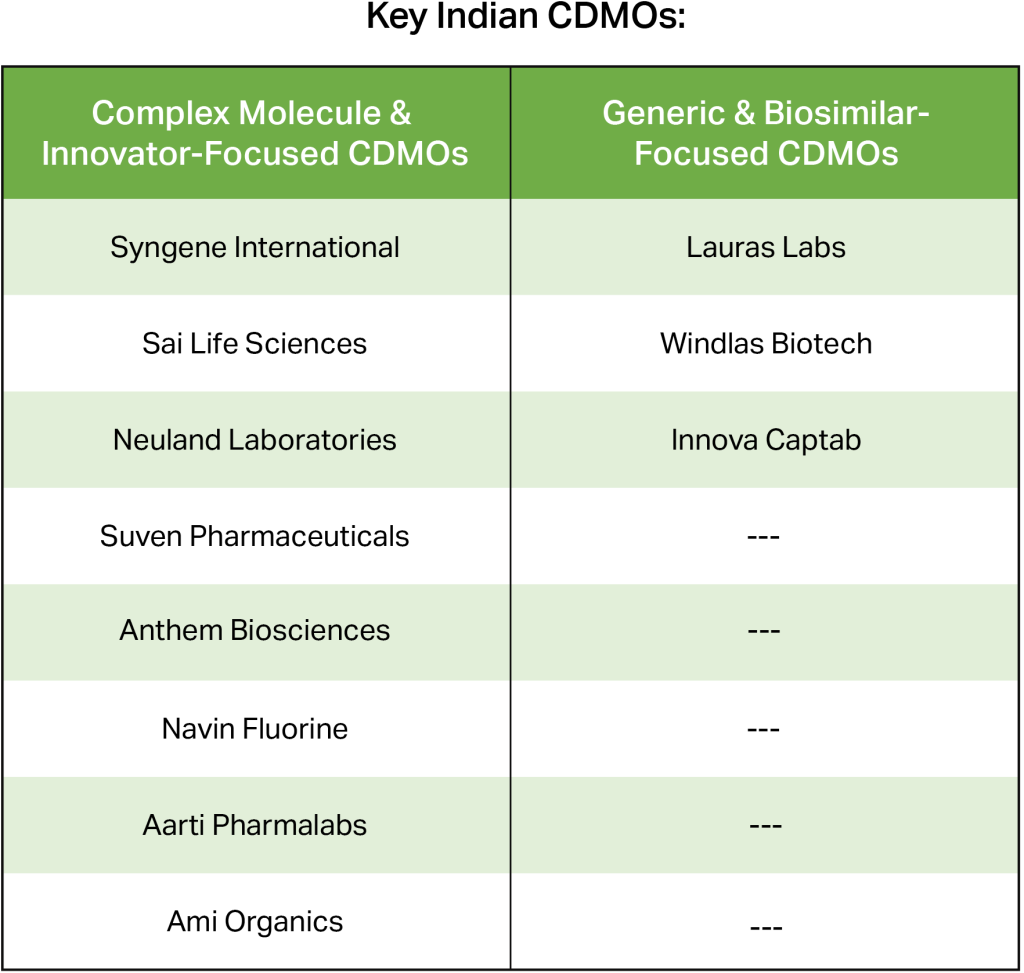

Electric Vehicle & Ancillaries
A Milestone Moment in Our Private Equity Journey
When we embarked on our private equity journey six years ago, we set out with a clear endeavor: to back visionary entrepreneurs by providing growth capital at critical inflection points, enabling them to accelerate their earnings trajectory and unlock their true potential. We observed that many promising companies often lacked access to proper guidance, resources,
When we embarked on our private equity journey six years ago, we set out with a clear endeavor: to back visionary entrepreneurs by providing growth capital at critical inflection points, enabling them to accelerate their earnings trajectory and unlock their true potential. We observed that many promising companies often lacked access to proper guidance, resources, or struggled to attract growth capital, either because their industries were at a nascent stage or their balance sheets were temporarily stressed despite strong underlying business models. When such companies, often overlooked, get capital at the right time, the potential to create wealth is huge as the business growth trajectory changes significantly.
At Niveshaay, we believe in backing entrepreneurs who dare to think differently and execute with discipline. Our approach to private markets goes far beyond providing capital — we aim to become true partners to founders, supporting them with strategic guidance, deep sectoral insights, and access to a robust entrepreneurial network. This empowers them to scale sustainably and build category-defining businesses that stand the test of time. Sambhv’s successful listing is a great example of what’s possible when bold leadership is paired with the right capital at the right time.
Initially, we had reservations about investing in a pure-play steel-pipe company in the private space. When we first met the Goyal family in early 2023, Sambhv was known for its sponge-iron turnaround and promising ERW volumes. To understand the business in detail, we did extensive scuttlebutt research, talked to a lot of distributors across the country for feedback.
What excited us to invest is their efficient execution in the steel industry spanning over decades, their adoption of differentiated technology to manufacture pipes at lower cost, quality at par with the dominant player and positive distributor feedback in a distributor led growth industry. Those granular, ground-level insights envisioned Sambhv as a brand in the making – particularly as the infrastructure sector was poised for robust growth. The overwhelming response we received against the bid size proves that thoughtful positioning can unlock demand even in capital-intensive sectors.
Journey to Public Market: Our Contribution Beyond Capital
We were committed to giving our absolute best throughout the entire process and thoroughly enjoyed this learning journey. We introduced Sambhv to bankers, negotiated competitive fee structures, and navigated the complexities of an OFS versus fresh-issue split. On the legal front, we helped with expert counsel, simplified the SEBI timelines for the founders, and gave them a bird’s-eye view of the whole process. For us, it isn’t just about capital, it’s about aligning incentives, clearing procedural bottlenecks, and ensuring everyone from promoter to banker moves in lockstep.
We also connected the company with numerous institutional and leading investors from the broader investing community. Also made direct connections with potential customers and vendors from our entrepreneurial network, creating valuable synergies for further growth. Likewise, for other portfolio companies, we have at times provided product feedback gathered from our extensive investor database, and on other occasions, facilitated connections of bankers to secure well-structured credit on favorable terms, unlock cost synergies in business operations, etc. Overall, we aimed to create a seamless journey for the company while gaining a deep understanding of the entire process and its finer nuances.
Surat isn’t traditionally known as a hotspot for IPO roadshows, but for this remarkable milestone, we insisted on a roadshow in Surat and invited the promoters to talk about their journey to the most enterprising city.
One of the most memorable experiences for our entire team was witnessing the bellringing ceremony as the company made its debut on the capital markets on 2nd July 2025. The insights and experience from the very first infusion of growth capital to ringing the bell on Dalal Street for Sambhv continue to shape every private deal we undertake. Similar investment stories include Kimbal Technologies, Sri Chakra Polyplast, and Waaree Energies — each reflecting our commitment to identifying promising founders early and empowering them to build long-term value.
Speaking on this support, Vikas Goyal, MD & CEO of Sambhv Steel Tubes Ltd., said:
“Niveshaay has been more than just an investor — they’ve been a true strategic partner in our growth. Their data-driven insights and on-ground research gave us clarity not just about our business, but the entire industry landscape. From early IPO planning and capital mobilization to stakeholder connections and customer introductions, they’ve supported us at every step. With a long-term mindset and unwavering integrity, they’ve consistently acted like an extension of our team. We deeply value this partnership and look forward to scaling new heights together.”
At Niveshaay, every private-deal partnership helps refine our investment approach. We aim to be more than capital providers—we seek to be true strategic partners. Our collaboration with Sambhv Steel Tubes highlights this ethos, demonstrating that specialist research and deal navigation can turn a differentiated steel-pipe business into a benchmark listing. The insights gained have strengthened our research for listed companies as well and empowered us to back our heroes (entrepreneurs) through our AIFs. We look forward to many more such stories where deep industry expertise and hands-on support create value for both entrepreneurs and investors.
Making things‘Sambhav’ — The Hedgehogs Way at Niveshaay.

Electric Vehicle & Ancillaries
Sambhv Steel Tubes Limited : Integrated, Customised, Future-Ready.
India is building—roads, homes, factories, and everything in between—and steel is the silent backbone of it all. One segment quietly powering this growth is steel tubes and pipes, used in construction, infrastructure, water supply, and even furniture. But in a largely commoditized and price-sensitive industry, how does one company stand out? Introducing Sambhv Steel Tubes
India is building—roads, homes, factories, and everything in between—and steel is the silent backbone of it all. One segment quietly powering this growth is steel tubes and pipes, used in construction, infrastructure, water supply, and even furniture. But in a largely commoditized and price-sensitive industry, how does one company stand out?
Introducing Sambhv Steel Tubes Ltd. A company with a vision, backed by cutting-edge technology, with a state-of-the-art, single-location, fully backward-integrated manufacturing plant – right at the heart of India’s steel nerve centre – Raipur.
At Niveshaay, we spotted this company’s unique trajectory two years ago, and our conviction has only grown stronger with time.
The structural steel tube segment (~9 million TPA), comprising welded pipes, hollow sections, and related products, accounts for roughly ~6% of India’s finished steel consumption and is expected to expand to 8% by FY30 (~16 million TPA), buoyed by increasing preference for steel over traditional materials like RCC in bridges, stations, airports and high-rise buildings.
The Indian steel pipe industry, valued at over ~Rs 1,00,000 crores, and about half of that comes from ERW pipes (Electric Resistance Welded)—and that share is rising.
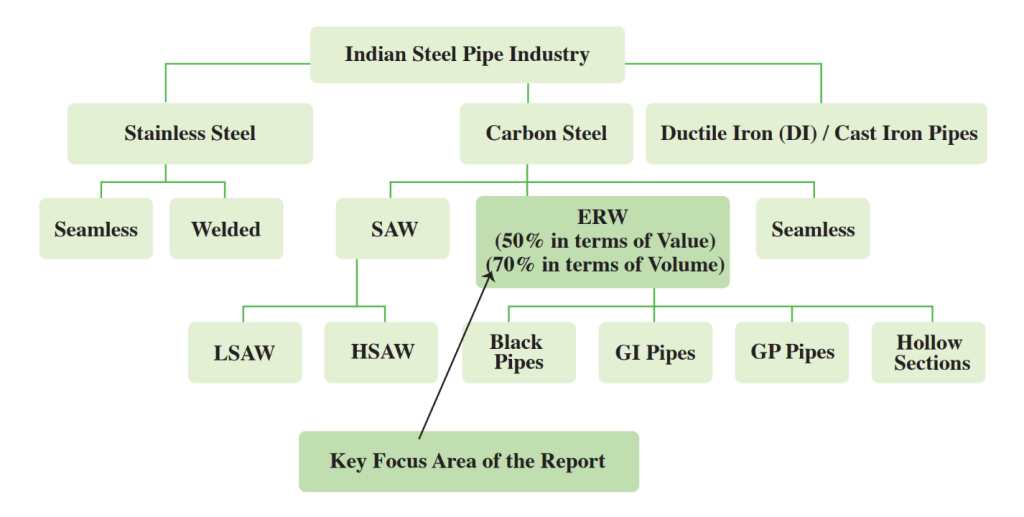
These pipes play a critical role in irrigation, water supply, telecommunications, and structural projects. Their high strength-to-weight ratio, design flexibility, and faster construction timelines (An ERW-based slab can go up in just 8 days v/s 24 days for RCC) offer cost and environmental advantages. Coupled with policy support such as the National Steel Policy’s push to raise per-capita consumption to 158 kg by 2030 and safeguard duties on imports, the industry outlook remains compelling.
Founded in 2018 by the Goyal family in Raipur, Sambhv Steel Tubes Limited transformed a non-performing sponge-iron kiln into a profitable, fully backward-integrated steel-pipe manufacturer.
The Goyals have demonstrated a consistent ability to identify and turn around stressed industrial assets and scale them profitably—an uncommon trait in the cyclical and capital-intensive steel sector.
Sambhv's evolution into a fully integrated steel manufacturing company is testament to that.
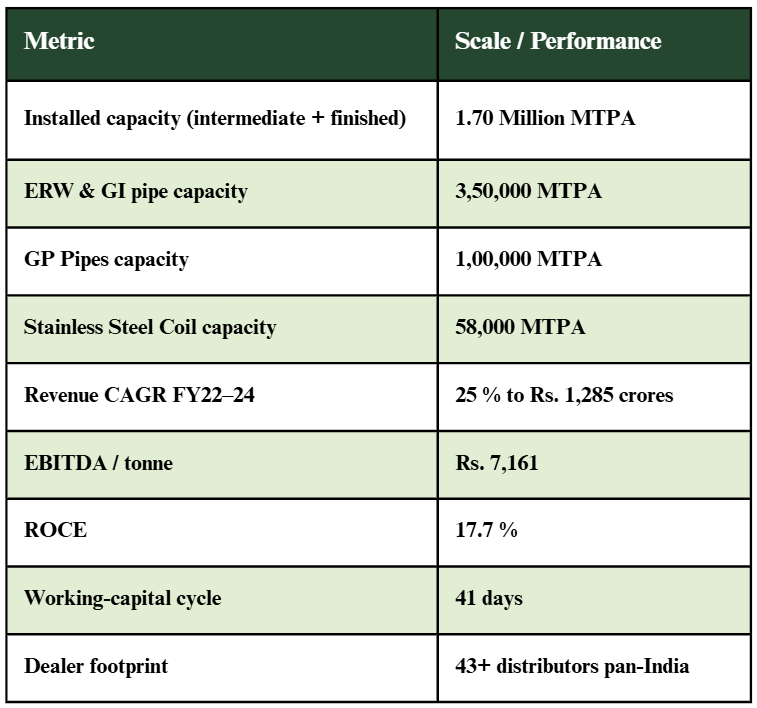

This end-to-end control slashes costs, tightens quality tolerances and locks in margins. By melting DRI in an induction furnace rather than buying pricey HRC, Sambhv achieves primary-grade properties at secondary costs, sustaining margins even in steel down-cycles.
Sambhv has moved well beyond basic pipes by integrating its proprietary narrow-width HR coil capability with new, higher-margin products—GP coils, pre-galvanized (GP) pipes, and stainless-steel HRAP/CR coils, allowing Sambhv to serve specialized, value-added sectors.
This shift is significant because these segments offer higher realizations and stronger EBITDA per tonne compared to standard ERW pipes.
As of FY25, Sambhv operates across two integrated facilities in Sarora and Kuthrel, Raipur.
In response to growing market demand, the company is also expanding its capacity with 1.2 Million MTPA Kesda plant (Chhattisgarh) in three phases.
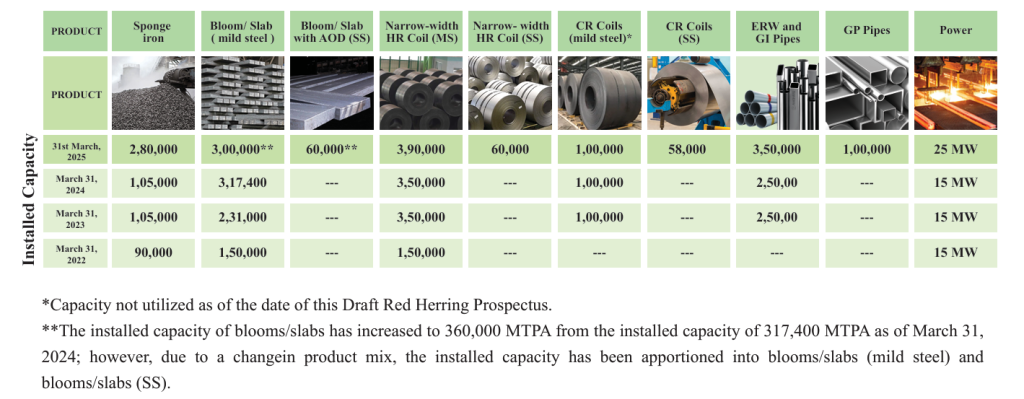
In sectors like steel pipes, where capital intensity is high and margins are often a function of operational excellence, we believe execution and promoter capability play a defining role in long term value creation. Our investment in Sambhv Steel Tubes is anchored in the company’s strong execution track record, efficient internal capital deployment, and end-to-end integration that gives it unmatched control over cost, quality, and supply chain.
Our journey with Sambhv began in 2023. On-site diligence, meetings with management, visits to the Raipur facility and distributor touchpoints confirmed a culture of disciplined execution, swift decision-making and strong brand pull. Its unique ability to produce narrow-width HR coils in-house (controls the thickness and surface quality of steel with high precision) not only enhances efficiency but positions the company to compete on both cost and quality fronts.
Another thing that struck out was despite a demand slowdown during the 2024 general elections, Sambhv continued to grow volumes, driven by rising adoption of ERW pipes over RCC structures. Within months of our Rs. 150 crore investment at a Rs. 750 crore valuation, the company had commissioned a stainless-steel coil line and added an advanced galvanizing unit—moves that placed Sambhv in an exclusive club of just three or four Indian players. The promoters’ ability to scale the business and build a reliable brand stood out. Since its inception in 2018, the company has rapidly scaled, commissioning stainless steel coil and GP pipe capacities, and expanding total installed capacity from 390,000 MTPA in FY22 to 1.70 million MTPA by March 2025.
For us at Niveshaay, Sambhv fits our investment framework: a niche play within a large industry, fortified by deep cost advantages, alignment across the value chain, and aggressive yet disciplined expansion. Backing a company that integrates everything from DRI to ERW, GP and stainless-steel pipes under one roof—and consistently delivers on its growth ambitions—remains exactly the kind of high-impact, under-the-radar opportunity we seek.
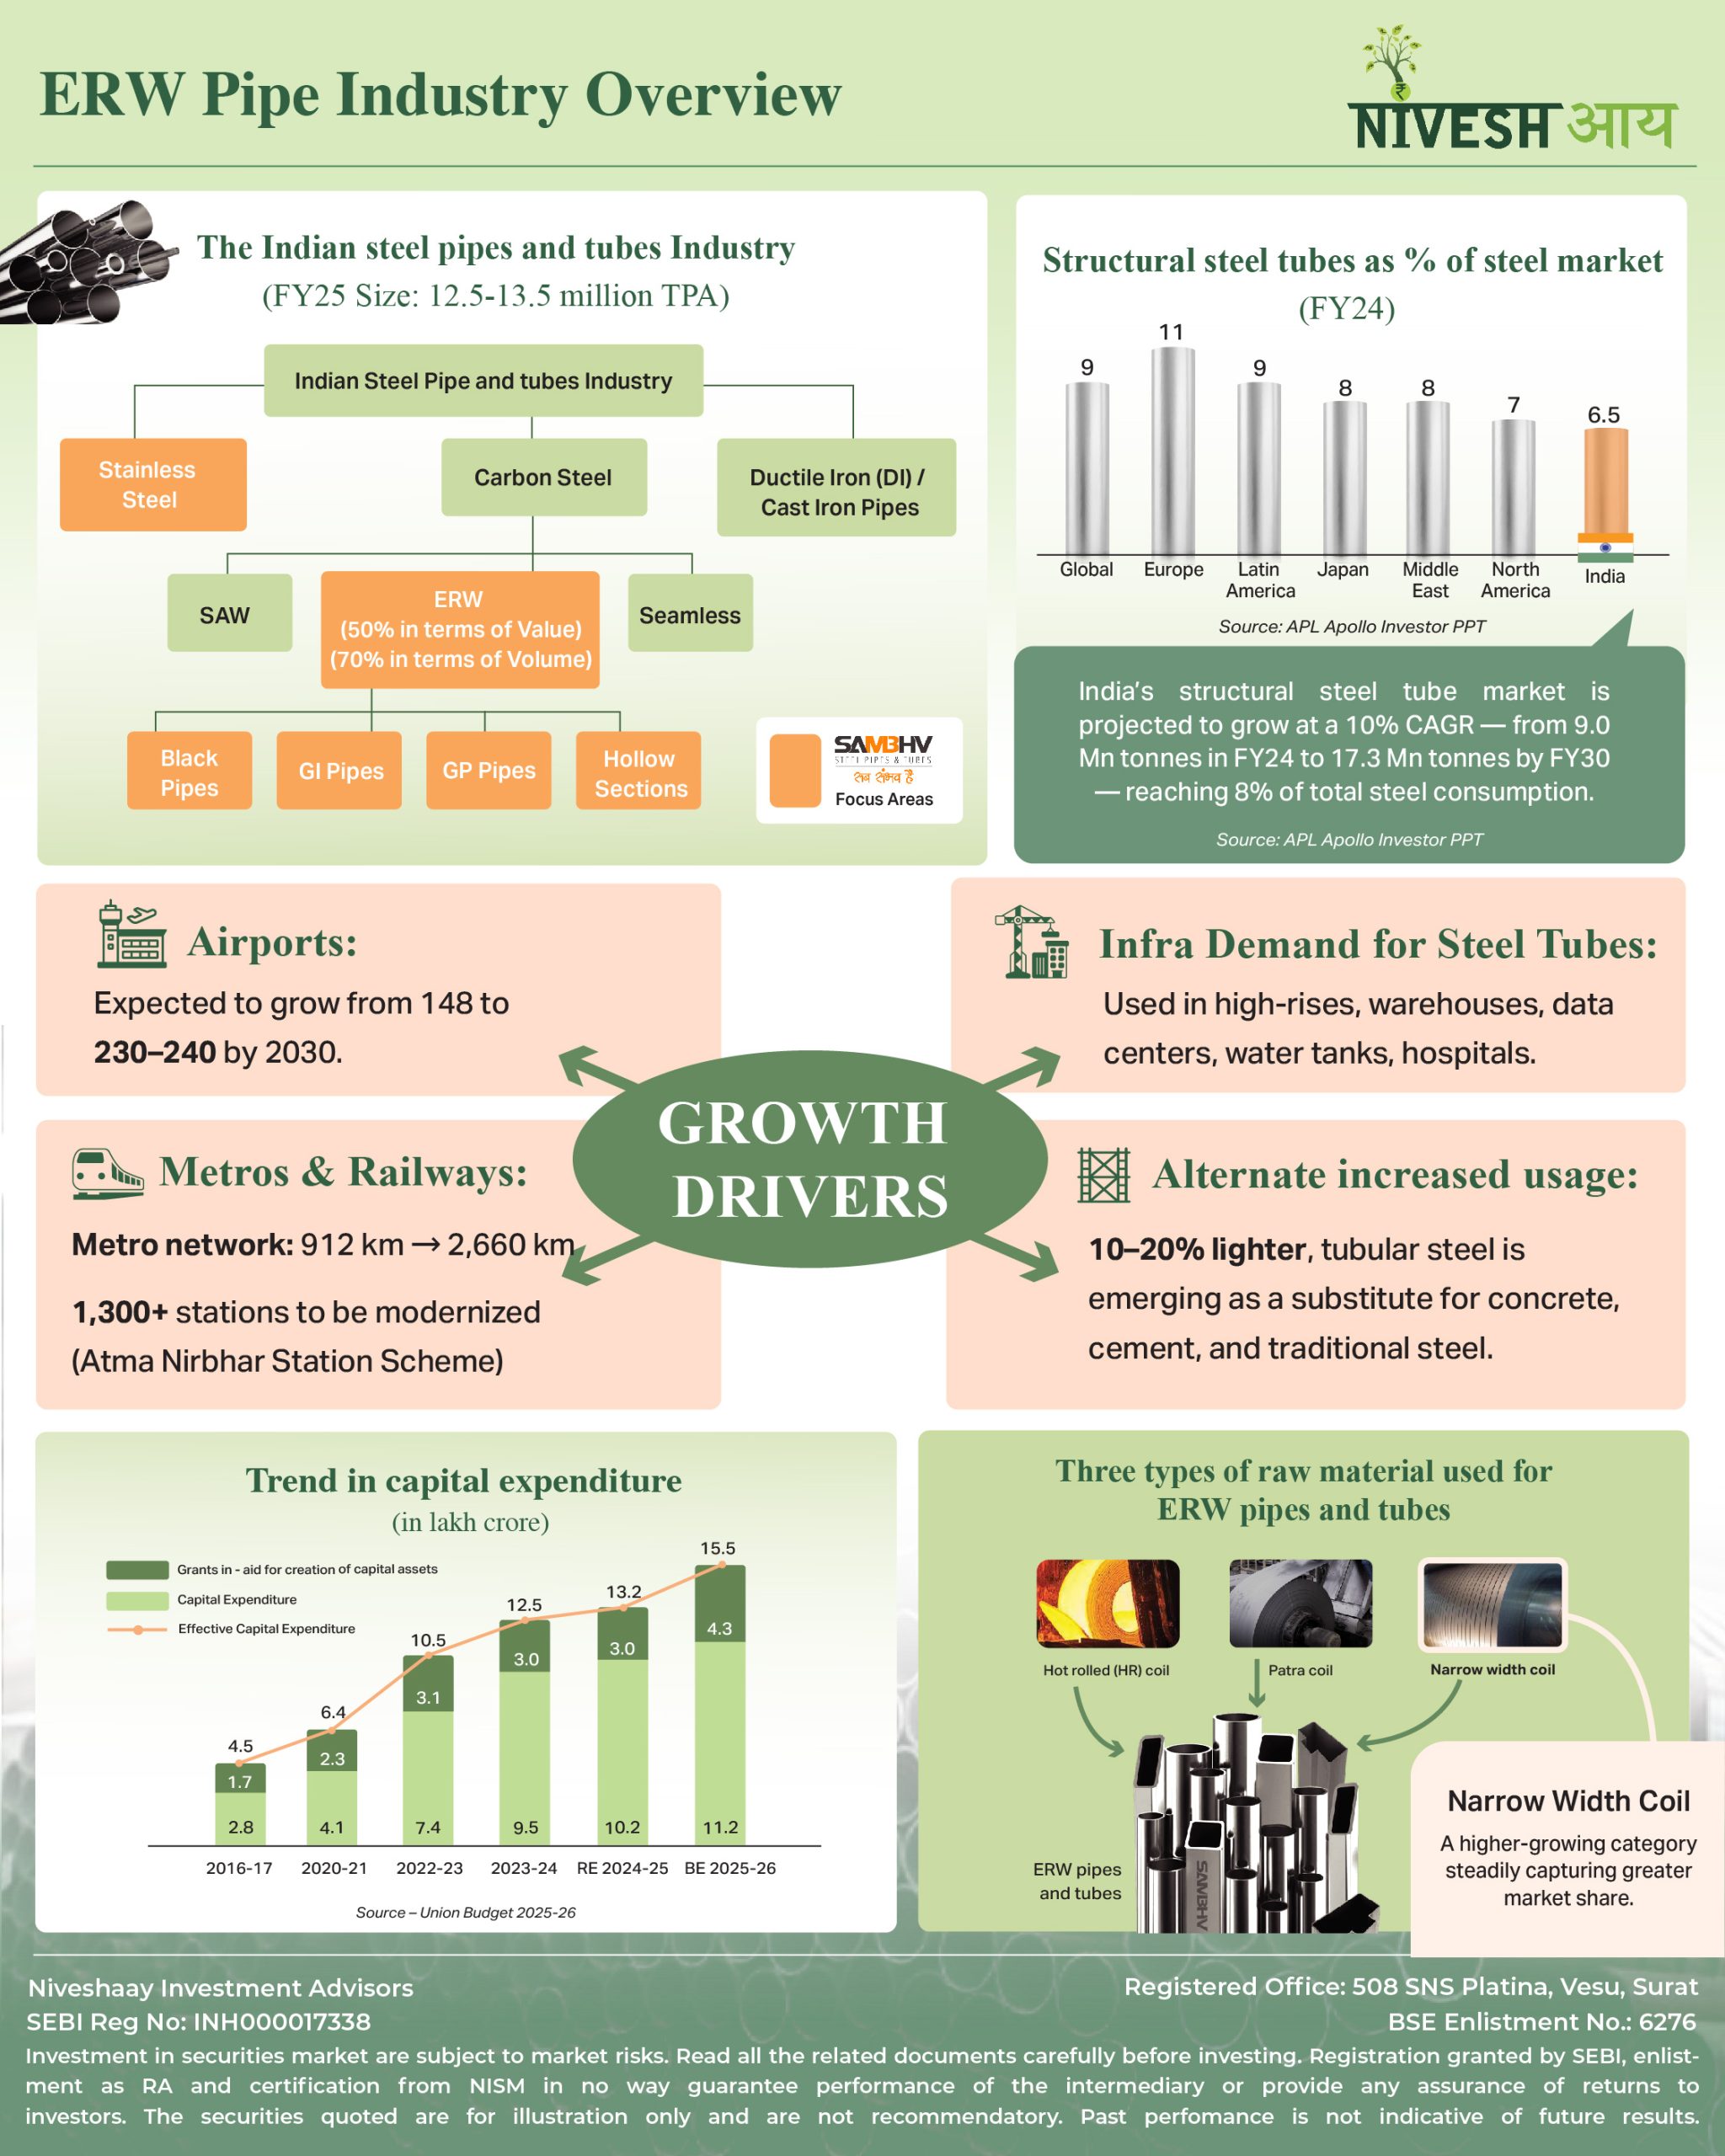
Metals & Mining
ERW Pipe Industry Overview
In just 7 years, Sambhv Steel Tubes Ltd. has emerged as one of India’s most integrated and future-ready ERW steel pipe manufacturers.- Fully backward-integrated from sponge iron to finished pipes- Tailor-made solutions for diverse industrial applications- Cost-efficient scale with single-location synergy- Now listed on the Main Board, marking a bold new growth chapter.
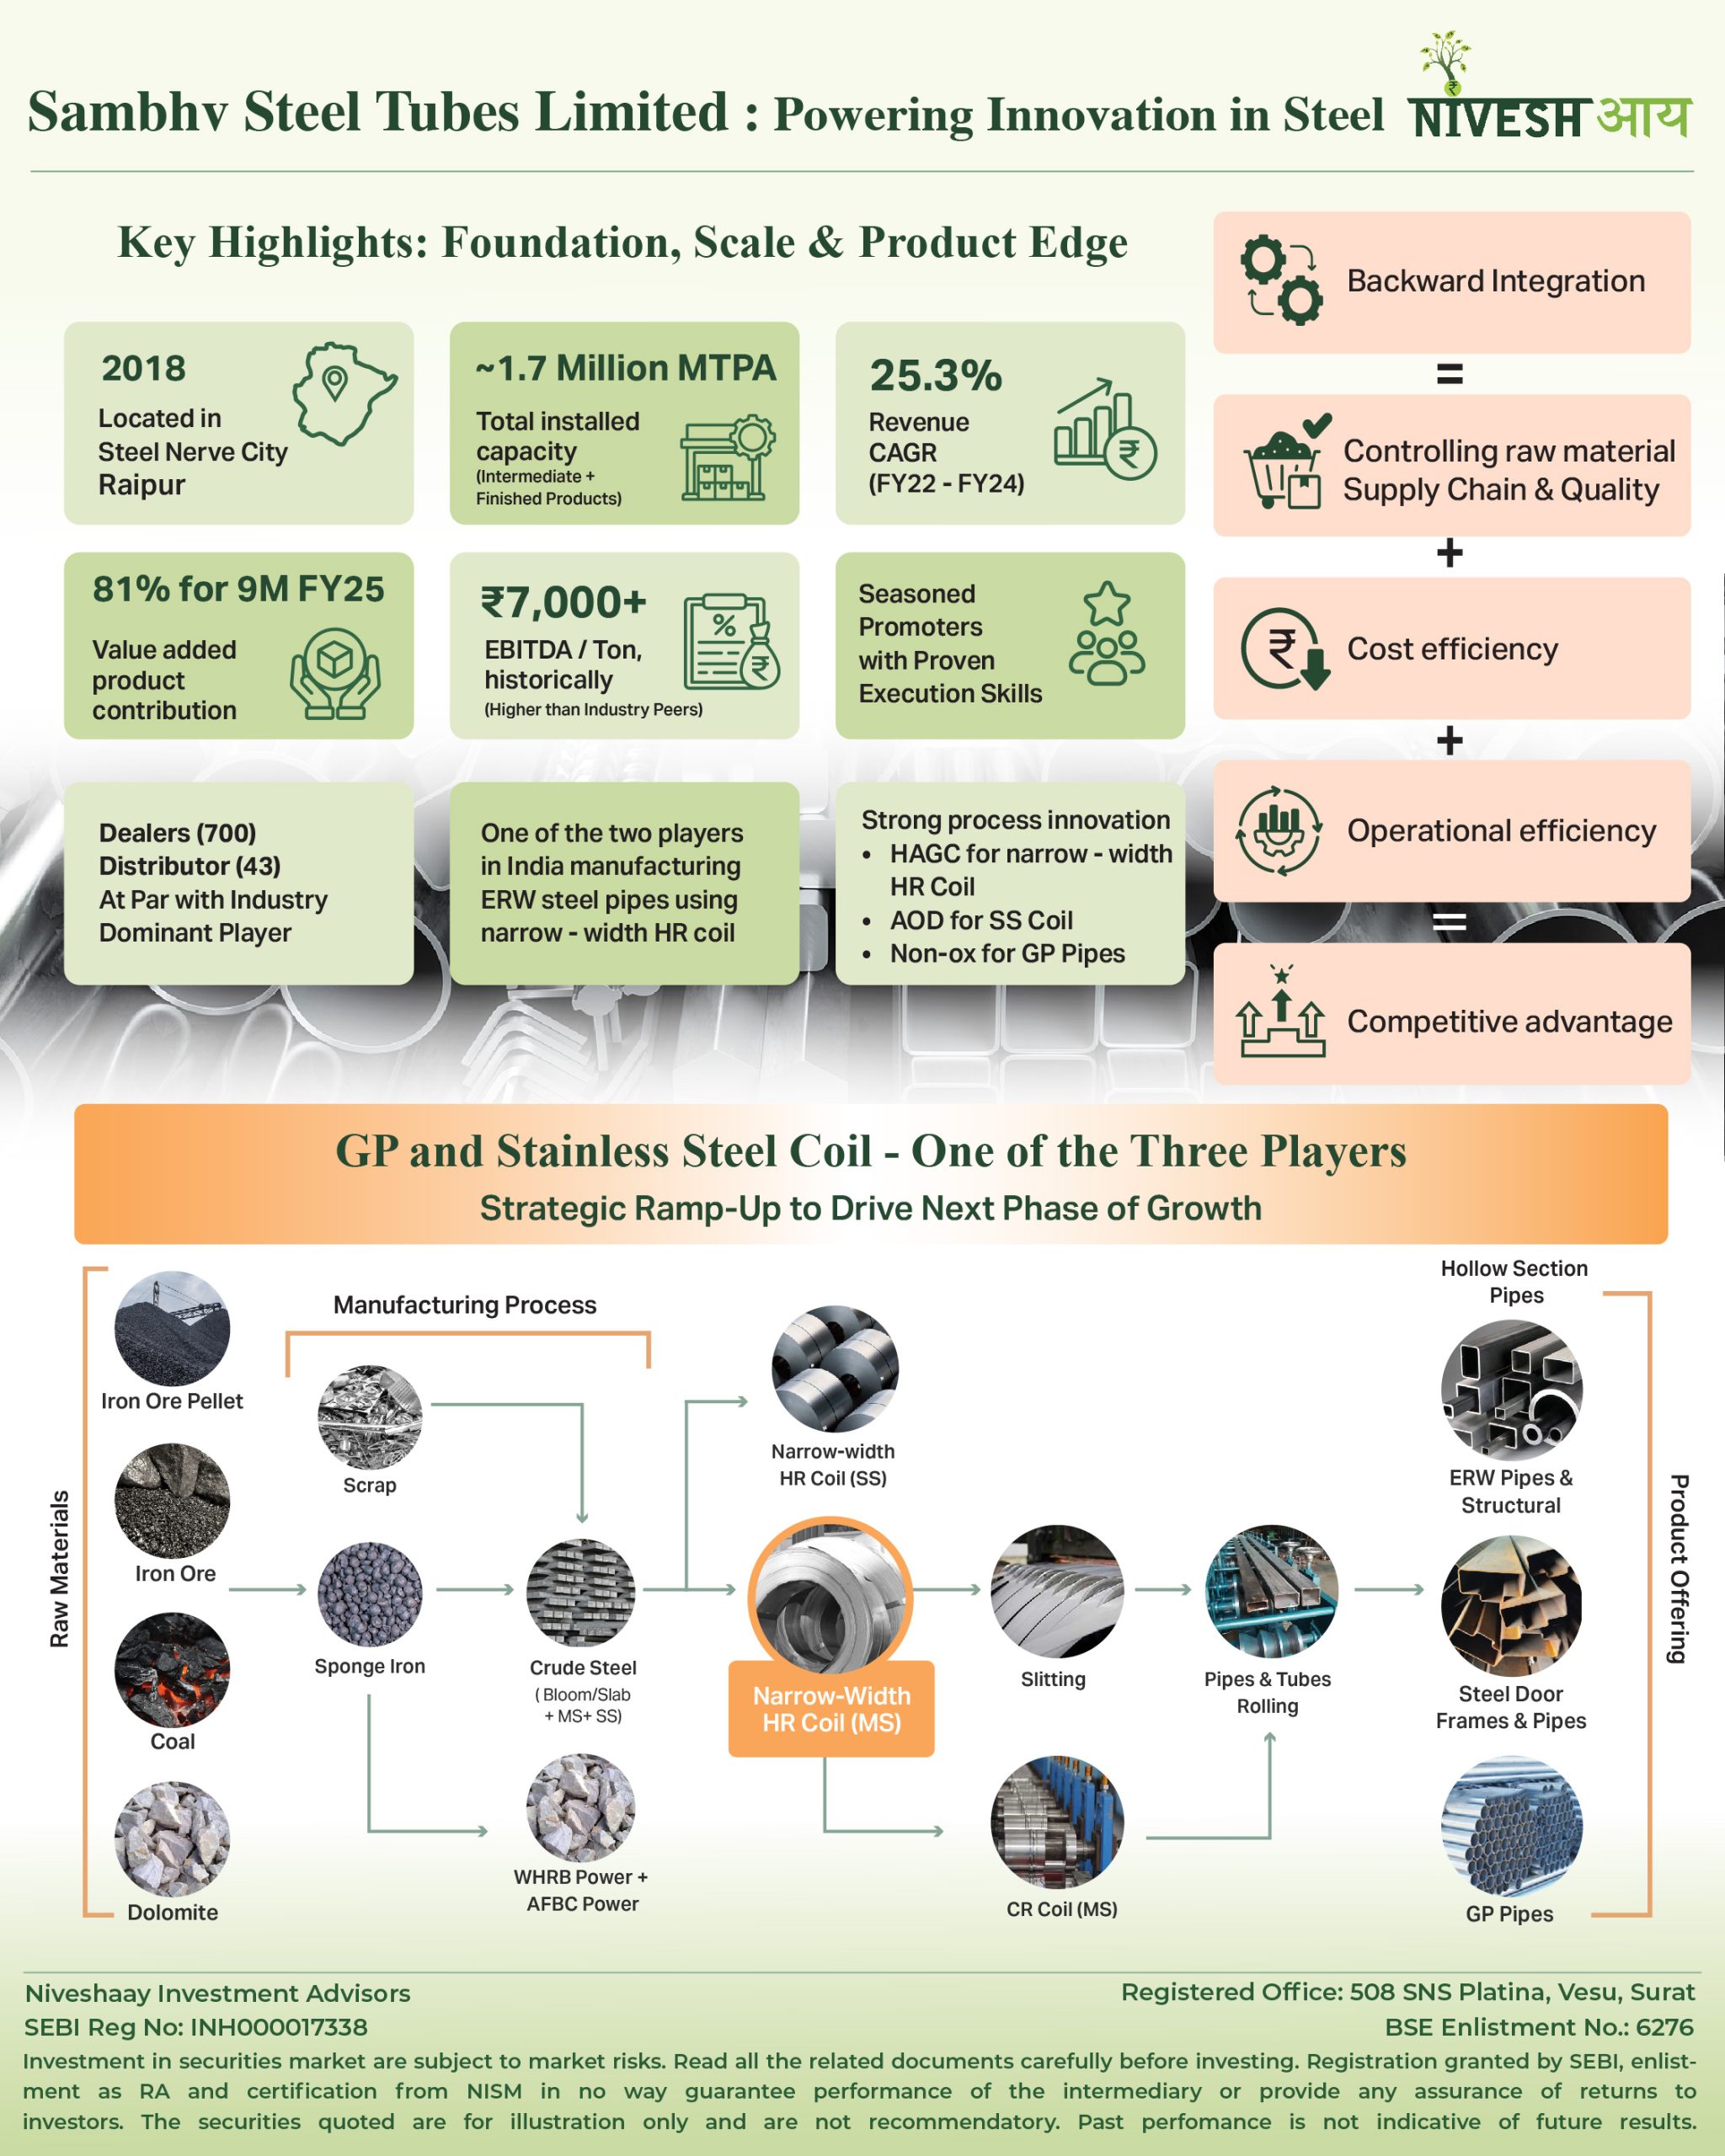
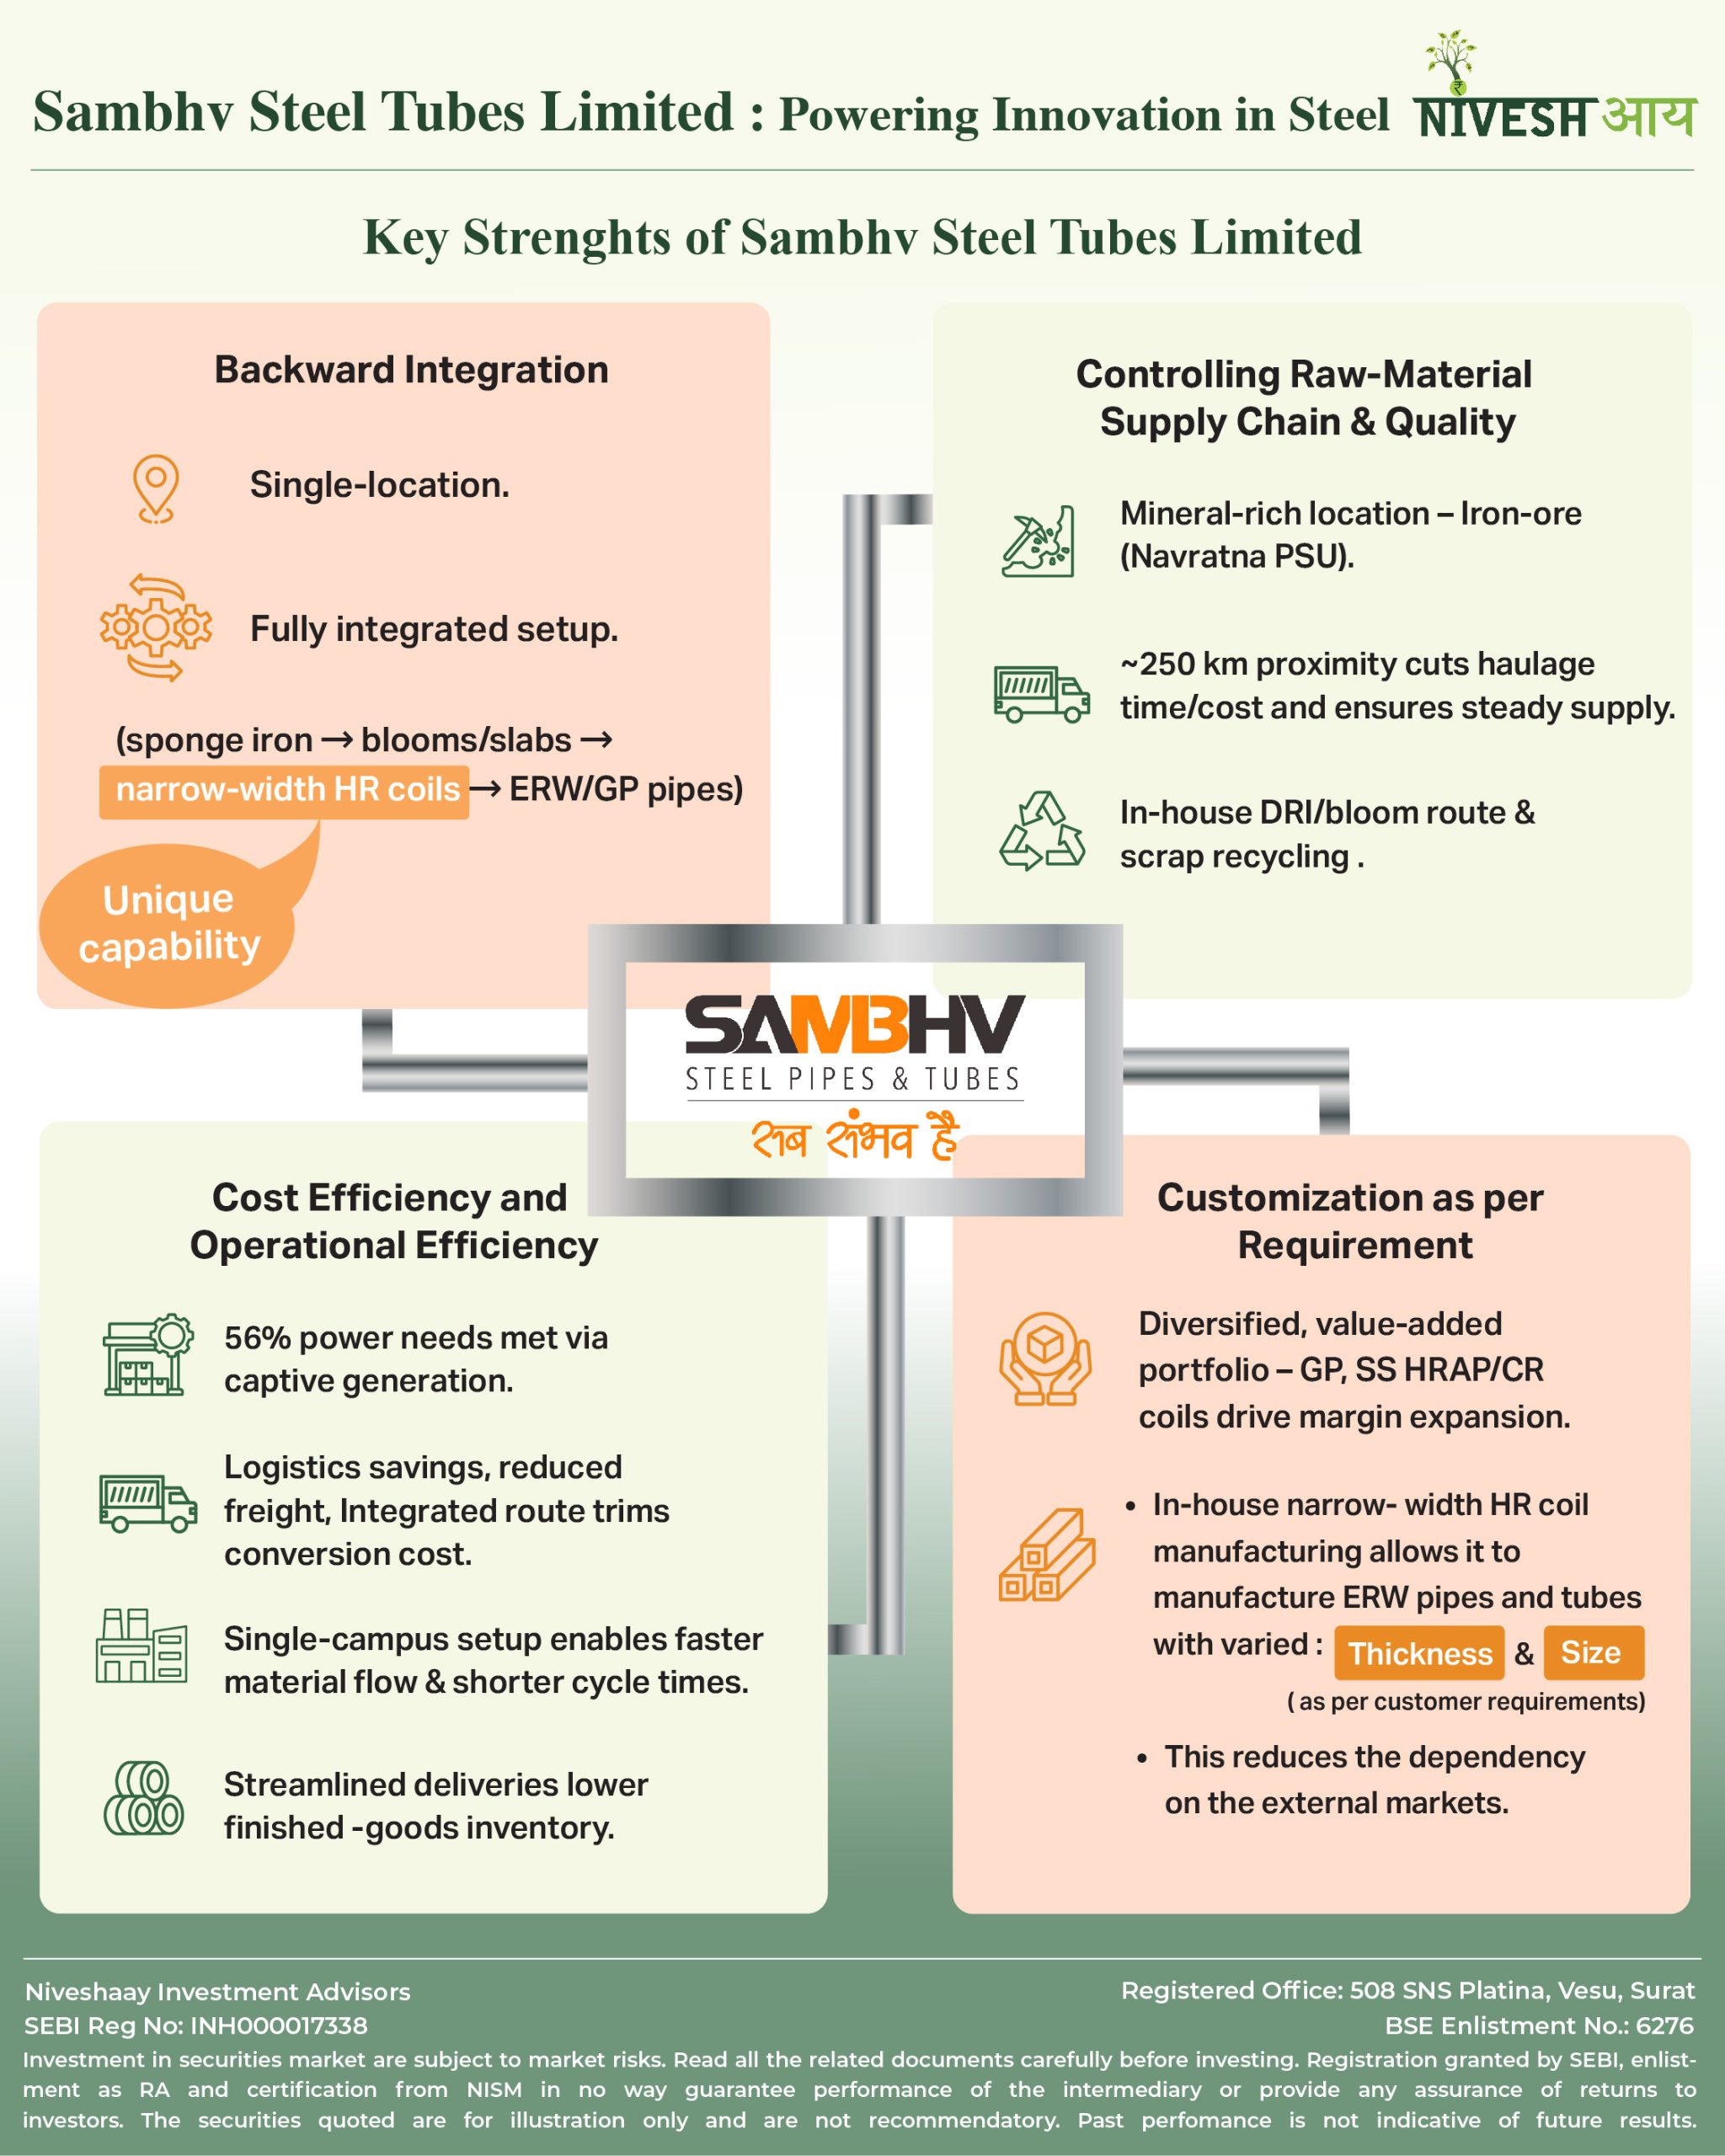
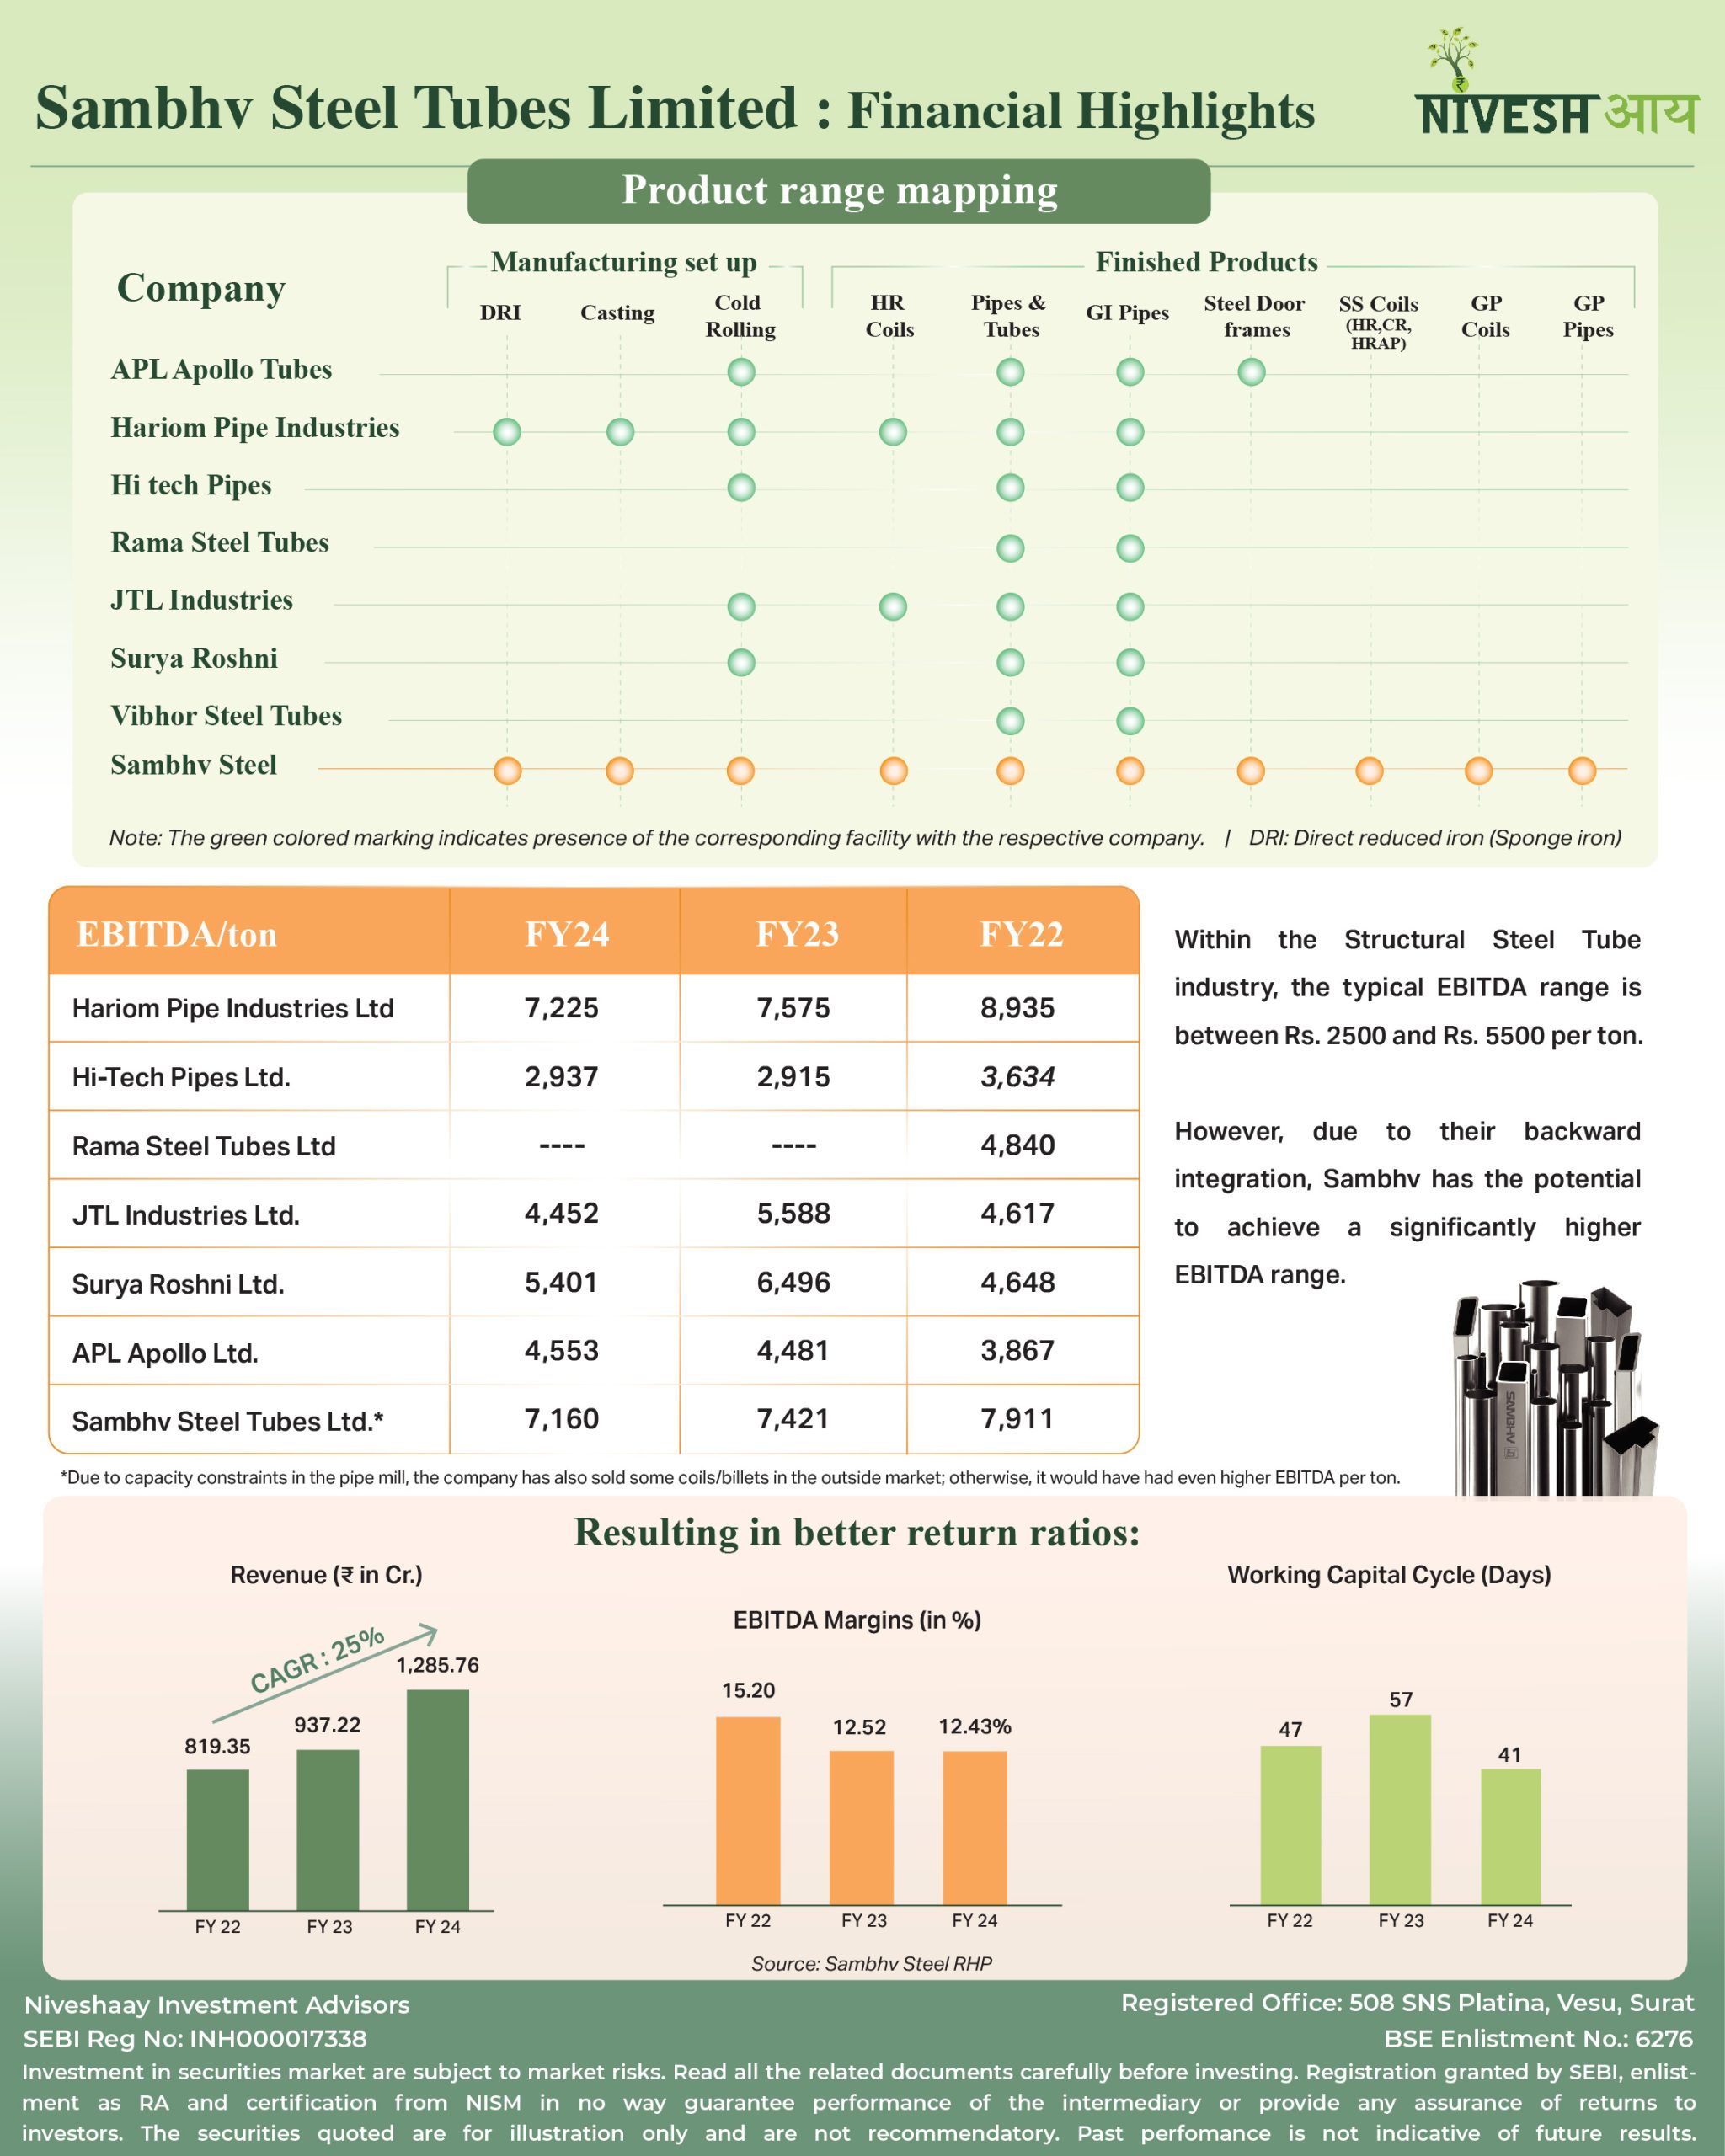
In just 7 years, Sambhv Steel Tubes Ltd. has emerged as one of India’s most integrated and future-ready ERW steel pipe manufacturers.
– Fully backward-integrated from sponge iron to finished pipes
– Tailor-made solutions for diverse industrial applications
– Cost-efficient scale with single-location synergy
– Now listed on the Main Board, marking a bold new growth chapter.
Electronic Manufacturing Services
India’s Defence Sector: From Dependent to Dominant
From DPP 2002 to DAP 2020, India’s defence procurement has evolved from a slow, import-dependent structure to a fast-tracked, indigenous-first ecosystem — unlocking a ₹3 lakh crore domestic opportunity and a ₹50,000 crore export ambition by 2030.
It started quietly
A policy here. A reform there. A shift in mindset.
Then it picked up speed.
The defence sector is no longer what it used to be.
India, once a heavy importer, is now pushing the limits of innovation.
The evolution of India’s Defence Procurement Procedure (DPP) from 2002 to the Defence Acquisition Procedure (DAP) 2020 marks a significant shift from an import-dependent model to an indigenous, innovation-driven ecosystem. Starting with transparency reforms and the introduction of offsets in the early 2000s, the major turning point came in 2016 with the introduction of the Indigenous Design, Development, and Manufacturing (IDDM) category, prioritizing local design and production. DAP 2020 further accelerated this transformation with rationalized offsets, positive indigenisation lists, and support for startups and MSMEs.
The IDDM policy (Indigenous Design, Development, and Manufacturing) introduced in 2016 turned the tables. It made self-reliance a priority. Indigenous procurement has risen from ~25% in 2014 to ~68-70% in 2024, defence production value has grown from ₹70,000 crore to ₹1.27 lakh crore, and exports have surged from ₹6,600 crore to ₹24,000 crore, positioning India’s defence sector for a ₹3 lakh crore output and ₹50,000–60,000 crore in exports by 2030.
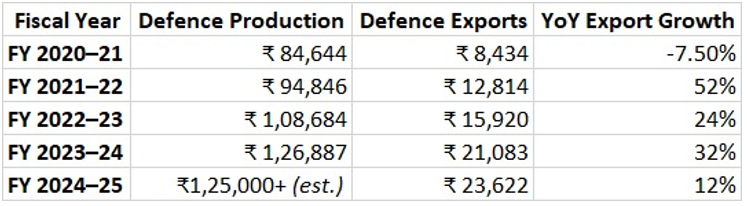
A New Era: India’s Defence Ecosystem and Emerging Opportunities
Historically, India depended heavily on foreign suppliers for critical defence equipment. While public sector undertakings (PSUs) like HAL and DRDO laid the foundation for indigenous capabilities, progress was slow and often limited to licensed production. However, the past decade has seen a decisive pivot. The turning point came with the launch of the “Make in India” initiative. This policy framework catalyzed private sector participation, streamlined procurement processes, and emphasized self-reliance. The introduction of Positive Indigenisation Lists, banning the import of over 5,500 items, created a guaranteed market for domestic manufacturers. With dedicated defence corridors in Uttar Pradesh and Tamil Nadu, liberalized FDI policies, and a more inclusive industrial approach, the private sector has moved from the sidelines to the centre of India’s defence ambitions.
Global geopolitics has only accelerated this trajectory. The disruption caused by the Russia-Ukraine conflict has forced nations to diversify their defence procurement away from traditional suppliers. India, with its neutral diplomatic posture and maturing industrial base, has emerged as a reliable alternative. Indian-made 155mm artillery shells, missile systems, and secure communication technologies are now finding demand from countries across Europe, Africa, and Southeast Asia. More importantly, India is not just supplying — it is co-developing solutions, moving up the value chain from being a manufacturing hub to becoming a partner in next-generation system development. Defence exports, which stood at ₹6,600 crore in 2014-15, have surged to ₹24,000 crore in 2023-24. The government has laid out an ambitious target of ₹50,000 to ₹60,000 crore in exports by 2030, firmly placing India among the leading defence exporters globally.
At the core of this transformation lies a robust and multi-layered defence ecosystem. India has moved beyond traditional arms imports and licensed production models, establishing itself in areas like missile technology, unmanned systems, counter-drone technologies, and aerospace platforms. Indigenous missile programs such as BrahMos, Akash, and Astra have matured to the point where India is not just self-reliant but is actively pursuing export markets. Meanwhile, India’s focus on developing combat drones and surveillance UAVs, alongside indigenous initiatives in naval platforms like destroyers and submarines, underscores the ambition to secure a dominant share in both regional and global markets. In aerospace, the success of platforms like the Tejas Light Combat Aircraft and Light Combat Helicopters (LCH) marks India’s transition from licensed assembly to full-cycle manufacturing and system integration.
However, the real revolution is unfolding in enabling and emerging defence technologies. India is rapidly innovating in electronic warfare systems, secure communications, and counter-drone solutions. As warfare evolves into domains driven by cyber, space, and unmanned systems, India’s defence manufacturing base is keeping pace. Indigenous firms are leading advancements in radar, sonar, and jamming technologies, while secure encrypted communications — essential for network-centric warfare — are becoming core competencies for Indian companies. The counter-drone segment, in particular, is witnessing explosive growth. India’s response to the growing threat from UAVs involves cutting-edge solutions ranging from RF jammers to hard-kill laser interceptors, positioning the country as a key player in what is fast becoming a global security priority.
The scale of this transformation is best understood through numbers. These projections are not aspirational; they are anchored in structured policy support and market shifts that India is exploiting astutely.
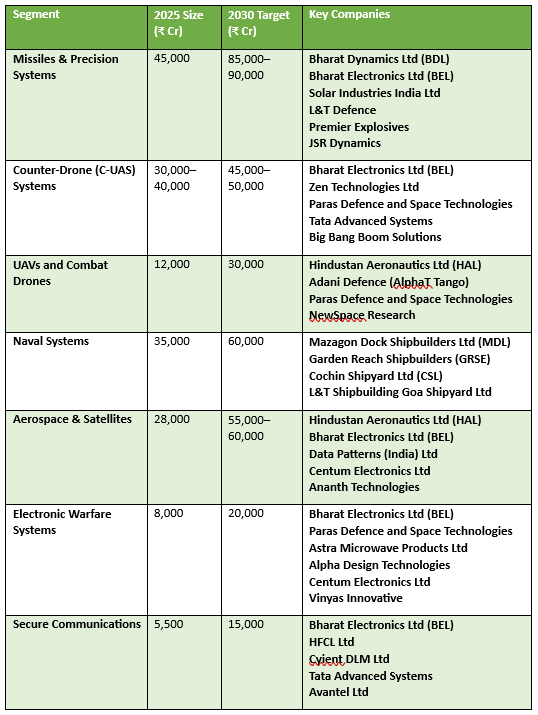
Niveshaay’s Approach to India’s Defence Manufacturing Shift
India’s defence and aerospace sector is undergoing a profound transformation. At Niveshaay, we believe this shift is not just policy-driven but powered by a new generation of companies — entrepreneurs and engineers who are quietly building the backbone of India’s strategic independence.
While evaluating opportunities in India’s growing defence and aerospace sector, we focused on companies deeply aligned with the Make in India initiative, offering differentiated capabilities and addressing critical gaps historically filled by imports. In building a truly self-reliant defence sector, it rests equally on two critical pillars: companies that innovate at the system level through research and development, and companies that quietly supply mission-critical subsystems and components, enabling these platforms to perform.
Our approach to investing in India’s defence and aerospace sector reflects this dual view. Our conviction in India’s defence sector is reflected in the companies we have invested in — businesses building indigenous capabilities across missile systems, aerospace, secure communications, and defence electronics.
Companies like Zen Technologies, Avantel, and JSR Dynamics represent this cohort. These are businesses that believed early in their ability to develop indigenous technologies — simulators, secure communications systems, and precision-guided munitions — and have built strong positions through sustained R&D efforts.
On the other side are companies like Centum Electronics, Vinyas Innovative Technologies, HBL Power Systems, and Premier Explosives. These companies provide the essential subsystems — defence-grade electronics, power solutions, and specialized propellants — that power India’s strategic platforms across land, air, sea, and space. While they operate behind the scenes, their contribution is indispensable to the functioning and reliability of complex defence systems.
Below, we share a closer look at select companies from both categories that we once invested with, each playing a unique role in strengthening India’s defence and aerospace future.
Zen Technologies Ltd.
Zen Technologies exemplifies the power of perseverance and indigenous innovation in India’s defence sector. In the early 2010s, while larger players hesitated, Zen was quietly building live-virtual-constructive simulators and developing early prototypes for counter-drone systems around 2017— a segment still nascent globally. Despite facing slow-moving defence procurements, Zen stayed the course, refining its simulators through Army field exercises and rigorously improving its drone detection and neutralization technologies. This commitment paid off with significant order wins, and today, Zen stands as a market leader in military simulators and counter-drone technologies, offering solutions critical for modern battlefield readiness and homeland security.
Avantel Ltd.
Avantel’s journey reflects the same ethos of disciplined innovation and resilience. Focused on secure communications, Avantel invested early in developing encrypted microwave links and ruggedized communication routers, often embedding ex-servicemen and DRDO veterans to fine-tune its offerings. Unlike many contemporaries who scaled back during procurement delays, Avantel doubled down on R&D, iteratively hardening its products for real-world military requirements. By 2018, Avantel’s persistence was rewarded with a multi-year contract to supply secure communication systems to armoured divisions — a move that transitioned the company from break-even to consistent profitability. Today, Avantel is recognized for its critical role in delivering secure, resilient communications infrastructure for India’s armed forces, with a strong reputation for reliability in hostile environments.
Centum Electronics Ltd.
Centum Electronics stood out for its role as a key ancillary partner to India’s aerospace, defence, and space programs. Their full-stack capability — from design to mass manufacturing — and deep partnerships with clients like DRDO, ISRO, and Thales have made them strategic contributors to marquee projects like Chandrayaan, Mangalyaan, Aditya-L1, and the T-90 tank upgrade. Their move towards complete satellite builds and system integration further strengthens their positioning as India scales up space situational awareness and ISR capabilities.
Vinyas Innovative Technologies Ltd.
In Vinyas Innovative Technologies, we found a company advancing India’s defence indigenisation agenda through its participation in critical programs like multifunction naval radars, AESA radars, and UAV payloads. Their transition from PCB assembly to qualified system integration, coupled with critical global certifications, positions them well to serve both domestic and export-controlled markets, aligning with the long-cycle defence electronics opportunity we see emerging.
HBL Power Systems Ltd.
HBL Power Systems impressed us with its niche focus on high-complexity defence technologies like submarine batteries, thermal batteries for strategic missiles, and electronic artillery fuzes — areas with limited competition. Their sustained in-house R&D efforts and strategic backing of companies like Tonbo Imaging reflect a broader commitment to building indigenous defence capabilities. We see HBL as a key beneficiary as India shifts from imports to local manufacturing in strategic technologies.
Premier Explosives Ltd.
Premier Explosives caught our interest due to its position as the sole indigenous manufacturer of chaffs, flares, and solid propellants critical to India’s missile programs, including Astra, Akash, LRSAM/MRSAM, and Agni. Its approved supplier status for ISRO’s PSLV program further extends its strategic relevance. The company’s focus on specialized defence and space-grade explosives, supported by in-house R&D capabilities and limited domestic competition, aligns closely with critical national security and space infrastructure requirements.
JSR Dynamics Ltd.
Finally, JSR Dynamics caught our attention with its R&D-led approach to precision-guided munitions (PGMs) — glide bombs, decoys, and range extension kits — where dependency on imports has traditionally been high. With complete in-house design and IP ownership under the leadership of Air Marshal Shirish B. Deo (Retd), and a strong order book from premier defence clients, JSR is uniquely placed to capture a significant share of India’s growing guided weapons market.
These companies adopted a common formula: maintain discipline through downturns, continue R&D when others paused, and refine products relentlessly based on real-world feedback. Their growth was neither sudden nor accidental; it was the outcome of slow and deliberate execution. Together, these companies represent differentiated plays on India’s defence self-reliance journey, each targeting strategic areas where the demand is structural, giving us long-term confidence in their growth trajectory.
Global Military Budgets Surge
In 2024, global military spending reached an unprecedented $2.72 trillion, reflecting a 9.4% increase from the previous year, driven largely by escalating geopolitical tensions in Europe and the Middle East. Europe saw a 17% rise in military expenditure, reaching $693 billion, with Germany’s spending increasing by 28% to $88.5 billion, Poland’s by 31% to $38.0 billion, and Russia’s by 38% to $149 billion, surpassing Cold War-era levels. The Middle East also saw significant growth, with military expenditure reaching an estimated $243 billion, up 15% from 2023, and Israel’s military spending surging by 65% to $46.5 billion, the largest increase since the Six-Day War in 1967. In Asia, China’s military expenditure grew by 7% to $314 billion, marking three decades of continuous growth, while Japan’s spending rose by 21% to $55.3 billion, the largest annual increase since 1952. Meanwhile, the USA, maintaining its position as the largest military spender, saw a 5.72% increase in its defence budget, bringing it to approximately $877 billion, a reflection of ongoing global security concerns and military expansion efforts.
Global Military Expenditure: A Surge in 2024
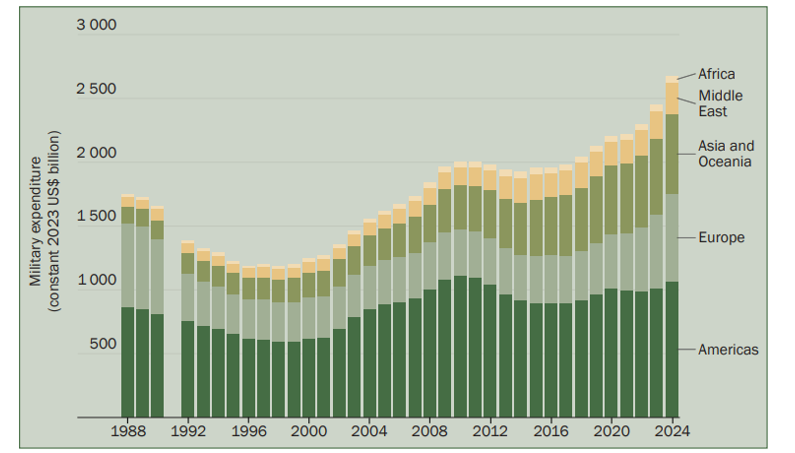
Source: SIPRI Military Expenditure Database, Apr. 2025
Indias defence expenditure increased by 4.6% from $82.29 billion in 2023 to $86.12 billion in 2024. India’s defense sector is experiencing significant growth, with major private players like Tata, L&T, and Adani increasing investments and consolidating capabilities. The private sector now contributes around 20.8% of India’s total defence production, valued at ₹1.27 lakh crore in FY24, and accounts for 60% of defence exports. Tata Advanced Systems is forming a unified defence arm (Tata A&D) by merging its defence businesses to focus on larger, global projects. L&T is producing Zorawar light tanks and advanced submarine systems, while Adani Defence is expanding its portfolio through strategic acquisitions and joint ventures.
The defence ecosystem is rapidly evolving, which includes critical suppliers of raw materials, components, and specialized machinery for defence systems. The increasing number of defence-tech startups is further bolstering the ecosystem, providing innovative solutions in areas such as artificial intelligence, machine learning, and robotics, thereby contributing to the overall technological sophistication. The government’s push for indigenization under the “Make in India” initiative has spurred the creation of state-of-the-art manufacturing facilities and has attracted global players to establish joint ventures and technology transfer agreements, further enhancing domestic production capabilities.
The sector is also witnessing a shift towards high-growth opportunities, driven by strong government support and rising investments. In FY24 alone, ₹2,000 crore was invested in defence-tech startups. Post the India-Pakistan war, the Indian defence sector is becoming an increasingly attractive area for investors. Heightened tensions would likely lead to increased defence spending driven by emergency procurement. However, investors should be mindful of challenges such as lengthy order execution, long inventory cycles, and working capital management. Despite these hurdles, the rising deal flow and increased fundraising activity signal robust opportunities, with the potential for high rewards.
The journey is far from over, and we continue to explore more opportunities aligned with India’s shift toward self-reliance and global competitiveness.
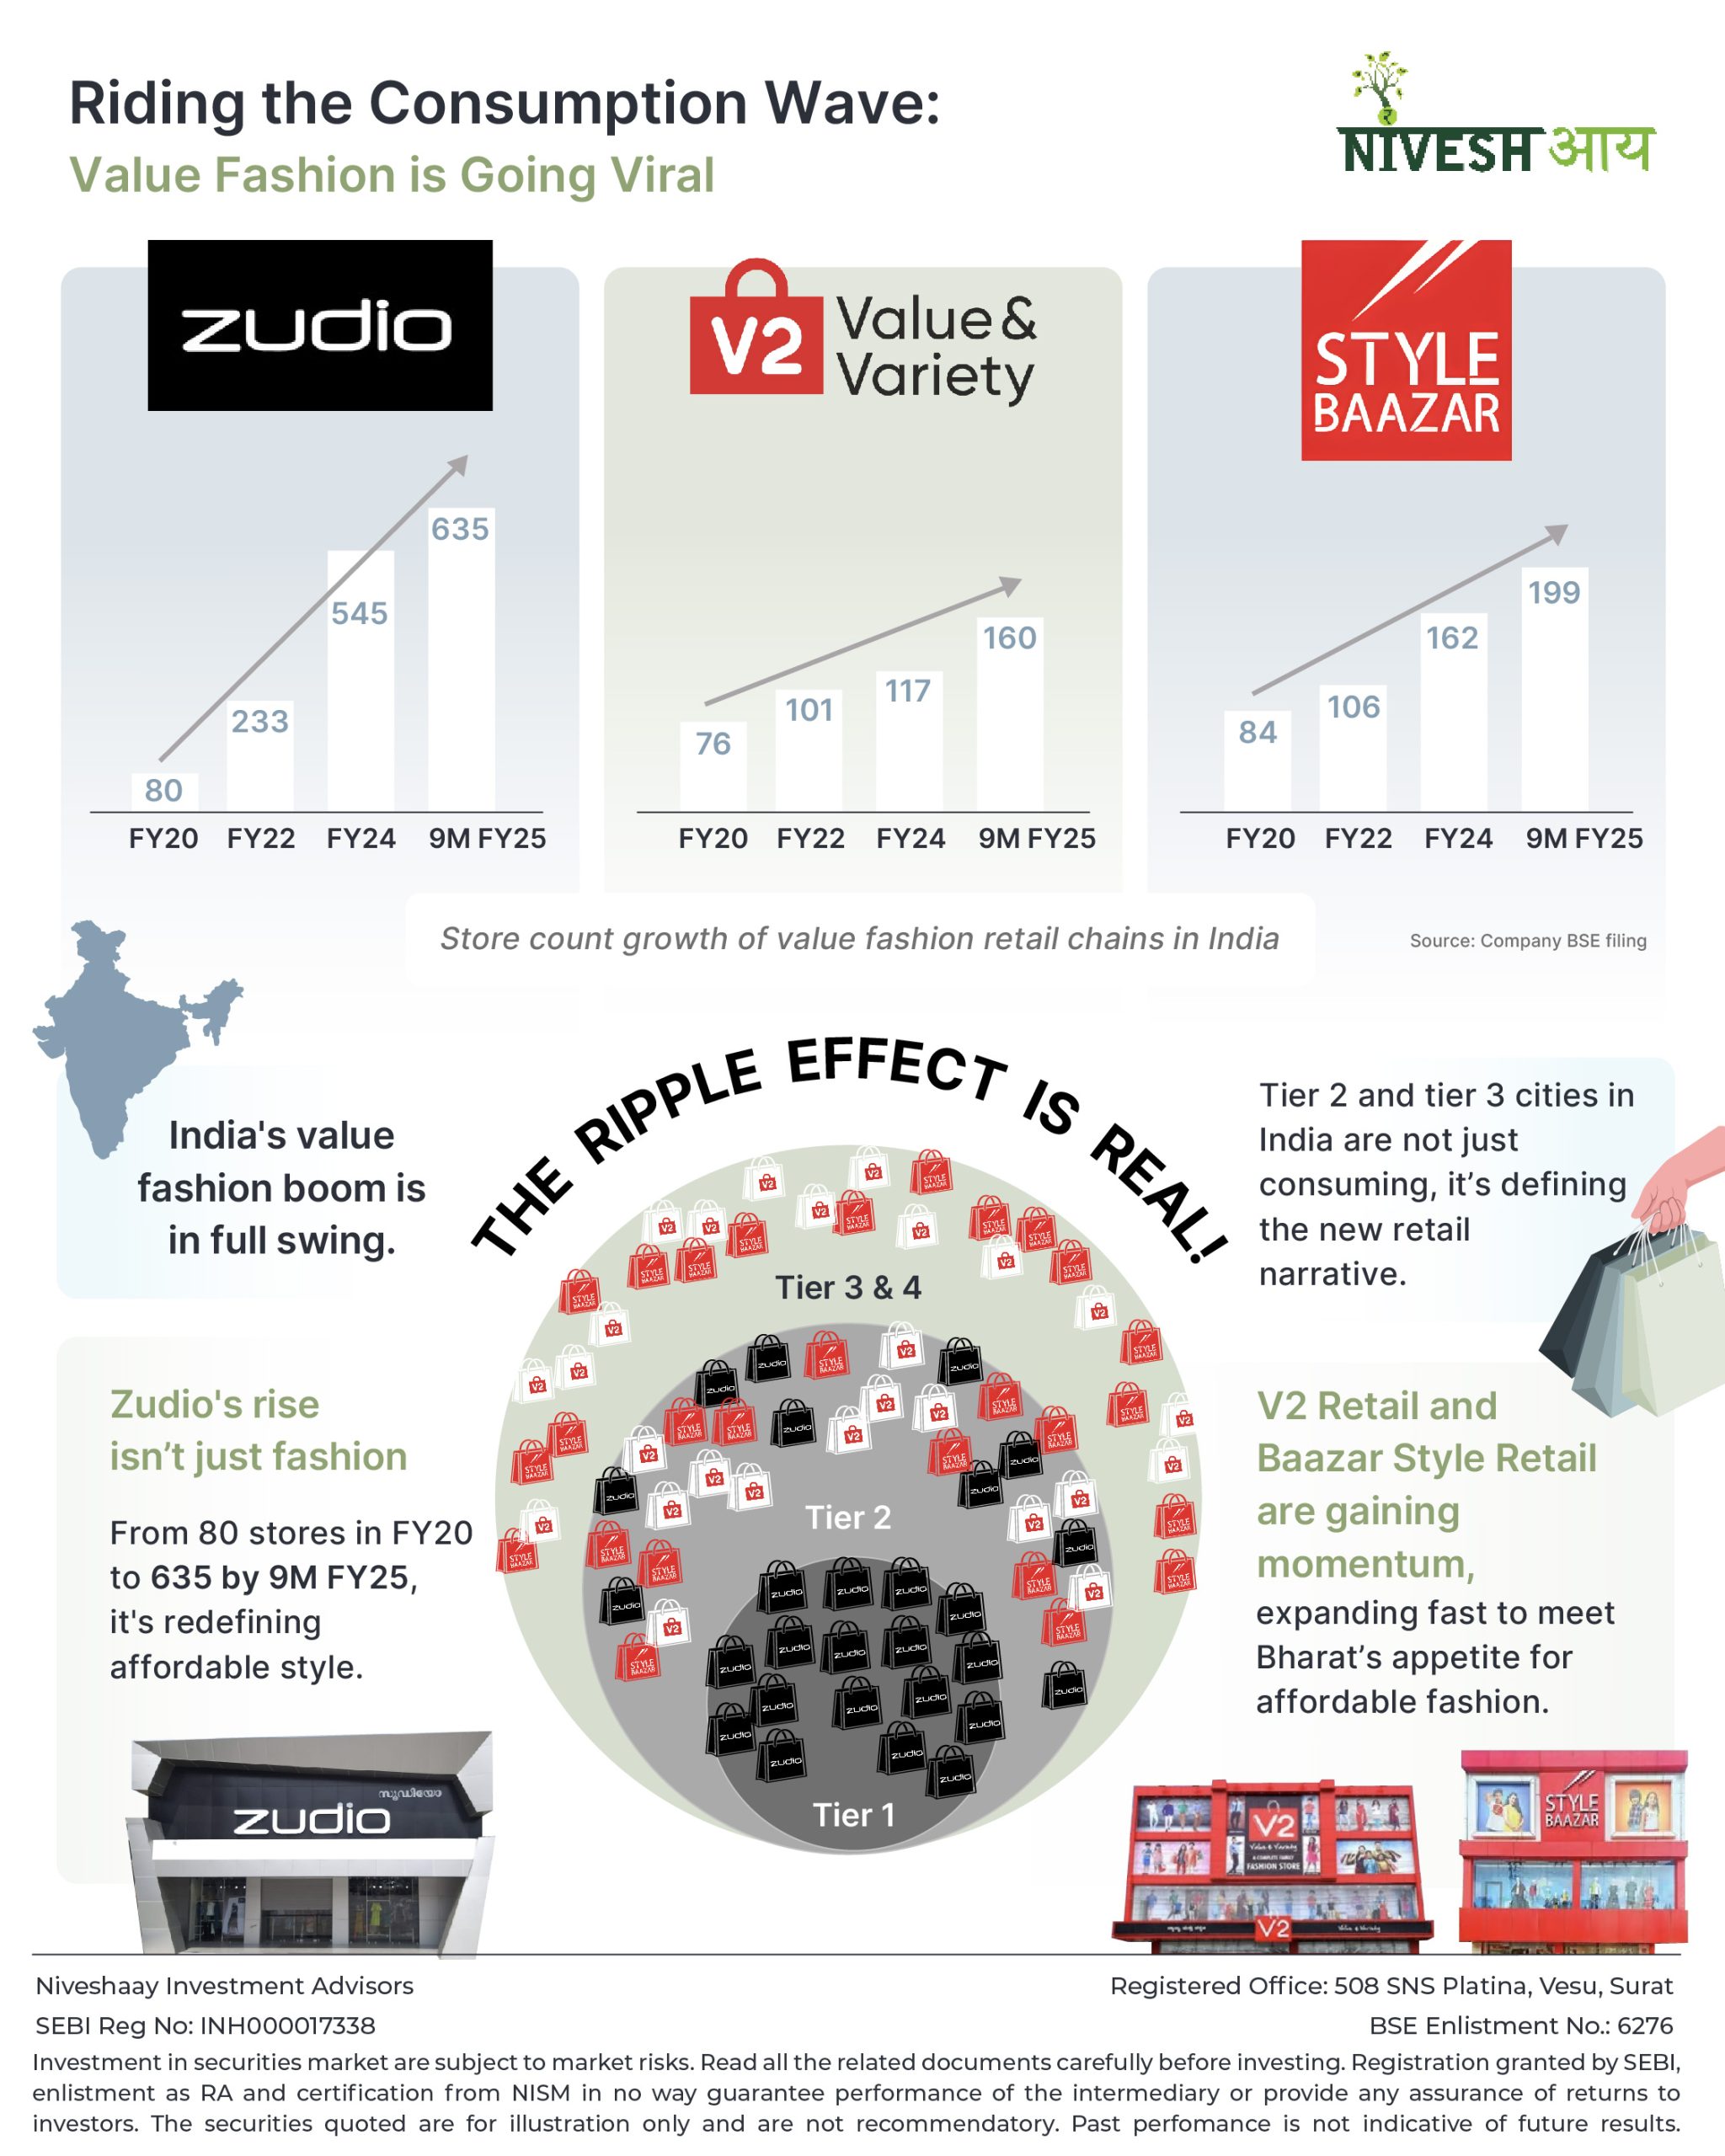
Textiles
Riding the Consumption Wave: Value Fashion is going Viral
India’s fashion map is being redrawn—from metros 🏙 to rising towns 🏘.Brands like Zudio, V2, and Style Bazaar are rapidly expanding their store counts, riding the surging appetite for value fashion across Bharat. 🚀Tier 2 and 3 cities are no longer on the sidelines—they’re steering the market forward. 🧭
India’s fashion map is being redrawn—from metros 🏙 to rising towns 🏘.
Brands like Zudio, V2, and Style Bazaar are rapidly expanding their store counts, riding the surging appetite for value fashion across Bharat. 🚀
Tier 2 and 3 cities are no longer on the sidelines—they’re steering the market forward. 🧭
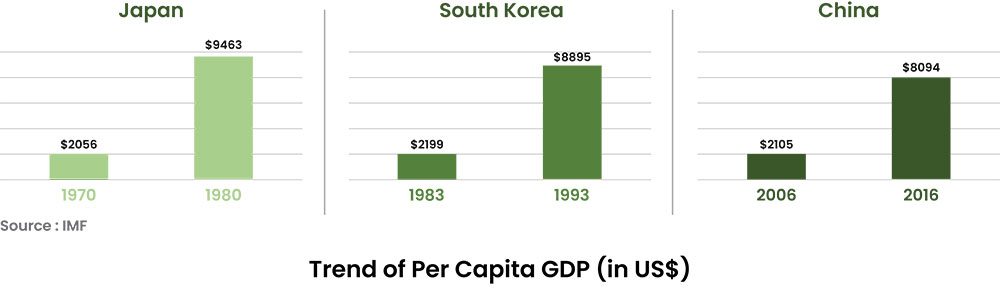
AI & Data Center
Value Fashion in India: A Trendy Ride of Growing Opportunities
India's retail industry is in the midst of an exciting transformation, and if you've been paying attention, you’ve probably noticed the growing shift towards value fashion - affordable yet stylish clothing options that cater to the masses. So, what’s driving this shift? How are brands like Zudio, V2 Retail, and Baazar Style tapping into this
India is stepping into its most exciting consumption era yet. With our per capita GDP now at ~$2,500, we’ve crossed a key economic threshold that historically triggered exponential growth in countries like China, Japan, and South Korea. In each case, once GDP per capita moved beyond $2,000, their economies grew nearly 4x within a decade, driven primarily by consumption-led momentum. India appears to be on a similar trajectory.
But GDP is just one part of the story. The more powerful shift is happening inside Indian households. In 2010, over 75% of households earned less than $5,000/year. Fast forward to 2030, and that number is projected to shrink dramatically to just 18%, while the share of households earning over $10,000 will surge to 45%. This isn’t just a demographic shift—it’s a fundamental change in how India will spend, save, and aspire.
Year wise Households by Income Distribution
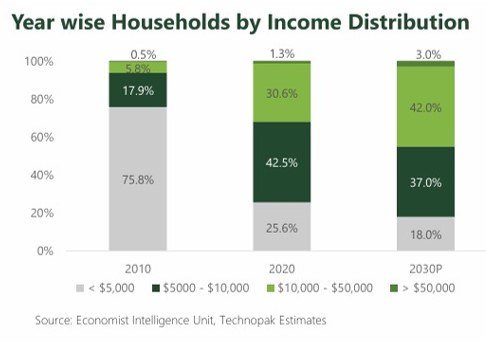
Another strong indicator of India’s consumption readiness is the sharp rise in per capita private consumption expenditure, which has grown from $715 in 2014 to $1,287 in 2021—an impressive 80%+ increase in just seven years. While this figure is still much lower compared to developed economies, it highlights a strong behavioural shift: Indians are now spending more, not just on essentials, but also on lifestyle and aspirational products. This rise becomes even more meaningful when seen alongside improving income levels and better access to credit.
Per Capita Consumption Expenditure (in USD) (FY2023)
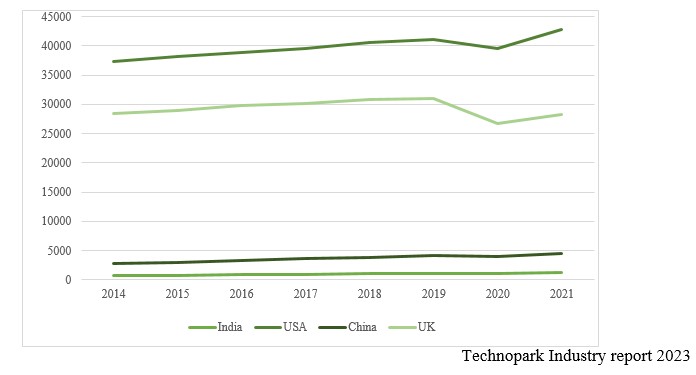
Here’s why value fashion is gaining momentum:
Value fashion is growing quickly—and it makes sense. With more young people starting to earn and spend, the way they shop is changing too. They’re looking for clothes that are trendy, affordable, and easy to find—driving a clear shift towards the organised fashion market.
India’s Age Demographics (FY23)
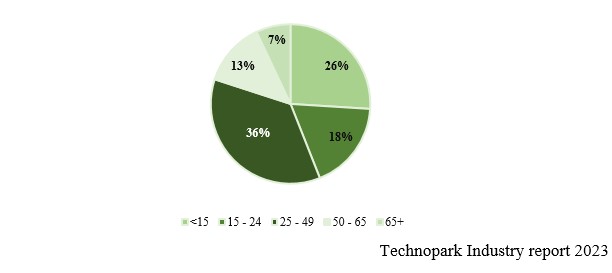
India’s biggest strength is its youthful population—with nearly 80% of people under the age of 50 and a dominant 36% in the 25–49 working-age group, the country is home to one of the largest consumer bases in the world. And it’s not just about age—it’s about behaviour. Today’s Gen Z and millennials are driving a new wave of consumption. Unlike earlier generations who shopped for clothes just 2–3 times a year, this generation shops frequently, influenced by digital trends, social media, and a desire to express identity. But while their fashion needs are frequent, their lens is still rooted in affordability—which is exactly where valu e fashion fits in. It brings together style, aspiration, and accessibility—making it the go-to choice for a generation that wants more, but smarter.
Share of Organised and Unorganised retail as a % of Apparel Market
This shift in mindset is driving a major transformation: from unorganised to organised value fashion. Traditionally, a large part of India’s fashion market was dominated by unorganised players—local shops, roadside stalls, and small retailers. But that’s changing fast. As disposable incomes rise and expectations evolve, people are no longer just buying clothes—they’re looking for a better shopping experience. Organised brands are stepping in to offer that premium feel.
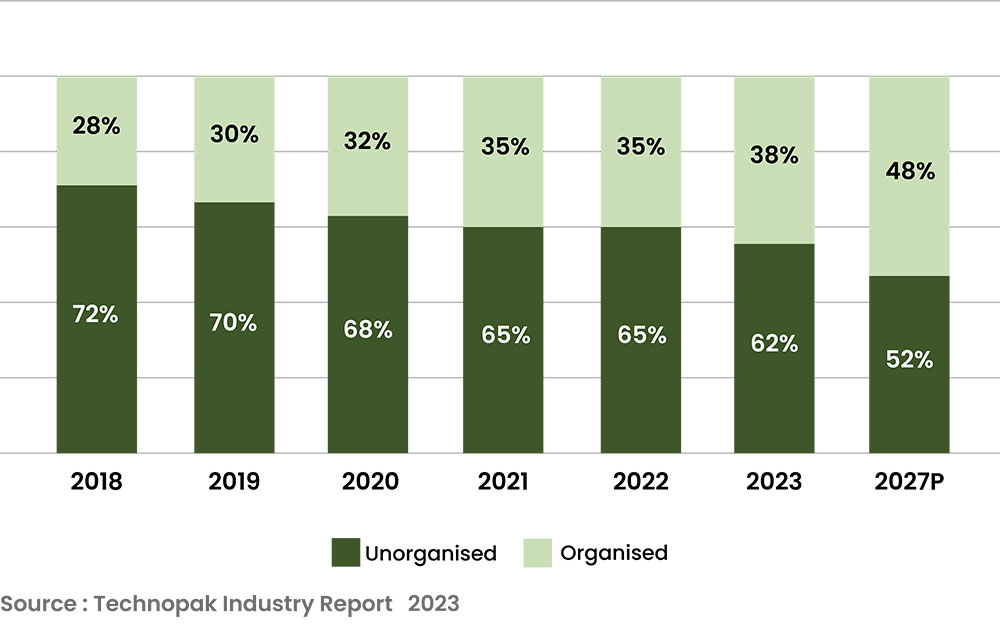
This has given rise to brands like Zudio and V2 Retail, who identified the demand for budget-friendly but trendy options. But how exactly are these brands making it work?
Zudio: Fast Fashion at Scale
Zudio, from the house of Tata, has redefined affordable fashion in India. What started as a metro-focused concept with trendy, budget-friendly clothing in air-conditioned stores with a premium-like feel, has today become the fastest-scaling value fashion brand in the country.
How Zudio played the game:
Zudio cracked the retail code by blending fast fashion principles—quick refreshes, in-trend designs, and mass availability—with price points accessible to India’s middle class. Its key strength lies in getting the right styles at the right time, thanks to a tight supply chain and consumer feedback loop. Instead of competing on variety, it focuses on simplicity, freshness, and impulse-friendly pricing.
Zudio started with Tier 1 cities but is now aggressively entering Tier 2 towns, riding the familiar pattern that what works in metros eventually gets embraced in smaller cities. And with India’s younger generation shopping more frequently and affordably, Zudio’s model fits perfectly.
What’s next:
Zudio is building a moat through speed and scale. It’s strengthening backend supply chains and adding private label dominance, which not only drives margin but also ensures brand stickiness. The goal is clear: be India’s go-to brand for impulse fashion across every city.
V2 Retail: From Struggler to Challenger
V2 Retail, a rebranded version of the old Vishal Retail, is a story of turnaround. While once bogged down by Debt issues, it has found fresh momentum in Tier II to Tier IV towns, focusing on aspirational, affordable fashion for middle-income households.
How V2 is playing it smart:
With an ASP of just ₹280, V2 directly targets the mass market. It’s not trying to imitate metro formats but instead has optimized layouts for maximum density—vertical shelving, limited SKUs per category, and high turnover of inventory. Around 35% of its merchandise is in-house, giving it price control and differentiation. This is expected to scale to 80%.
V2 is targeting to open 100 new stores in this financial year, signalling strong intent to scale aggressively. Backed by a lean balance sheet and internal accrual-led expansion, the company has also given a strong revenue growth guidance, supported by rising private label mix, better store productivity, and deepening presence in underpenetrated Tier II–IV markets—particularly in East and North India.
Baazar Style Retail: The Eastern Powerhouse
Baazar Style Retail (STYLEBAA) has carved out its niche by building dominance in Eastern India’s Tier II and III cities, especially in West Bengal, Odisha, Jharkhand, and Bihar. It caters to the neo-middle class—a segment that seeks branded experience without premium pricing.
Unlike its peers, Baazar Style goes deeper rather than wider. It follows a cluster-based expansion strategy, which helps lower logistics costs and improve brand visibility within regions. Its stores—averaging ~9,000 sq. ft.—are large enough to offer choice but still compact for smaller cities.
STYLE BAAZAR plans to open 40–50 stores every year, supported by internal accruals, without taking on major debt. The management is focusing on tech (SAP-led inventory control), regional demand analytics, and expanding into Tier IV towns, where over 5,000 markets are still largely unorganised.
V-Mart: The Trusted Brand of Bharat
V-Mart is the original poster child of value fashion in small-town India. With deep roots in Tier II and Tier III cities, V-Mart built its brand on reliability, assortment, and affordability. Post-COVID challenges slowed it down, but the company is once again gaining momentum through sharper execution and better product mix.
V-Mart’s revival play:
V-Mart is working on consolidating vendors, improving sourcing margins, and expanding into high-velocity categories like footwear, beauty, and accessories. It’s also focusing on optimising costs, especially rentals and backend operations. Its “Unlimited” format and the integration of Lime road are also part of its omni-channel ambitions.
The focus is on improving store throughput, expanding into high-margin segments, and creating a full-stack retail platform (offline + online). V-Mart’s strength lies in its strong brand trust and understanding of non-metro consumer preferences, which gives it an edge in a cluttered space.
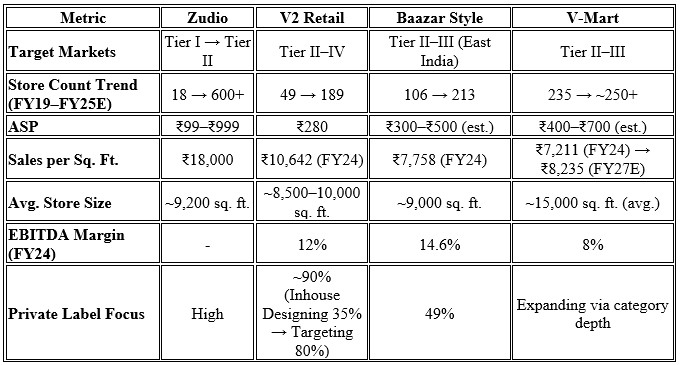
India’s consumption story is no longer a theory—it’s unfolding in real time. With rising incomes, shifting income brackets, growing per capita expenditure, and a young population that shops more frequently and aspires for more, the stage is perfectly set. And value fashion, with its mix of affordability, trendiness, and improving retail experience, stands to gain the most. It’s not just regional specialists driving this wave—even retail powerhouses are stepping in. Reliance has launched Yousta, Aditya Birla is betting on Style Up, and Shoppers Stop is rolling out Intune—all aiming to capture this fast-growing market.
Electronic Manufacturing Services
Niveshaay’s Approach in the Valuation Reset Market Mood
Whenever there is a correction in the market, the first question that comes to our mind is, “Is it a good time to stay invested or is it better to pull out of the market?” We tend to make analogies from past market corrections and study the macro factors causing corrections. Isn't it? Let us
Whenever there is a correction in the market, the first question that comes to our mind is, “Is it a good time to stay invested or is it better to pull out of the market?”
We tend to make analogies from past market corrections and study the macro factors causing corrections. Isn't it? Let us put things in perspective. The tightening of monetary policy by FED and now by RBI, inflationary environment due to the Russia-Ukraine conflict and COVID-19 led supply chain disruptions have created the current market environment volatile. We don't know whether there would be more downfall or not, but what we at Niveshaay think is that, few factors have become quite favourable for the country to find a pivotal place in the global value chain. The current environment doesn’t augur well for businesses that require a consistent supply of capital to grow. Is it a good time to invest?
In the Indian context, corporates now have healthy balance sheets. It seems like, the focus of a lot of companies is to have a balance sheet characterised by low leverage. Labour demographics, cost of manufacturing is steadily becoming competitive and we’re a huge market. The most often used phrase after COVID-19 ‘China plus one’ looks structural and persistent providing tailwinds to the manufacturing sector. The export of engineered goods, steel, textiles and building materials to name a few have increased tremendously after the pandemic and from the pre-covid levels too. Acceptance of any product increases when one gets an opportunity to try and experience new products. India just got that and few companies totally grabbed these favourable opportunities to provide to international as well as domestic clients. With government focus on manufacturing and exports, reviving the capex cycle and taking measures to attract private capex are just some of the needed pre-requisites for growth.
Japan became the second largest economy globally in 1970-1980s, led by a strong central government, rapidly growing manufacturing sector and protective and supportive trade policies. In early 2000’s China was the net importer of metals and of many other products. Slowly, with supportive government policies and manufacturing cost advantages, China built out a massive network of factories dominating the global trade surpassing Japan to become the second largest economy. With COVID-19 led supply chain disruptions, emerging countries like India are getting opportunities in the export markets. India has twin benefits- we’re a huge market plus the ability to export competitively in few sectors.
Our approach in the current market mood is to focus on cash flow generating companies, reasonable valuations and healthy balance sheet.
Secondly, investment decisions shouldn't be made in stocks that look cheap on the basis of hope that things will turnaround in 1-2 years. Hope is never a strategy and such companies generally are de-rated in markets which is brutal as we’re seeing in the current ones. We truly believe that current times are such where one should invest where there is a visibility and predictability of earnings.
Lastly, not to over-allocate to correlating sectors, follow the basket approach wherever required and keep a high margin of safety.
Themes, which we believe are expected to perform well include:
Capital Goods / Metal Ancillaries:Revival in capex cycle, Import Substitution at play -
Indian engineering components exports grew by 37% when compared to 2019 and grew to $ 111 billion in 2022, a rise of 50% from 2021 levels. The major thrust of government during the last two years has been to revive the capital expenditure cycle. The rise in capital expenditure helps to crowd in private investments. The virtuous cycle of investments begins in the economy. With higher steel and energy prices globally and supply chain disruptions, India can reap benefits from the government support through PLI schemes and import substitution policies additionally with export markets. Insights from visiting various exhibitions, interaction with varied entrepreneurs and management conference call discussions also highlight how imports of raw materials have reduced and domestic sourcing has increased wherever possible. Also, capital goods companies are showing healthy order-book at a time when government policy of export duty on steel translating to reduction in steel prices in home market would help these steel consuming companies in a significant way. Overall, till date, the earning season has been fantastic where few companies have shown good sales growth, maintained or improved margins. Some companies did show margin pressure too. The focus should be on companies that exhibit pricing power. This is also the time when global companies in the developed economies are incurring margin pressure. We truly believe that Indian manufacturing will be the best quality asset to own across the globe as an asset class.
Textiles:Government focus, supply side consolidation and China+1 at play -
Currently, play on apparel segment in the textile value chain looks good. India’s annual textile exports can rise to $100 bn in the next five years from the current USD 40 bn as per Ministry of Textiles. Garmenting requires low investments when compared to setting up spinning, fabrics and processing units.
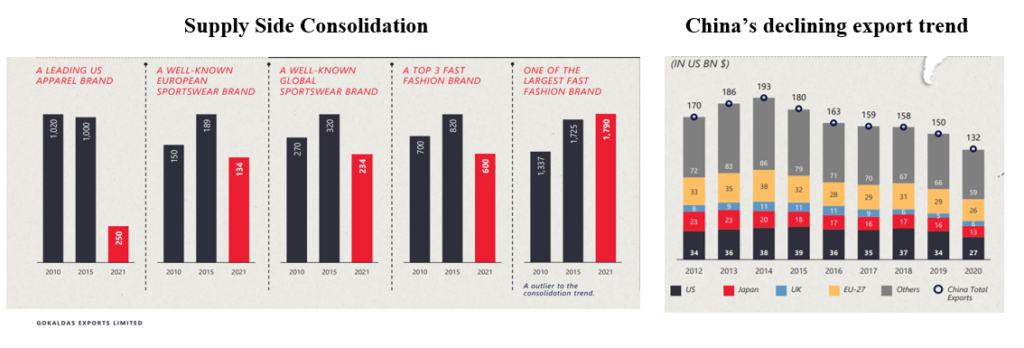
Renewable Energy: Good for the Planet and a Great Business to Invest in -
This sector has been our focus area since a long time now. Transition to clean energy is certainly the buzzword in the global economy. Why has it suddenly become so important than ever?
Well, COVID-19 accelerated the clean energy adoption trend and also made us realise that the shift to green energy is fuelled by necessity. In addition, the Russia – Ukraine war also highlighted a quick shift to renewables is important. The use of renewables in place of coal will save India Rs. 54,000 cr. ($8.43 bn.) annually by 2040. Renewable energy will account for 55% of the total installed power capacity by 2030. Countries like India and Europe, which are fuel dependent on other nations, did realise the need to fill in the gaps after the energy supply disruptions for greater security after the pandemic and the war period. Hence, definitely, it’s a long-term and integral play for any economy to achieve sustainable growth.
Building Material Industry:Product gaining market share and the industry is expected to grow at a CAGR of 15-20% in next 3-4 years -
Here, the play is on MDF industry where the product is a substitute for plywood and doesn’t have any threat from imports. Being, 80% cheaper compared to plywood, the industry is gaining huge traction due to the increase in housing demand, growth of online home décor platforms and reduction in furniture cycle time.
Staying invested amidst these short-term hiccups will make a huge difference in the long term. Meanwhile, we’ll continue to stick to our process and give our one hundred percent always.
Happy Investing!
Disclaimers and Disclosures
SEBI Registration No. :INH000017338, IN/AIF3/24-25/1571, IN/AIF2/24-25/1607 | BASL Membership ID: 6276
Investment in Securities Market are subject to market risks. Read all related documents carefully before investing. The securities quoted are for illustration only and are not recommendatory. Registration granted by SEBI, membership of a SEBI recognized supervisory body (if any) and certification from NISM in no way guarantee performance of the intermediary or provide any assurance of returns to investors.

Textiles
India’s Consumer Boom Unveiled
The first two decades of this century were China’s, then this decade and beyond will be India’s. The consumption story in India is just unfolding. - Sanjiv Mehta, Former CEO and MD, HUL India, boasting a population of 1.4 billion, has recently surpassed China to become the world's most populous country. Beyond economic indicators, India's demographic
The first two decades of this century were China’s, then this decade and beyond will be India’s. The consumption story in India is just unfolding.- Sanjiv Mehta, Former CEO and MD, HUL
India, boasting a population of 1.4 billion, has recently surpassed China to become the world's most populous country. Beyond economic indicators, India's demographic profile, characterised by a sizable youth population and an expanding middle class, underscores the nation's growing consumer potential.
Headlines announcing India's remarkable GDP growth of 7.6% have captured widespread attention, showcasing the country's growing manufacturing prowess. Increased investment in India's manufacturing sector is anticipated to have a ripple down effect, spurring consumption.
The surge in retail lending activity provides tangible evidence of increasing consumer demand. India's credit boom has fuelled a resurgence in sectors such as luxury real estate, automotive industries, and high-end consumer goods, reflecting a robust appetite for discretionary spending.

Economists forecast that when per capita GDP exceeds $2,000, a notable transformation occurs where countries observe a consistent trend of increased consumption, particularly discretionary spending. A similar trend was observed in the United States in the 1950s/60s, Japan in the 1970s, South Korea in the 1980s, and China in the 2000s.
Guess what? India has crossed the crucial inflexion point where per capita GDP has exceeded $2500. This is the stage where consumption skyrockets and moves from spending on needs to indulging in wants. Moreover, the trend towards premiumization spurs an increase in demand for luxury and high-end products. According to Bain & Co., the luxury market in India could burgeon to $200 billion by 2030, marking a threefold increase from its current size.
Forecasts from S&P Global Market Intelligence indicate that India's GDP could soar to an impressive $7.3 trillion by 2030. Such growth prospects are underpinned by escalating manufacturing activity, which is expected to translate into heightened consumer spending and stimulate economic growth.

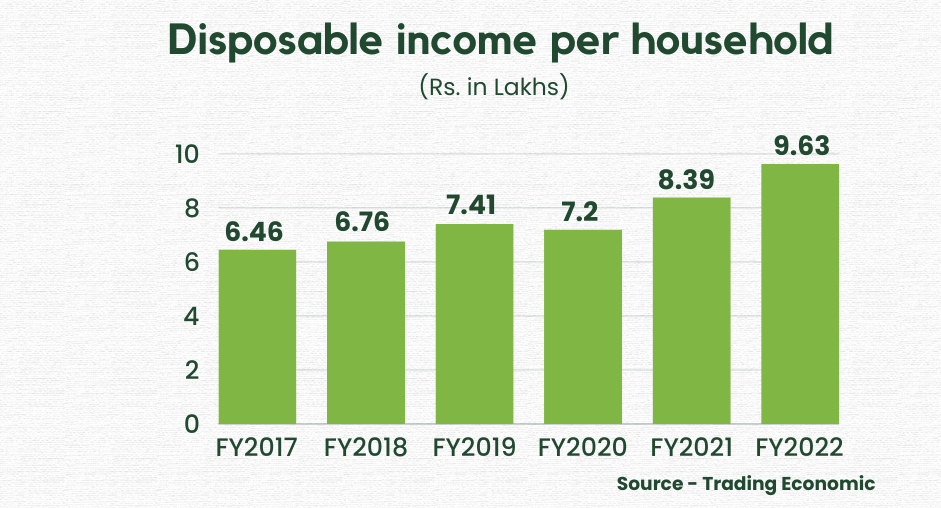

This demographic dividend, combined with rising aspirations for an elevated lifestyle, drives demand across various sectors. Some of the interesting sectors that can benefit from this trend are:
Wealth Management Industry:

Savings remain at the heart of every Indian. The rising per capita income will robustly drive India’s consumption story, but not at the cost of investments. Overall, the rising per capita income will simultaneously promote a culture of responsible investment. This dual momentum is harnessed by the wealth management sector to help individuals maximize the potential of their savings and navigate the complexities of wealth accumulation in an evolving economic landscape. With the rising number of demat accounts and high-net-worth-individuals (HNIs) in India, the wealth management industry is poised for inevitable growth. As individuals accumulate wealth, there is a growing need for professional management of their assets.
Luxury Segment:
One of the segments that can benefit from this ongoing premiumization trend is the luxury segment. Indians are embracing premium products and luxury fashion, creating significant growth opportunities for the luxury segment in India.
Luxury watches have always been a statement of elegance, status, and timeless style. The majority of luxury watches are Swiss watches. There has been a remarkable growth in the consumption of Swiss watches in India, reflecting an increasing preference for high-end watches among Indian consumers. The recently signed India-Europe free trade agreement will further boost the demand for Swiss watches as customs duties on imports will be removed over a period of 7 years.


Another segment benefiting from India's economic growth is the luxury car segment, which has achieved its best-ever sales in the recently concluded financial year 2023-24. Carmakers attribute the increase in sales to a lifestyle shift post-Covid-19, with younger professionals opting for high-end cars. The booming market reflects an increasing appetite among Indian consumers for luxury and exclusivity. Also, considering the under penetration of luxury cars in India, where luxury car sales represent only 1% of total car sales, compared to higher percentages in countries like Japan (5%), Europe (18%), and China (17%), it's evident that India's luxury market holds immense potential for growth.
Hospitality sector

India’s hotel industry surged back to life, driven by a post-covid uptick in travel. Double-digit revenue growth was propelled by domestic leisure trips, meetings, incentives, conferences, and exhibition (MICE) events, the G20 Summit, and the return of business travellers. The added excitement of the ICC Cricket World Cup saw hotels fill up, and unorganized accommodations were abuzz.
Currently, India's share in the total global MICE tourism (meetings, incentives, conferences, and exhibitions) is less than 1%, valued at USD 876.42 billion in 2022. This global market is projected to grow at a CAGR of 7.5% from 2023 to 2030. In India, it is expected to reach 2% within the next five years.
India is the fastest-growing aviation market in the world, with a projected growth in air trips of 7-8% between 2023 and 2030. To match the growing demand, Indian airlines have placed record orders for over 1,500 aircraft (discussed in the aviation blog).
All these indicators point to India emerging as a focal point for significant investment opportunities. The infusion of nearly $12.2 billion by foreign fund managers in the first half of 2023 alone underscores the growing interest in India's economy. With private consumption contributing a substantial 60% to India's GDP, it is clear that the nation's consumer market is on track to become the world's third-largest by 2027.
Moreover, India's trajectory suggests that it will evolve into a $5 trillion consumption economy by 2031, with the middle class expected to drive 53% of incremental consumption. This underscores the enduring appeal of India's consumption story, making it one of the most compelling long-term investment opportunities.
Disclaimers and Disclosures
SEBI Registration No. :INH000017338, IN/AIF3/24-25/1571, IN/AIF2/24-25/1607 | BASL Membership ID: 6276
Investment in Securities Market are subject to market risks. Read all related documents carefully before investing. The securities quoted are for illustration only and are not recommendatory. Registration granted by SEBI, membership of a SEBI recognized supervisory body (if any) and certification from NISM in no way guarantee performance of the intermediary or provide any assurance of returns to investors.

Power & Renewable Energy
Niveshaay Annual Letter 2024
It's that time of the year when we put our thoughts to perspective, reflect on our past successes and what didn’t work for us, evaluate areas for improvement, and convene with our team to set goals and agendas for the upcoming year. First and foremost, we’re pleased that we've concluded this eventful year on a
It's that time of the year when we put our thoughts to perspective, reflect on our past successes and what didn’t work for us, evaluate areas for improvement, and convene with our team to set goals and agendas for the upcoming year. First and foremost, we’re pleased that we've concluded this eventful year on a positive note, with favorable returns attributed to our continued investment in previously identified opportunities over the past few years, as well as discovering new prospects within the sectors where we've already invested, and perhaps a bit of good luck as well. Our investments in high-growth sectors like Energy Transition, Capital Goods, and Manufacturing, particularly in the early stages, turned out to be advantageous this year.
The Indian equity markets sustained their upward trend, surpassing many global counterparts, largely due to favourable government policies reigniting investment activity. Our decision to invest a lump sum during the February-March-23 volatility proved beneficial, contributing to generating slightly higher returns throughout the year. Additionally, we've gleaned some important lessons this year. Firstly, the value of time spent in the market and prior thorough research in specific sectors greatly facilitates swift decision-making. Moreover, we've realized that valuation alone cannot serve as the sole criterion when considering investments in companies or businesses. The predictability of earnings growth, the competitive landscape, and the sustainability of business trends or tailwinds are equally critical factors that were also taken into account when we were making an investment decision.
At the outset, we launched our flagship smallcase, ‘Mid and Small Cap,’ which comprises a diversified portfolio that allocates across major sectors. Analysing, the tailwinds and expected accelerated adoption in the renewable sector, we launched the ‘Green Energy’ portfolio in 2021. The sector has garnered a lot of attention due to the government’s commitment to sustainability. It’s now when we realise, our portfolios were rightly placed in the journey to take advantage of the potential growth. Further, we believed that the supply chain re-arrangement post the pandemic coupled with government-led favorable policies aimed at reigniting the investment cycle in the country, promoting import substitution, and intensifying focus on exports, would contribute to the growth of Indian manufacturing.
This conviction prompted us to introduce the 'China Plus One' smallcase. When these initiatives started to translate in numbers, we believed that the higher investment in India's manufacturing sector is expected to have a ripple effect by boosting consumption. Government policies have created significant growth opportunities, resulting in per capita GDP surpassing $2000. Historically, countries like China, Japan, and South Korea experienced a surge in consumption spending upon reaching this income level. In the last few years, a rise in consumption has been observed due to increasing disposable income and changing habits. We believe it’s the beginning of a new consumption story in India where premiumization will take a substantial share. With these thoughts in mind, we launched another portfolio, ‘Consumer Trends’ during Diwali, focused on discretionary consumption and premiumization. Lastly, our ‘Trends Trilogy’ smallcase is all about playing the three trends: Business, Financial and Technical Trends in a concentrated manner.
Commencing with the power sector, which is witnessing significant global investments, primarily due to the swift transition towards renewable energy sources. This surge in power generation prompts the growth of transmission and distribution companies. We integrated this theme into our portfolio by allocating investments in Transformers & Rectifiers (India), a prominent power transformer manufacturer and Skipper, the largest power transmission tower manufacturer in India. The ambitious target of achieving approximately 500 GW in renewable energy capacity by FY30, up from 179 GW in FY24, is anticipated to attract significant investments across the entire sector, encompassing generation, transmission, and distribution.
Supported by favourable policies and consistent government backing, India’s manufacturing and infrastructure real estate sector is witnessing a sectoral tailwind. We took exposure in this sector through Action Construction Equipment (ACE), dominating crane manufacturing with over 65% market share, and Sanghvi Movers, India's largest crane rental company.
The 'China Plus One' strategy and the trend of supply re-arrangement present promising opportunities for India's textile industry, a sentiment reaffirmed at the Bharat Tex expo. We maintain our optimism regarding this theme, and our early recognition of this sector and analysis of the value chain have enabled us to benefit either by investing in highly efficient garmenting companies or in growing home textile companies.
India has also undertaken similar government policies, such as supporting end-user industries through export tariffs and stimulating domestic demand via import substitution policies aimed at promoting indigenisation. For instance, these policies have strengthened India's defence ecosystem, contributing to the nation's self-reliance and economic growth. Defence exports increased from Rs. 10,746 crores in FY19 to Rs. 21,083 crores in FY24, and the target is to reach Rs. 35,000 crores by FY25. The import substitution in industries like the electronics manufacturing and food equipment industries has resulted in Indian companies being preferred over imported ones due to cost savings, reduced lead time, and good quality. According to Bloomberg, India’s electronics exports to the USA as a ratio of China’s increased from 2.51% in November 2021 to 7.65% in November 2023. In the UK, the share rose from 4.79% to 10% during the same period. From exporting zero mobile phones in 2014 to now becoming the 2nd largest exporter globally, electronic exports increased from $8.4 billion in FY19 to $23.6 billion in FY23.
Samsung and Foxconn, the manufacturer of Apple's iPhone, are leading the charge in relocating their manufacturing operations to India. Supportive government policies incentivizing local production, combined with favourable production factors, are positioning India as an appealing destination for multinational corporations (MNCs) aiming to establish manufacturing facilities. Recently, Tesla has also signalled its intent to establish a manufacturing unit in India. This trend not only enhances the global competitiveness of MNCs but also encourages other companies to establish plants in India while fostering the growth of the component ecosystem and promoting increased domestic sourcing within the country.
As we observe manufacturing sector thriving, it naturally elevates the per capita income, consequently fuelling an increase in discretionary spending. This trend is expected to significantly boost consumer spending in India. Within the consumer discretionary space, the premiumization trend is gaining momentum. India can rely on its own domestic demand to firepower its growth, specifically, private consumption (accounts 60% of its GDP) and investment spending. Staying invested in the theme can yield good results in the long term.
As much as our thesis played out, certain companies, such as Hindware Home Innovation Ltd. even booked losses due to underperformance relative to our expectations. Initially, we viewed it as a promising undervalued brand play on real estate, but subsequently exited when the numbers didn’t comply with our investment thesis due to delayed or subdued consumption in the affordable segment. In China Plus One and Trends Trilogy Smallcase, we believed IFGL refractories to be a good ancillary play on the rapidly growing Steel industry but booked losses as the performance of the company was not on par with our expectations, largely attributed to ongoing geopolitical issues in Europe. These challenges impacted the company’s sales volume, which we expect to persist in the upcoming quarters.
We have received tremendous support throughout, and our Smallcase family has now grown to 25,000+ active subscribers. We hosted regular Webinars and conducted Ask Me Anything (AMA) sessions to share valuable insights and opportunities to stay informed about the ever-evolving financial landscape. To engage more personally with our subscribers, we organized meet-and-greet gatherings in Mumbai and Bangalore, allowing us to connect with our audience. We're excited to continue hosting similar events and look forward to visiting more cities in the future!
This year, we closed favourable deals in the private equity market, driven by our philosophy of having ‘skin in the game’ and investing in sectors exhibiting bullish trends. In the private sector, we look for opportunities where companies need growth capital and where IPOs are expected to come in the range of 6 months – 4 years. For instance, to name some:
We came across Waaree Energies Ltd. while exploring opportunities in the renewable sector. With a current capacity of 11 GW, it is India’s largest solar PV module manufacturing company. Considering it had only 2GW capacity in 2021, it has exponentially increased its capacity because of rising demand and a healthy order book. It has turned out to be an outperformer, with its valuation now more than triple since our investment in the second fund raise round. The company is now vertically integrating into cell manufacturing, which will further expand operating margins. A very good company to analyse the execution capabilities of any entrepreneur translating into tangible numerical results.
Similarly, we’ll continue to actively pursue investment opportunities in private markets, particularly in sectors such as manufacturing, power, renewables, and others.
While these sectors are experiencing huge tailwinds, and analysis of end-user industries' capital expenditure plans reveals numerous promising opportunities across various sectors. But, the dilemma here these days is between the rich valuations and high expected earnings growth. Staying invested in the already identified stocks can turn out to be a good decision or invest in companies where earnings predictability is high and available at reasonable valuations.
We sincerely thank you for entrusting us with your wealth creation journey. Your confidence in us, particularly during volatile periods with a high churn in the portfolio is valued greatly. We remain committed to delivering exceptional service, as always.
Happy Investing!


Disclosure: https://niveshaay.com/disclosure
Disclaimers and Disclosures
SEBI Registration No. :INH000017338, IN/AIF3/24-25/1571, IN/AIF2/24-25/1607 | BASL Membership ID: 6276
Investment in Securities Market are subject to market risks. Read all related documents carefully before investing. The securities quoted are for illustration only and are not recommendatory. Registration granted by SEBI, membership of a SEBI recognized supervisory body (if any) and certification from NISM in no way guarantee performance of the intermediary or provide any assurance of returns to investors.
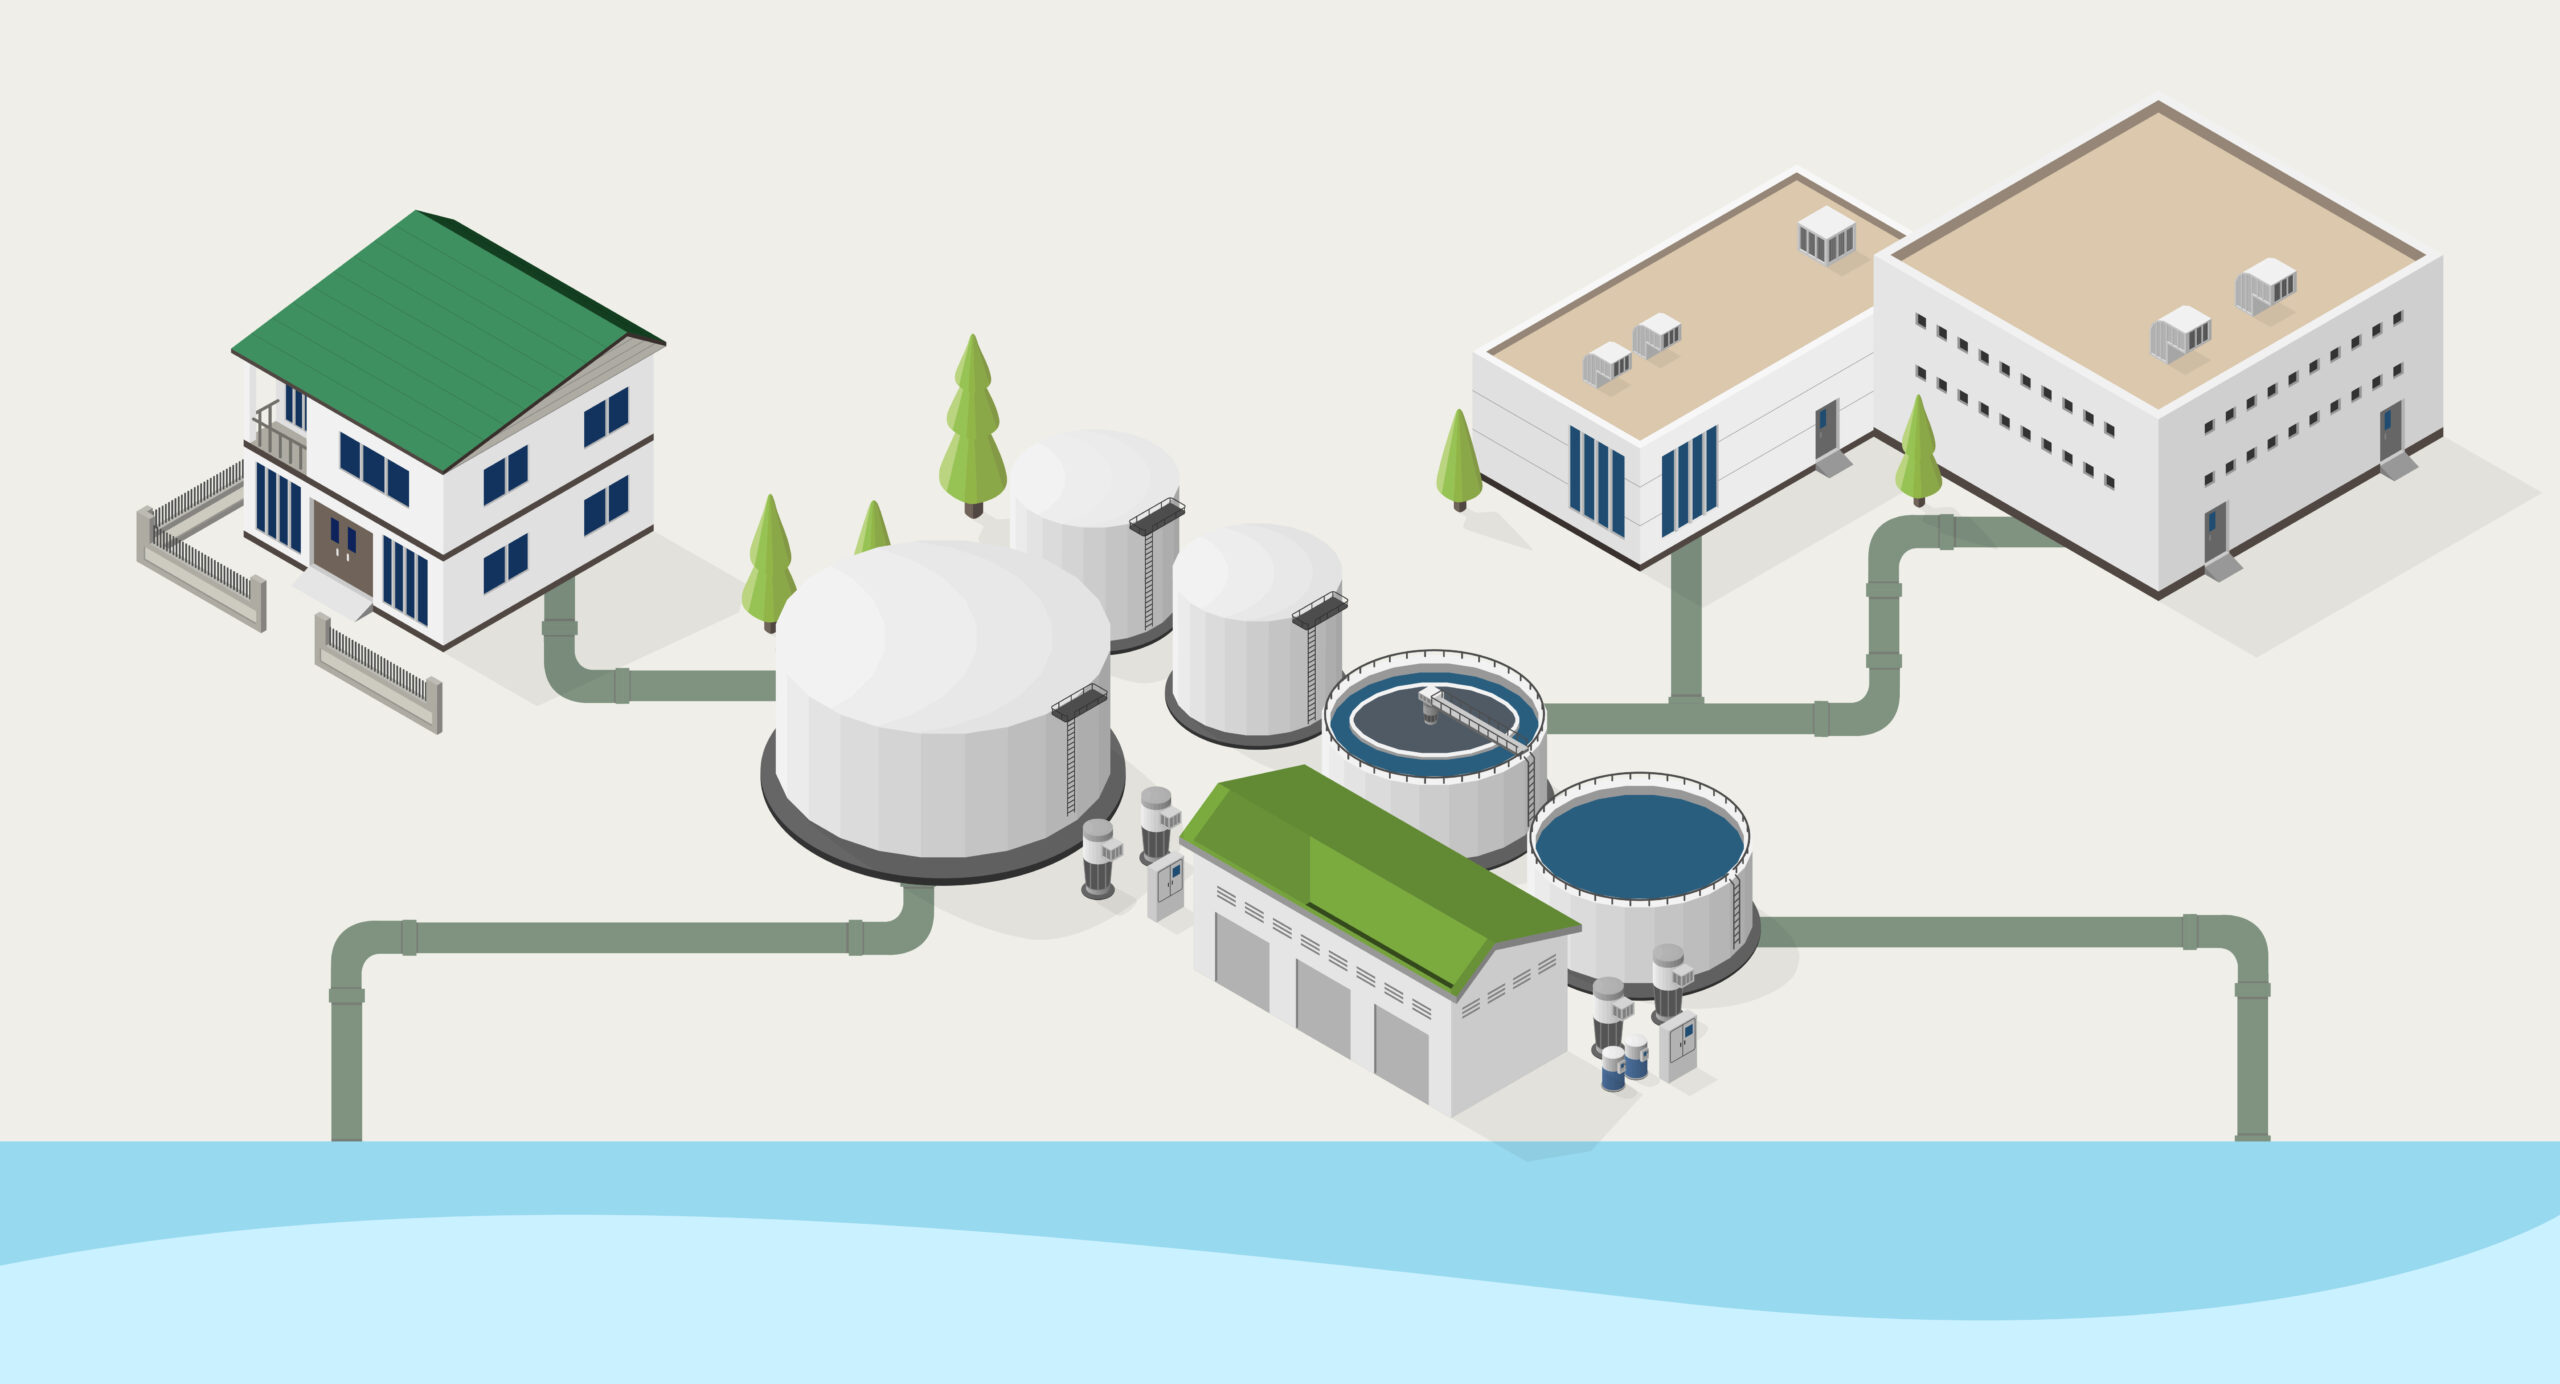
Electronic Manufacturing Services
Is Water and Wastewater Industry at an Inflection?
“Water is life's matter and matrix, mother and medium. There is no life without water.” India is home to a whopping 18% of the world’s population, but it only has about 4% of the world's resources. With cities growing and industries booming, the country's water demand is set to skyrocket from around 1040 BCM (billion
“Water is life's matter and matrix, mother and medium. There is no life without water.”
India is home to a whopping 18% of the world’s population, but it only has about 4% of the world's resources. With cities growing and industries booming, the country's water demand is set to skyrocket from around 1040 BCM (billion cubic meters) now to about 1447 BCM by 2050. This surge in demand is made worse by problems like groundwater depletion, climate change, and poor water reuse and recycling practices. To make sure everyone has access to clean and safe water, it's vital to invest in water and wastewater infrastructure. This will help us make the most of our water resources and tackle the looming supply challenges.
Basic understanding of the value chain

Here's a quick rundown of how the water/wastewater treatment industry operates:
Consultants – The Planners: First up are the consultancy firms. These companies kick things off by analyzing the area where a Sewage Treatment Plant (STP) or Water Treatment Plant (WTP) will be built. They look at the local population, how much sewage is generated, and other key factors to figure out the plant's required capacity and other necessary things. They then draft up layouts that show the plant’s capacity, location, treatment technology, and a survey of the pipeline network.
EPC Companies - The Builders: Next in line are the Engineering, Procurement, and Construction (EPC) companies. They take the consultants’ plans and start building the WTP or STP, along with the necessary pipelines. They handle everything from getting materials to actual construction. Some EPC companies stick to engineering and procurement and hire others for the construction part. On bigger projects, even those that do handle construction might subcontract parts of the job. These companies usually also manage the operation and maintenance of the plants once they're up and running.
Component/Equipment Manufacturers - The Suppliers Then there are the component manufacturers. These companies supply crucial parts like membranes, bar screens, sludge digesters, pumps, and various filtration equipment. Some of these manufacturers also dabble in EPC activities, adding another layer to their business.
The Indian Water and Wastewater Industry Market size

Source: Frost and Suillvan, Niveshaay Research.
Do note, for the estimation of the market size of the industry we have only considered the EPC of the plants and the equipment. EPC for Pumping system and pipe laying works haven’t been included in this, which itself is a big opportunity under water.
Why water and wastewater Industry India
1. Repercussions of not treating wastewater are high
Ever wondered what would happen if we just let wastewater be? Spoiler alert: it's disastrous. Here’s a quick look at the major fallout of not treating our wastewater:
Water scarcity - Right now, about 7% of India’s population don’t have access to safe drinking water. On top of that, around 57% lack proper household sanitation. The water we do have is also getting scarcer. In 2021, the average annual water availability per person was 1486 cubic meters. By 2031, it’s expected to drop to 1367 cubic meters. FYI, if this number falls below 1700 cubic meters, we’re officially in “water-stressed” territory, and below 1000 cubic meters, we hit “water scarcity.”
Economic impact – Dirty water isn't just gross; it's expensive. Water pollution and related diseases put a huge strain on the economy. With 70% of India's surface water contaminated and many people lacking safe drinking water, water-borne diseases are common and cost around USD 600 million annually.
Regulatory requirements - As per regulations, industrial units are required to install effluent treatment plants (ETPs) and treat their effluents to comply with stipulated environmental standards before discharging into rivers and other water bodies. However, many industries still do not treat their water before discharging it. In response, the government has begun taking strict action against those who release untreated water.
So, it's clear: not treating and reusing wastewater has serious consequences. Whether you look at it from an environmental, economic, social, or regulatory angle, treating wastewater is crucial.
2. Massive gap in treat capacity and related infrastructure.

The Central Pollution Control Board (CPCB) reported that in 2020-21, rural areas in India generated about 39,600 MLD (million liters of wastewater per day), while urban areas produced a whopping 72,368 MLD. With the population growing and more people moving to cities, this amount of waste is expected to nearly double by 2050.

In 2020-21, urban areas in India generated 72,368 MLD of wastewater, but the operational treatment capacity was only 26,869 MLD, leaving a massive 63% undercapacity. Shockingly, just 28% of the total wastewater was treated, with the remaining 72% released untreated into water bodies. Even worse, only 12,200 MLD of the treated wastewater met the standards set by the Pollution Control Boards (PCBs/PCCs).
To keep up with the estimated future wastewater generation of 130,639 MLD, India needs to add 3,132 MLD of treatment capacity every year.
Wastewater treatment in India is just getting started but reusing (at a very nascent stage) that water is crucial for optimizing our resources. To give you an idea, in 2020-21, India produced about 72,368 million liters of wastewater daily. If all that water was treated and reused for irrigation, it could have covered around 3.2 million hectares of farmland. That’s about 22 times the size of Delhi! Just imagine the possibilities.
Also, besides sewage treatment plants, only about 30-35% of tier 1 cities have a good sewage network. It's even worse in tier 2 and tier 3 cities. On top of that, around 13-14% of the households targeted by the Jal Jeevan Mission (JJM) still don't have a tap water connection.
So, it's pretty clear that India still has a long way to go when it comes to having proper water infrastructure. This is super important for conserving water and reusing it effectively.
3. Government driving the investments.
It's the various government policies that are driving investments in water and wastewater. The Indian government has been emphasizing the importance of water and has rolled out several schemes for water conservation, treatment, and availability.
Here are six major schemes focused on water supply and wastewater treatment, have you heard of any of these schemes?


According to our estimate and understanding, if the government were to complete what they have envisaged under the above 4 schemes (excluding Atal bhujal yogna & Pradhan Mantri Krishi Sinchai Yogjana) we are expecting an investment of almost Rs. 50,000 – Rs. 60,000 Crores in the next 2-3 years. This project includes work related to sewerage network, water supply networks, Sewage treatment plant and water treatment plants.
4. Stricter CPBC Rules Fuel Growth
Industrial growth and tougher regulations from the CPCB and NGT (National Green Tribunal) are ramping up the need for industrial effluent treatment plants. According to the Environment (Protection) Act, 1986, and the Water (Prevention & Control of Pollution) Act, 1974, industries and local bodies must set up ETPs, CETPs, and STPs to treat their waste before releasing it. The CPCB, SPCBs, and PCCs keep an eye on this and dish out penalties for non-compliance.
Since the NGT’s 2018 order, things have improved. Out of 2,859 heavily polluting industries, 2,197 are up and running, with 2,059 meeting the standards, while 138 are still lagging. Those that don’t comply face show-cause notices and even shutdown orders. So, with stricter rules and booming industrialization, the demand for wastewater treatment plants is definitely on the rise.
Companies engaged across the value chain are given below: -

Conclusion: -
So, it's quite evident that India still has a long way to go in terms of developing proper water infrastructure. This is crucial not just for conserving water, but also for reusing it efficiently. Without the right infrastructure in place, we miss out on huge opportunities to optimize our water resources. Investing in better wastewater treatment and reuse systems can make a massive difference, ensuring we use our water wisely and sustainably for the future.
After all, taking care of our water resources is ultimately for our own benefit. By conserving and reusing water effectively, we secure a better future for ourselves and the generations to come. It's time to step up and prioritize the health of our water systems.
Disclaimers and Disclosures
SEBI Registration No. :INH000017338, IN/AIF3/24-25/1571, IN/AIF2/24-25/1607 | BASL Membership ID: 6276
Investment in Securities Market are subject to market risks. Read all related documents carefully before investing. The securities quoted are for illustration only and are not recommendatory. Registration granted by SEBI, membership of a SEBI recognized supervisory body (if any) and certification from NISM in no way guarantee performance of the intermediary or provide any assurance of returns to investors.

Metals & Mining
Rain Industries Ltd. Q2 2019 Update
Please find the attached note on the quarterly result update of Rain Industries Ltd. Rain Industries Ltd Q2 CY2019 UpdateNiveshaay Rain Industries Ltd Q2 CY 2019 Update Disclaimers and Disclosures SEBI Registration No. :INH000017338, IN/AIF3/24-25/1571, IN/AIF2/24-25/1607 | BASL Membership ID: 6276 Investment in Securities Market are subject to market risks. Read all related documents carefully
Please find the attached note on the quarterly result update of Rain Industries Ltd. Rain Industries Ltd Q2 CY2019 UpdateNiveshaay Rain Industries Ltd Q2 CY 2019 Update
Disclaimers and Disclosures
SEBI Registration No. :INH000017338, IN/AIF3/24-25/1571, IN/AIF2/24-25/1607 | BASL Membership ID: 6276
Investment in Securities Market are subject to market risks. Read all related documents carefully before investing. The securities quoted are for illustration only and are not recommendatory. Registration granted by SEBI, membership of a SEBI recognized supervisory body (if any) and certification from NISM in no way guarantee performance of the intermediary or provide any assurance of returns to investors.

Capital Goods & Engineering
Niveshaay View – Outlook On Indian Equity Market Post The Corporate Tax Rate Cut
We believe FinMin's announcement of Corporate Tax Rate cut is a structural reform which will reap long term benefits. This fiscal bonus is an opportunity that can change the narrative of India’s investment scenario. PFA our note covering this unprecedented move where we express our research deductions on sectors and companies that will be benefiting
We believe FinMin's announcement of Corporate Tax Rate cut is a structural reform which will reap long term benefits. This fiscal bonus is an opportunity that can change the narrative of India’s investment scenario.
PFA our note covering this unprecedented move where we express our research deductions on sectors and companies that will be benefiting the most.
Please feel free to reach out to us for any details or clarification, on- info@niveshaay.com
Niveshaay View – Outlook on Indian Equity Market
Disclaimers and Disclosures
SEBI Registration No. :INH000017338, IN/AIF3/24-25/1571, IN/AIF2/24-25/1607 | BASL Membership ID: 6276
Investment in Securities Market are subject to market risks. Read all related documents carefully before investing. The securities quoted are for illustration only and are not recommendatory. Registration granted by SEBI, membership of a SEBI recognized supervisory body (if any) and certification from NISM in no way guarantee performance of the intermediary or provide any assurance of returns to investors.

Pharmaceuticals
Swiss Glascoat Merger & H1 FY 20 Result Update
Niveshaay published 'The Three Musketeers' Report as on 12th March, 2019. One of our 3 musketeers has been doing exceptionally well. The proposed merger will further place this one in a really nice position to capture the capex growth in specialty chemical and pharma API industry. Please find the attached note on the Merger &
Niveshaay published 'The Three Musketeers' Report as on 12th March, 2019.
One of our 3 musketeers has been doing exceptionally well. The proposed merger will further place this one in a really nice position to capture the capex growth in specialty chemical and pharma API industry.
Please find the attached note on the Merger & Result Update of Swiss Glascoat Ltd.
Swiss Glascoat Merger & Result Update
Disclaimers and Disclosures
SEBI Registration No. :INH000017338, IN/AIF3/24-25/1571, IN/AIF2/24-25/1607 | BASL Membership ID: 6276
Investment in Securities Market are subject to market risks. Read all related documents carefully before investing. The securities quoted are for illustration only and are not recommendatory. Registration granted by SEBI, membership of a SEBI recognized supervisory body (if any) and certification from NISM in no way guarantee performance of the intermediary or provide any assurance of returns to investors.
Metals & Mining
Rain Industries Ltd. Q3 2019 Update
Please find the attached note on the quarterly result update of Rain Industries Ltd. Rain Industries Ltd Q3 2019 Update. Niveshaay Rain Industries Ltd. Q3 CY 2019 Disclaimers and Disclosures SEBI Registration No. :INH000017338, IN/AIF3/24-25/1571, IN/AIF2/24-25/1607 | BASL Membership ID: 6276 Investment in Securities Market are subject to market risks. Read all related documents carefully
Please find the attached note on the quarterly result update of Rain Industries Ltd. Rain Industries Ltd Q3 2019 Update.
Niveshaay Rain Industries Ltd. Q3 CY 2019
Disclaimers and Disclosures
SEBI Registration No. :INH000017338, IN/AIF3/24-25/1571, IN/AIF2/24-25/1607 | BASL Membership ID: 6276
Investment in Securities Market are subject to market risks. Read all related documents carefully before investing. The securities quoted are for illustration only and are not recommendatory. Registration granted by SEBI, membership of a SEBI recognized supervisory body (if any) and certification from NISM in no way guarantee performance of the intermediary or provide any assurance of returns to investors.

Pharmaceuticals
HLE Glascoat Ltd. Q3 FY20 Update
Please find the attached note on the quarterly result update of HLE Glascoat Ltd. Niveshaay - HLE Glascoat Q3 Results Update Disclaimers and Disclosures SEBI Registration No. :INH000017338, IN/AIF3/24-25/1571, IN/AIF2/24-25/1607 | BASL Membership ID: 6276 Investment in Securities Market are subject to market risks. Read all related documents carefully before investing. The securities quoted are
Please find the attached note on the quarterly result update of HLE Glascoat Ltd.
Niveshaay - HLE Glascoat Q3 Results Update
Disclaimers and Disclosures
SEBI Registration No. :INH000017338, IN/AIF3/24-25/1571, IN/AIF2/24-25/1607 | BASL Membership ID: 6276
Investment in Securities Market are subject to market risks. Read all related documents carefully before investing. The securities quoted are for illustration only and are not recommendatory. Registration granted by SEBI, membership of a SEBI recognized supervisory body (if any) and certification from NISM in no way guarantee performance of the intermediary or provide any assurance of returns to investors.

Capital Goods & Engineering
GMR Infrastructure Ltd : Update on stake sale in Airport Business
Please find the below link on Update of GMR Infrastructure Ltd : Update on stake sale in Airport Business Niveshaay - Update on GMR Infrastructure Limited Disclaimers and Disclosures SEBI Registration No. :INH000017338, IN/AIF3/24-25/1571, IN/AIF2/24-25/1607 | BASL Membership ID: 6276 Investment in Securities Market are subject to market risks. Read all related documents carefully before
Please find the below link on Update of GMR Infrastructure Ltd : Update on stake sale in Airport Business
Niveshaay - Update on GMR Infrastructure Limited
Disclaimers and Disclosures
SEBI Registration No. :INH000017338, IN/AIF3/24-25/1571, IN/AIF2/24-25/1607 | BASL Membership ID: 6276
Investment in Securities Market are subject to market risks. Read all related documents carefully before investing. The securities quoted are for illustration only and are not recommendatory. Registration granted by SEBI, membership of a SEBI recognized supervisory body (if any) and certification from NISM in no way guarantee performance of the intermediary or provide any assurance of returns to investors.
Metals & Mining
Rain Industries Ltd. Q4 2019 Update
Please find the attached note on the quarterly result update of Rain Industries Ltd. Niveshaay Rain Industries Ltd Q4 CY 2019 Update Disclaimers and Disclosures SEBI Registration No. :INH000017338, IN/AIF3/24-25/1571, IN/AIF2/24-25/1607 | BASL Membership ID: 6276 Investment in Securities Market are subject to market risks. Read all related documents carefully before investing. The securities quoted
Please find the attached note on the quarterly result update of Rain Industries Ltd.
Niveshaay Rain Industries Ltd Q4 CY 2019 Update
Disclaimers and Disclosures
SEBI Registration No. :INH000017338, IN/AIF3/24-25/1571, IN/AIF2/24-25/1607 | BASL Membership ID: 6276
Investment in Securities Market are subject to market risks. Read all related documents carefully before investing. The securities quoted are for illustration only and are not recommendatory. Registration granted by SEBI, membership of a SEBI recognized supervisory body (if any) and certification from NISM in no way guarantee performance of the intermediary or provide any assurance of returns to investors.
Metals & Mining
Rain Industries Ltd. Q1 2020 Update
Please find the attached note on the quarterly result update of Rain Industries Ltd. Niveshaay Rain Industries Ltd Q1 CY 2020 Disclaimers and Disclosures SEBI Registration No. :INH000017338, IN/AIF3/24-25/1571, IN/AIF2/24-25/1607 | BASL Membership ID: 6276 Investment in Securities Market are subject to market risks. Read all related documents carefully before investing. The securities quoted are
Please find the attached note on the quarterly result update of Rain Industries Ltd.
Niveshaay Rain Industries Ltd Q1 CY 2020
Disclaimers and Disclosures
SEBI Registration No. :INH000017338, IN/AIF3/24-25/1571, IN/AIF2/24-25/1607 | BASL Membership ID: 6276
Investment in Securities Market are subject to market risks. Read all related documents carefully before investing. The securities quoted are for illustration only and are not recommendatory. Registration granted by SEBI, membership of a SEBI recognized supervisory body (if any) and certification from NISM in no way guarantee performance of the intermediary or provide any assurance of returns to investors.
Consumer Durables, Services & Consumption
Niveshaay Amber Enterprises India Ltd Research Report
Amber Enterprises India Ltd is one of the top players in Air Conditioners- Original Equipment Manufacturer (OEM)/ Original Design Manufacture (ODM) industry in India. It has a dominant presence in RACs complete unit and deals in major RAC components and mobile application business with 12 manufacturing facilities across India focusing on different product segments. Please
Amber Enterprises India Ltd is one of the top players in Air Conditioners- Original Equipment Manufacturer (OEM)/ Original Design Manufacture (ODM) industry in India.
It has a dominant presence in RACs complete unit and deals in major RAC components and mobile application business with 12 manufacturing facilities across India focusing on different product segments.
Please find the attached detailed research report on Amber Enterprises.
Niveshaay Amber Enterprises Research Report
Disclaimers and Disclosures
SEBI Registration No. :INH000017338, IN/AIF3/24-25/1571, IN/AIF2/24-25/1607 | BASL Membership ID: 6276
Investment in Securities Market are subject to market risks. Read all related documents carefully before investing. The securities quoted are for illustration only and are not recommendatory. Registration granted by SEBI, membership of a SEBI recognized supervisory body (if any) and certification from NISM in no way guarantee performance of the intermediary or provide any assurance of returns to investors.
Pharmaceuticals
HLE Glascoat Ltd. Q1 FY21 Update
Please find the attached note on the quarterly result update of HLE Glascoat Ltd. Niveshaay - HLE Glascoat Q1 21 Results Update Disclaimers and Disclosures SEBI Registration No. :INH000017338, IN/AIF3/24-25/1571, IN/AIF2/24-25/1607 | BASL Membership ID: 6276 Investment in Securities Market are subject to market risks. Read all related documents carefully before investing. The securities quoted
Please find the attached note on the quarterly result update of HLE Glascoat Ltd.
Niveshaay - HLE Glascoat Q1 21 Results Update
Disclaimers and Disclosures
SEBI Registration No. :INH000017338, IN/AIF3/24-25/1571, IN/AIF2/24-25/1607 | BASL Membership ID: 6276
Investment in Securities Market are subject to market risks. Read all related documents carefully before investing. The securities quoted are for illustration only and are not recommendatory. Registration granted by SEBI, membership of a SEBI recognized supervisory body (if any) and certification from NISM in no way guarantee performance of the intermediary or provide any assurance of returns to investors.

Digital Infrastructure & Connectivity
One year journey on Smallcase Platform
Please find the attached note on Niveshaay's one year journey on smallcase platform. Niveshaay 1 year journey on smallcase platform Disclaimers and Disclosures SEBI Registration No. :INH000017338, IN/AIF3/24-25/1571, IN/AIF2/24-25/1607 | BASL Membership ID: 6276 Investment in Securities Market are subject to market risks. Read all related documents carefully before investing. The securities quoted are for
Please find the attached note on Niveshaay's one year journey on smallcase platform.
Niveshaay 1 year journey on smallcase platform
Disclaimers and Disclosures
SEBI Registration No. :INH000017338, IN/AIF3/24-25/1571, IN/AIF2/24-25/1607 | BASL Membership ID: 6276
Investment in Securities Market are subject to market risks. Read all related documents carefully before investing. The securities quoted are for illustration only and are not recommendatory. Registration granted by SEBI, membership of a SEBI recognized supervisory body (if any) and certification from NISM in no way guarantee performance of the intermediary or provide any assurance of returns to investors.

Digital Infrastructure & Connectivity
Impact of SEBI circular on Niveshaay’s Smallcase Portfolio
SEBI has issued guidelines regarding portfolio allocation rule for multi-cap schemes. Now, multi cap funds will have to invest at least 25% each in large cap, mid cap and small cap. The situation sounds very exciting for small cap investors. Our smallcase portfolio is focused on mid cap and small cap stocks only. 72.5% of
SEBI has issued guidelines regarding portfolio allocation rule for multi-cap schemes. Now, multi cap funds will have to invest at least 25% each in large cap, mid cap and small cap. The situation sounds very exciting for small cap investors.
Our smallcase portfolio is focused on mid cap and small cap stocks only. 72.5% of our total portfolio is invested in quality small cap equities only.
Please find the attached note on Impact of SEBI circular on Niveshaay's smallcase portfolio.
impact-of-sebi-circular-on-niveshaays-smallcase-1DownloadDisclaimers and Disclosures
SEBI Registration No. :INH000017338, IN/AIF3/24-25/1571, IN/AIF2/24-25/1607 | BASL Membership ID: 6276
Investment in Securities Market are subject to market risks. Read all related documents carefully before investing. The securities quoted are for illustration only and are not recommendatory. Registration granted by SEBI, membership of a SEBI recognized supervisory body (if any) and certification from NISM in no way guarantee performance of the intermediary or provide any assurance of returns to investors.

Power & Renewable Energy
Niveshaay – Borosil Renewables Ltd Research Report
niveshaay-borosil-renewables-ltd-1Download The best way to play the solar boom in India - We currently are at an extremely exciting juncture where it is now amply clear that solar PV Technology is the most scalable globally and it’s becoming less prone to disruption as the technology is maturing and a lot of global giants are emerging catering
The best way to play the solar boom in India - We currently are at an extremely exciting juncture where it is now amply clear that solar PV Technology is the most scalable globally and it’s becoming less prone to disruption as the technology is maturing and a lot of global giants are emerging catering to various components of the PV module manufacturing.
The company that we have chosen has an even more interesting position in the market, as it’s the only player in India which has struggled to compete with large Chinese manufactures over the past decade and hence not been able to grow much profitable but now after many years of struggle the company has been able to come at the lower side of the cost curve to compete with the global giants.
Borosil Renewables is part of Borosil group and only domestic manufacture of PV glass in India.
Please find the attached detailed research note on Borosil Renewables Ltd.
Disclaimers and Disclosures
SEBI Registration No. :INH000017338, IN/AIF3/24-25/1571, IN/AIF2/24-25/1607 | BASL Membership ID: 6276
Investment in Securities Market are subject to market risks. Read all related documents carefully before investing. The securities quoted are for illustration only and are not recommendatory. Registration granted by SEBI, membership of a SEBI recognized supervisory body (if any) and certification from NISM in no way guarantee performance of the intermediary or provide any assurance of returns to investors.

Power & Renewable Energy
Borosil Renewables Ltd. Q3 FY21 Update
Please find the attached note on the quarterly result update of Borosil Renewables Ltd. niveshaay-borosil-renewables-updateDownload Disclaimers and Disclosures SEBI Registration No. :INH000017338, IN/AIF3/24-25/1571, IN/AIF2/24-25/1607 | BASL Membership ID: 6276 Investment in Securities Market are subject to market risks. Read all related documents carefully before investing. The securities quoted are for illustration only and are
Please find the attached note on the quarterly result update of Borosil Renewables Ltd.
niveshaay-borosil-renewables-updateDownloadDisclaimers and Disclosures
SEBI Registration No. :INH000017338, IN/AIF3/24-25/1571, IN/AIF2/24-25/1607 | BASL Membership ID: 6276
Investment in Securities Market are subject to market risks. Read all related documents carefully before investing. The securities quoted are for illustration only and are not recommendatory. Registration granted by SEBI, membership of a SEBI recognized supervisory body (if any) and certification from NISM in no way guarantee performance of the intermediary or provide any assurance of returns to investors.

Electronic Manufacturing Services
Green Energy Portfolio
This is a portfolio of stocks, which will get benefit from the energy transition. Energy transition refers to the global energy sector’s shift from fossil-based systems of energy production and consumption — including oil, natural gas, and coal — to renewable energy sources like wind and solar, as well as other sources like biofuels. To
This is a portfolio of stocks, which will get benefit from the energy transition. Energy transition refers to the global energy sector’s shift from fossil-based systems of energy production and consumption — including oil, natural gas, and coal — to renewable energy sources like wind and solar, as well as other sources like biofuels.
To know more about the portfolio please click on the mentioned link
green-energy-portfolioDownloadhttps://niveshaay.smallcase.com/smallcase/NIVTR_0001
Disclaimers and Disclosures
SEBI Registration No. :INH000017338, IN/AIF3/24-25/1571, IN/AIF2/24-25/1607 | BASL Membership ID: 6276
Investment in Securities Market are subject to market risks. Read all related documents carefully before investing. The securities quoted are for illustration only and are not recommendatory. Registration granted by SEBI, membership of a SEBI recognized supervisory body (if any) and certification from NISM in no way guarantee performance of the intermediary or provide any assurance of returns to investors.

Power & Renewable Energy
Niveshaay’s Smallcase Q1 FY 22 Performance Update
Q1 FY 22 was absolutely fantastic for the Small-cap index, the small-cap index has delivered a 12% higher return to Nifty 50. Shares of Small-cap companies have been on a roll with the Small-Cap index hitting a new high in the last quarter. Ample liquidity in the market combined with government efforts to revive the
Q1 FY 22 was absolutely fantastic for the Small-cap index, the small-cap index has delivered a 12% higher return to Nifty 50. Shares of Small-cap companies have been on a roll with the Small-Cap index hitting a new high in the last quarter.
Ample liquidity in the market combined with government efforts to revive the economy boosted the investor sentiments and took markets to higher levels.
It was one of the best quarters for Niveshaay. Our Mid and Small-cap focused portfolio was up by 44.88% and the Green energy portfolio was up by 35.38% in comparison to the 17.53% return of Nifty Smallcap 100.
Please find attached an analysis of Niveshaay's Q1 FY 22 performance
Click to access q1-fy-22-niveshaay-performance-update-1.pdf
Disclaimers and Disclosures
SEBI Registration No. :INH000017338, IN/AIF3/24-25/1571, IN/AIF2/24-25/1607 | BASL Membership ID: 6276
Investment in Securities Market are subject to market risks. Read all related documents carefully before investing. The securities quoted are for illustration only and are not recommendatory. Registration granted by SEBI, membership of a SEBI recognized supervisory body (if any) and certification from NISM in no way guarantee performance of the intermediary or provide any assurance of returns to investors.
Metals & Mining
Rain Industries Ltd. CY Q2 2021 Update
Rain Industries Ltd. reported results that were exactly in-line with the expectations. The company was able to maintain normalised margins despite increase in raw material cost. Please find the attached note on the quarterly result update of Rain Industries Ltd. rain-industries-ltd-q2-cy21Download Disclaimers and Disclosures SEBI Registration No. :INH000017338, IN/AIF3/24-25/1571, IN/AIF2/24-25/1607 | BASL Membership ID: 6276
Rain Industries Ltd. reported results that were exactly in-line with the expectations. The company was able to maintain normalised margins despite increase in raw material cost.
Please find the attached note on the quarterly result update of Rain Industries Ltd.
rain-industries-ltd-q2-cy21DownloadDisclaimers and Disclosures
SEBI Registration No. :INH000017338, IN/AIF3/24-25/1571, IN/AIF2/24-25/1607 | BASL Membership ID: 6276
Investment in Securities Market are subject to market risks. Read all related documents carefully before investing. The securities quoted are for illustration only and are not recommendatory. Registration granted by SEBI, membership of a SEBI recognized supervisory body (if any) and certification from NISM in no way guarantee performance of the intermediary or provide any assurance of returns to investors.

Digital Infrastructure & Connectivity
Correction in Smallcap Index – Time to Recall optimism and Add more?
Dear Investors, One should understand that the fluctuations in the markets are inevitable and one cannot expect linear returns in Equity Market. Market returns are cyclical in nature which are caused by corrections and fluctuations in the market are followed by a phenomenal wealth creation journey. The lull period is the time to accumulate good
Dear Investors,
One should understand that the fluctuations in the markets are inevitable and one cannot expect linear returns in Equity Market. Market returns are cyclical in nature which are caused by corrections and fluctuations in the market are followed by a phenomenal wealth creation journey. The lull period is the time to accumulate good quality companies that have earnings visibility and managed their capital efficiently and are available at reasonable valuation and there is an opportunity to make huge returns in the subsequent period.
Correction in the market?
The year 2021 was absolutely one of the best years for the small and mid-cap sectors. Small-cap Index has Year to date (YTD) rallied around 35%, supported by strong earnings growth in many sectors.
In the last few days, we have witnessed a reasonable correction (10% in the Smallcap index and 15-20% in few good companies) in the small-cap companies after a long time. If we check on long-term chart correction is not very big. But, we believe this is a good opportunity to start adding some lump-sum amount in the portfolio or increase your SIP amount for the next few months. E.g. if anyone has a spare amount of Rs. 10 lakh, then he can deploy Rs. 2.5 lakh.
Nifty Smallcap vs Niveshaay Smallcase Portfolio
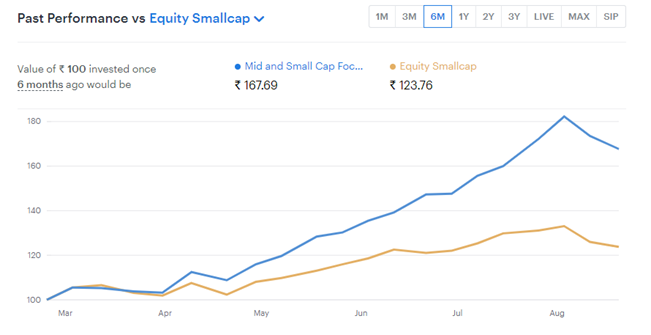
Before this correction, we were guiding everyone to invest in SIP mode only. Now with ongoing correction, we changed our view on the market and believe this is a good time to add some lump-sum amount to the portfolio or increase your SIP amount for the next few months.
We firmly believe that our investment thesis remains intact and we believe that in the long run, our invested companies have the potential to deliver better risk adjusted returns.
In India especially, there are a lot of opportunities to find such companies as the management doesn’t explain its business very evidently. So, the probability of mispricing is very high. This is the time when one needs to remember the basics of investing to keep patience and slowly build a portfolio with a long-term view. Overall, we believe that we have a good set of companies in our portfolio and also a lot of quality companies have come down at reasonable valuations, these can perform well in the future with a 2-3 years investment time horizon.
Thank-you for choosing Niveshaay! We are glad for the trust you placed in us and are committed to provide you the best of our services. Thank-you for your continued interest and support towards Niveshaay.
Disclaimers and Disclosures
SEBI Registration No. :INH000017338, IN/AIF3/24-25/1571, IN/AIF2/24-25/1607 | BASL Membership ID: 6276
Investment in Securities Market are subject to market risks. Read all related documents carefully before investing. The securities quoted are for illustration only and are not recommendatory. Registration granted by SEBI, membership of a SEBI recognized supervisory body (if any) and certification from NISM in no way guarantee performance of the intermediary or provide any assurance of returns to investors.
Electronic Manufacturing Services
Borosil Renewables Ltd. – The rising solar giant of India
The exemplary journey of Borosil Renewables Ltd. where it has recently crossed $ 1 billion market cap which was around $ 10 million to $ 100 million for almost a decade. The story of Borosil Renewables Ltd. is one for corporate India to stand and notice. For almost a decade it struggled and just kept
The exemplary journey of Borosil Renewables Ltd. where it has recently crossed $ 1 billion market cap which was around $ 10 million to $ 100 million for almost a decade.
The story of Borosil Renewables Ltd. is one for corporate India to stand and notice. For almost a decade it struggled and just kept itself alive in the onslaught of Chinese competition which killed the solar glass factories around the world.

When most of the entrepreneurs around the world gave up, Mr. Kheruka just hung on there. He sprang into action at the very first sight of opportunity and like a true champion moved with God speed and made the company ready for its biggest leap ever.
Luck came on their way, where the Chinese couldn't ship containers and defaulted on commitments, the Indian government also gave it another home run by imposing import duties. On seeing the opportunity, the eyes of our Indian tiger lit up and took the Chinese hands on and set on a journey to expand its territory.
Onlookers kept on questioning and doubting but Mr. Kheruka kept on announcing new capacities to fend off any competition that started on the way thinking of attacking its castle.
We are happy to ride this fantastic journey and with almost 10x returns it's more than a dream come true for us.
Checkout our detailed research note on Borosil Renewables Ltd. - https://niveshaay.wordpress.com/2020/12/14/niveshaay-borosil-renewables-ltd-research-report/
Entrepreneurs like him are true inspiration and lead by example who make our country, investors and all the stakeholders proud and confident.
While our research work on the enterprise and management of Borosil, it prompted us to look even further into the sector for other such strong companies and trigger. During the whole process we caught hold a good comfort with the sector.
Keeping this rationale in mind, we introduced our “Green Energy” smallcase portfolio in March, 2021 on the theme of “Energy transition - towards renewable energy sources”. Energy transition refers to the global energy sector’s shift from fossil-based systems of energy production and consumption — including oil, natural gas, and coal — to renewable energy sources like wind and solar, as well as other sources like biofuels.
With this shift in trend towards renewable and clean sources of energy, companies within the industry are expected to flourish. Also, with the Government’s support such as raise of Production Linked Incentive (PLI) scheme funding from Rs. 4500 Cr to Rs. 24000 Cr the “Green energy” sector will be benefitted.
Our Green Energy smallcase has delivered a return of 108.93% till date.
The portfolio has outperformed for the last month also with a phenomenal return of 12.79% compared to the equity smallcap return of -2.27% and nifty return of -5.71%.
Had you invested Rs. 1 Lakh in Niveshaay’s green energy smallcase a month back, it would have given Rs. 1,12,790/- back.
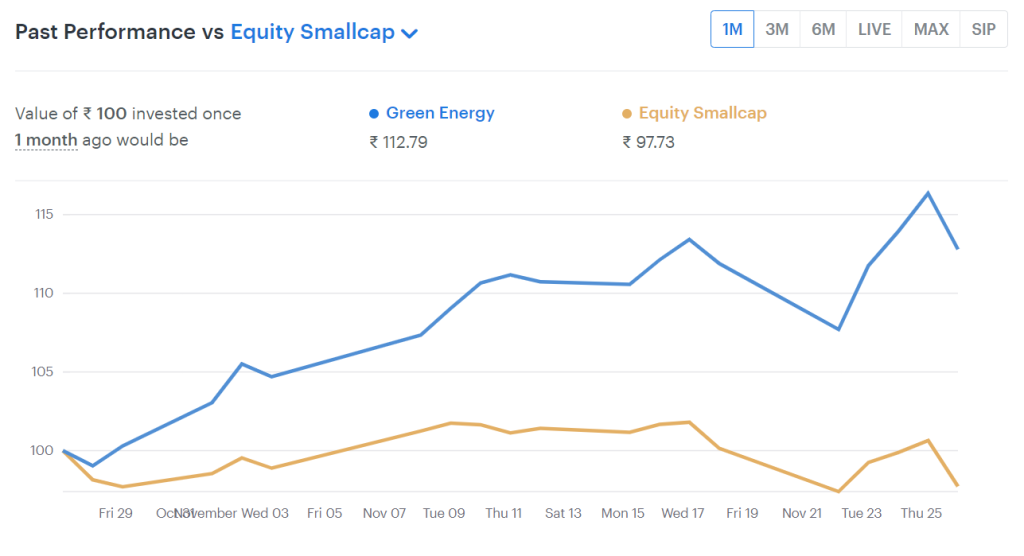
Had you invested Rs. 1 Lakh in Niveshaay’s green energy smallcase at the inception, it would have given Rs. 2,08,930/- back.
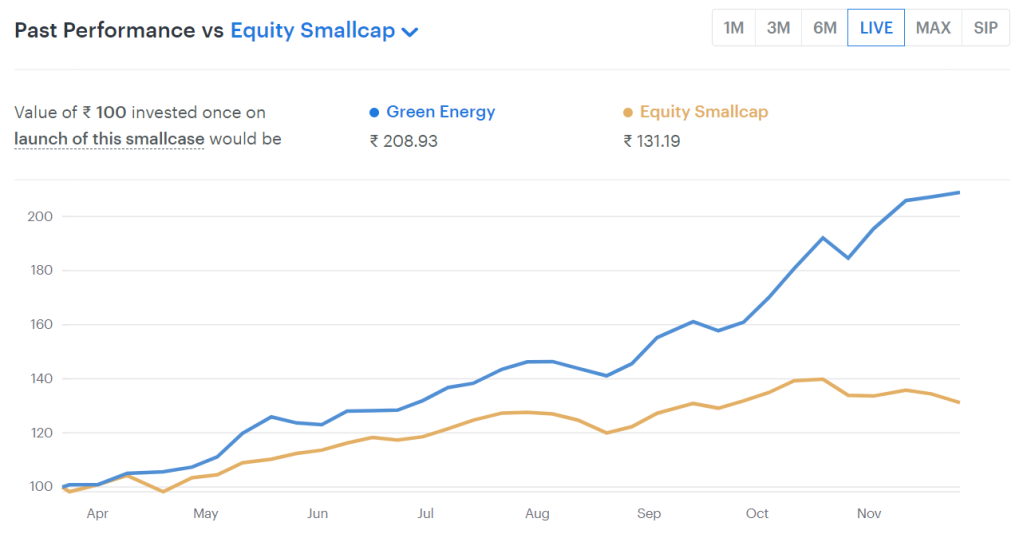
We thank our patrons for choosing Niveshaay!
Happy Investing!
Disclaimers and Disclosures
SEBI Registration No. :INH000017338, IN/AIF3/24-25/1571, IN/AIF2/24-25/1607 | BASL Membership ID: 6276
Investment in Securities Market are subject to market risks. Read all related documents carefully before investing. The securities quoted are for illustration only and are not recommendatory. Registration granted by SEBI, membership of a SEBI recognized supervisory body (if any) and certification from NISM in no way guarantee performance of the intermediary or provide any assurance of returns to investors.
Aerospace & Defense
Our Take on the Budget 2022-23
Builds on the growth momentum through a Higher Multiplier Effect (Manufacturing, Digitization and Sustainability) CAPEX to continue to drive growth The Indian economy is expected to grow at 9.2 per cent in FY22. The priority in the budget was to sustain the high growth. The major thrust was on reviving the capital expenditure cycle in
The Indian economy is expected to grow at 9.2 per cent in FY22. The priority in the budget was to sustain the high growth. The major thrust was on reviving the capital expenditure cycle in the country. The rise in capital expenditure helps to crowd in private investment. The virtuous cycle of investments begins in the economy. Capex has a higher multiplier effect on economic output over revenue spending. The capital spending push will also induce demand for services and manufactured inputs from large industries and micro, small and medium enterprises (MSMEs), while helping farmers through better infrastructure. The focus is on building infrastructure, housing and promoting digital economy.
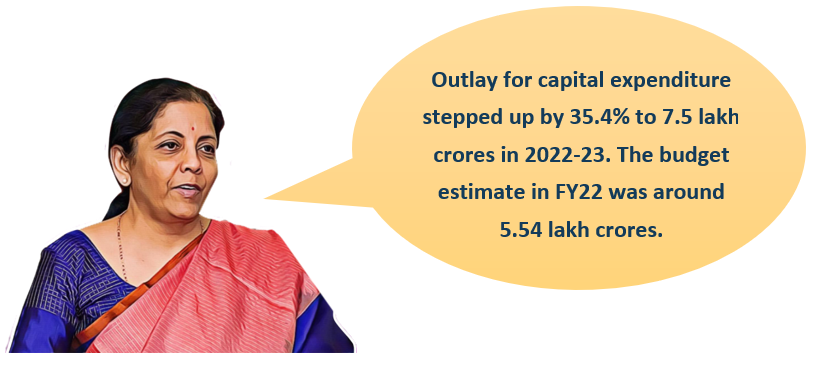
Our View
Staying true to our investment style, we’ll focus on companies where competition is limited, plays a pivotal role in the manufacturing process and an indirect play on the expected high growth in a broad sector.
2. Transportation and Logistics: link to growth of trade and economic activities
This is expected to benefit key infrastructure and logistics players.
3. A GREEN BUDGET for the greener future
Energy transition, energy efficiency, electric mobility, and supporting renewable energy infrastructure was the key theme of the budget 2022-23. Promoting energy transition and climate action was one of the key focus areas.
CONCLUSION
Overall, the budget can be described as a pro-growth budget with a more stable tax regime. As an equity investor, we will find our pockets of growth from the budget. It aimed to reduce duty on imports on certain raw materials to ease on the higher prices like chemicals, stainless steel etc. It is always said that any individual should focus on their strengths. The key idea of the budget was to focus on India’s strengths from both domestic and export perspective and be Gung Ho towards growth.
Disclaimers and Disclosures
SEBI Registration No. :INH000017338, IN/AIF3/24-25/1571, IN/AIF2/24-25/1607 | BASL Membership ID: 6276
Investment in Securities Market are subject to market risks. Read all related documents carefully before investing. The securities quoted are for illustration only and are not recommendatory. Registration granted by SEBI, membership of a SEBI recognized supervisory body (if any) and certification from NISM in no way guarantee performance of the intermediary or provide any assurance of returns to investors.

Electric Vehicle & Ancillaries
Year end review FY 2021-22
Dear Investors, Prima Facie, equity as an asset class in last 2 years has given splendid returns to investors given the low base formed in March 2020. Our strategy has turned out to be fruitful in out-performing the market. With immense gratitude, we are happy to say that our portfolio has been amongst the top
Dear Investors,
Prima Facie, equity as an asset class in last 2 years has given splendid returns to investors given the low base formed in March 2020. Our strategy has turned out to be fruitful in out-performing the market. With immense gratitude, we are happy to say that our portfolio has been amongst the top performers on smallcase.
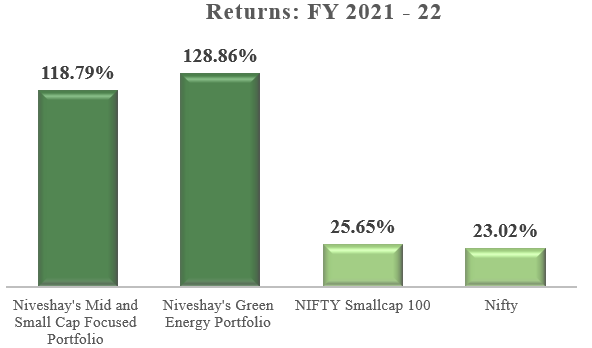
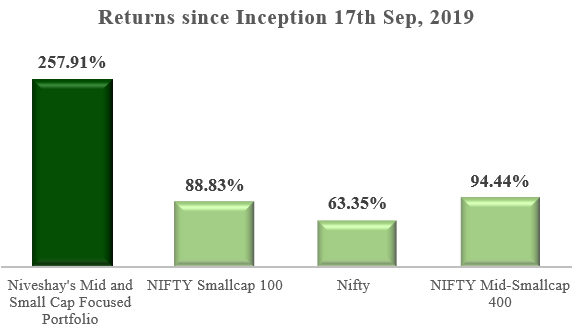
From here on, should we keep our expectations moderate and realistic? Will the markets fall? These are the most frequently asked questions to any investor. Let’s put things in context.
Amid the market mayhem, sticking to your investment process, research, discipline, patience and not to miss the luck factor did result in superior returns for investors. Let’s keep this in mind and move forward.
FY21 was an eventful year. FY22 continued the streak, began with a fatal second COVID-19 wave and ended with Russia-Ukraine conflict with energy crisis in Europe, Sri-Lanka economic crisis and supply chain disruptions in between resulting in high commodity prices creating inflationary environment. What remained common is that Indian economy emerged resilient and stronger getting benefited due to supply chain disruptions, China +1 and most importantly prudent government support policies in few sectors. Not to miss, the record IPOs that came in FY22. Where are we currently? FY23 also, began on a high note. At Niveshaay, analysing the current scenario characterised by too many moving parts, we are following a stock specific approach where we see structural trend.
How are we picking up stocks?
The best characteristics of equity markets is that we can switch to sectors which are doing well amid the chaos taking benefit of China +1 strategy, inflationary environment etc. For instance, commodity producers (metals, mining, oil and gas etc.) are having a good time while the commodity consumers (Auto, FMCG and consumer durables etc) are having difficulties in passing on the increased prices. Of course, some sectors are unaffected too rather witnessing tailwinds like the IT and Pharma.
We started tracking manufacturing sector in 2016, and little did we know that five years later, the sector would witness upswings from structural and persistent trends like China plus one, consolidation in supplier base and strong government focus. Connecting the dots, looks like India is getting benefitted from these trends owing to certain competitive advantages like cheap labour, low interest rate, favourable government policies, ease of doing business and India is a huge market in itself.
Having said that, the Budget 2022-23 continued the growth momentum through a higher multiplier effect. The major thrust was on reviving the capital expenditure cycle in the country through PLI-Scheme, China plus one and imposing anti-dumping duty boosting domestic production. The rise in capital expenditure helps to crowd in private investment. The virtuous cycle of investments begins in the economy. Capex has a higher multiplier effect on economic output over revenue spending. Investment cycle has bottomed out. Investment contribution to GDP has reduced to 26.7% in FY21 from peak of 36% in FY07. The value of new projects in quarter ended March, 2022 was Rs. 5.1 lakh crores, 53.6 % higher qoq and double when compared to the previous year quarter (Source: CMIE).
Staying true to our investment style, we’ll continue to focus on companies where competition is limited, plays a pivotal role in the manufacturing process and an indirect play on the expected high growth in a broad sector. Here, we are broadly focusing on building materials, textiles, chemicals, metals etc.
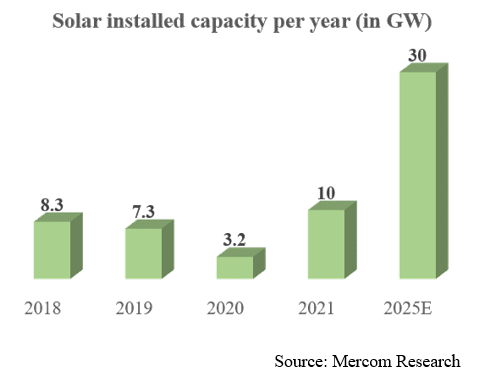
Another theme, which we continue to remain bullish on is the renewable energy space. This sector is benefitting from the government impetuous and now the entry of private sector (Reliance Industries) signals a green time in this sector has come. Also, Indian players are becoming competitive globally. When the world is moving towards sustainability, companies doing their bit in achieving the same, then why not tap these opportunities and be a part of their growth story when they are literally getting premium for their products?
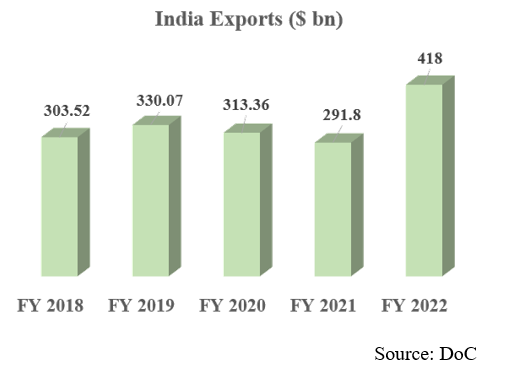
Also, focus is on Exports. The pandemic has certainly built a framework for India to find a pivotal place in the global value chain in some sectors like chemicals and textiles. According to commerce and industry ministry, the exports of $418 bn in FY22 surpassed the government target by 5%.
India is a growing country where penetration of many products is very low. So, looking at consumption sector becomes important and also insulating cyclical nature of our portfolio at the same time.
Overall, we look forward to play on such themes, keep evolving with time and continue to analyse trends with fresh perspective.
A BIG THANK YOU to all our subscribers for trusting us in your wealth creation journey. We will continue to stick to our process and give our one hundred percent always.
Happy Investing!
Disclaimers and Disclosures
SEBI Registration No. :INH000017338, IN/AIF3/24-25/1571, IN/AIF2/24-25/1607 | BASL Membership ID: 6276
Investment in Securities Market are subject to market risks. Read all related documents carefully before investing. The securities quoted are for illustration only and are not recommendatory. Registration granted by SEBI, membership of a SEBI recognized supervisory body (if any) and certification from NISM in no way guarantee performance of the intermediary or provide any assurance of returns to investors.